This simple guide will take you through how to Measure CPU Usage in Linux. CPU is critical to every other system operations. If a process consumes too much of CPU such that it becomes unavailable to other process, it causes performance bottleneck. Therefore, in order to troubleshoot any CPU related problems, you can use any of the following tools.
Measuring CPU Usage in Linux
Some of the commands used in Linux to check CPU usage include;
iostat
The iostat command is used to report the CPU statistics as well as input/output statistics for devices and partitions since last system boot (run without options).
The command syntax is:
iostat [options] [interval [count] ]- The interval parameter specifies the amount of time in seconds between each report.
- The count parameter value if specified, determines the number of reports generated at interval seconds apart.
- If the interval parameter is specified without the count parameter, the iostat command generates reports continuously one after the other at a specified interval.
When run with options, the first report generated provides statistics since the system was booted. If -y option is used, it will omit the first report and each subsequent report covers the time since the previous report.
Example usage
To display two CPU utilization reports at an interval of 2 seconds;
iostat -c 2 2
Linux 4.13.0-45-generic (kifarunix.example.com) 	10/15/2018 	_x86_64_	(4 CPU)

avg-cpu:  %user   %nice %system %iowait  %steal   %idle
          10.19    0.06    4.70    1.29    0.00   83.75

avg-cpu:  %user   %nice %system %iowait  %steal   %idle
           6.88    0.00    2.63    0.63    0.00   89.86
vmstat
vmstat reports information about processes, memory, paging, block IO, traps, disks and CPU
activity. The first report produced gives averages since the last reboot. Additional reports give information on a sampling period of length delay.
The vmstat command syntax is:
vmstat [options] [delay [count]]- The delay value specifies the delay between updates in seconds. If no delay is specified, only one report is printed with the average values since boot.
- The count value specifies the number of updates. In absence of count, when delay is defined, default is infinite.
Example:
Display two reports at an interval of two seconds;
vmstat 2 2
procs -----------memory---------- ---swap-- -----io---- -system-- ------cpu-----
 r  b   swpd   free   buff  cache   si   so    bi    bo   in   cs us sy id wa st
 0  0      0 8125588 215568 4422912    0    0    43    70  330  157 10  5 84  1  0
 0  0      0 8143808 215568 4423880    0    0     0    22  902 4031  4  4 92  0  0
The highlighted column shows CPU statistics;
us: reports the amount of time that the processor spends on userland tasks
sy: Time spent running kernel code.  (system time)
id: Time spent idle.
wa: Time spent waiting for IO.
st: Time stolen from a virtual machine.
ps
ps displays information about a selection of the active processes. It also shows how much CPU percentage the processes are consuming.
For example, to show the %CPU, PID, USER associated with the process and COMMAND run, run the command below.
ps -eo pcpu,pid,user,argsYou may also sort the output in reverse order using the %CPU column as shown below;
ps -eo pcpu,pid,user,args | sort -r -k1 | lesstop
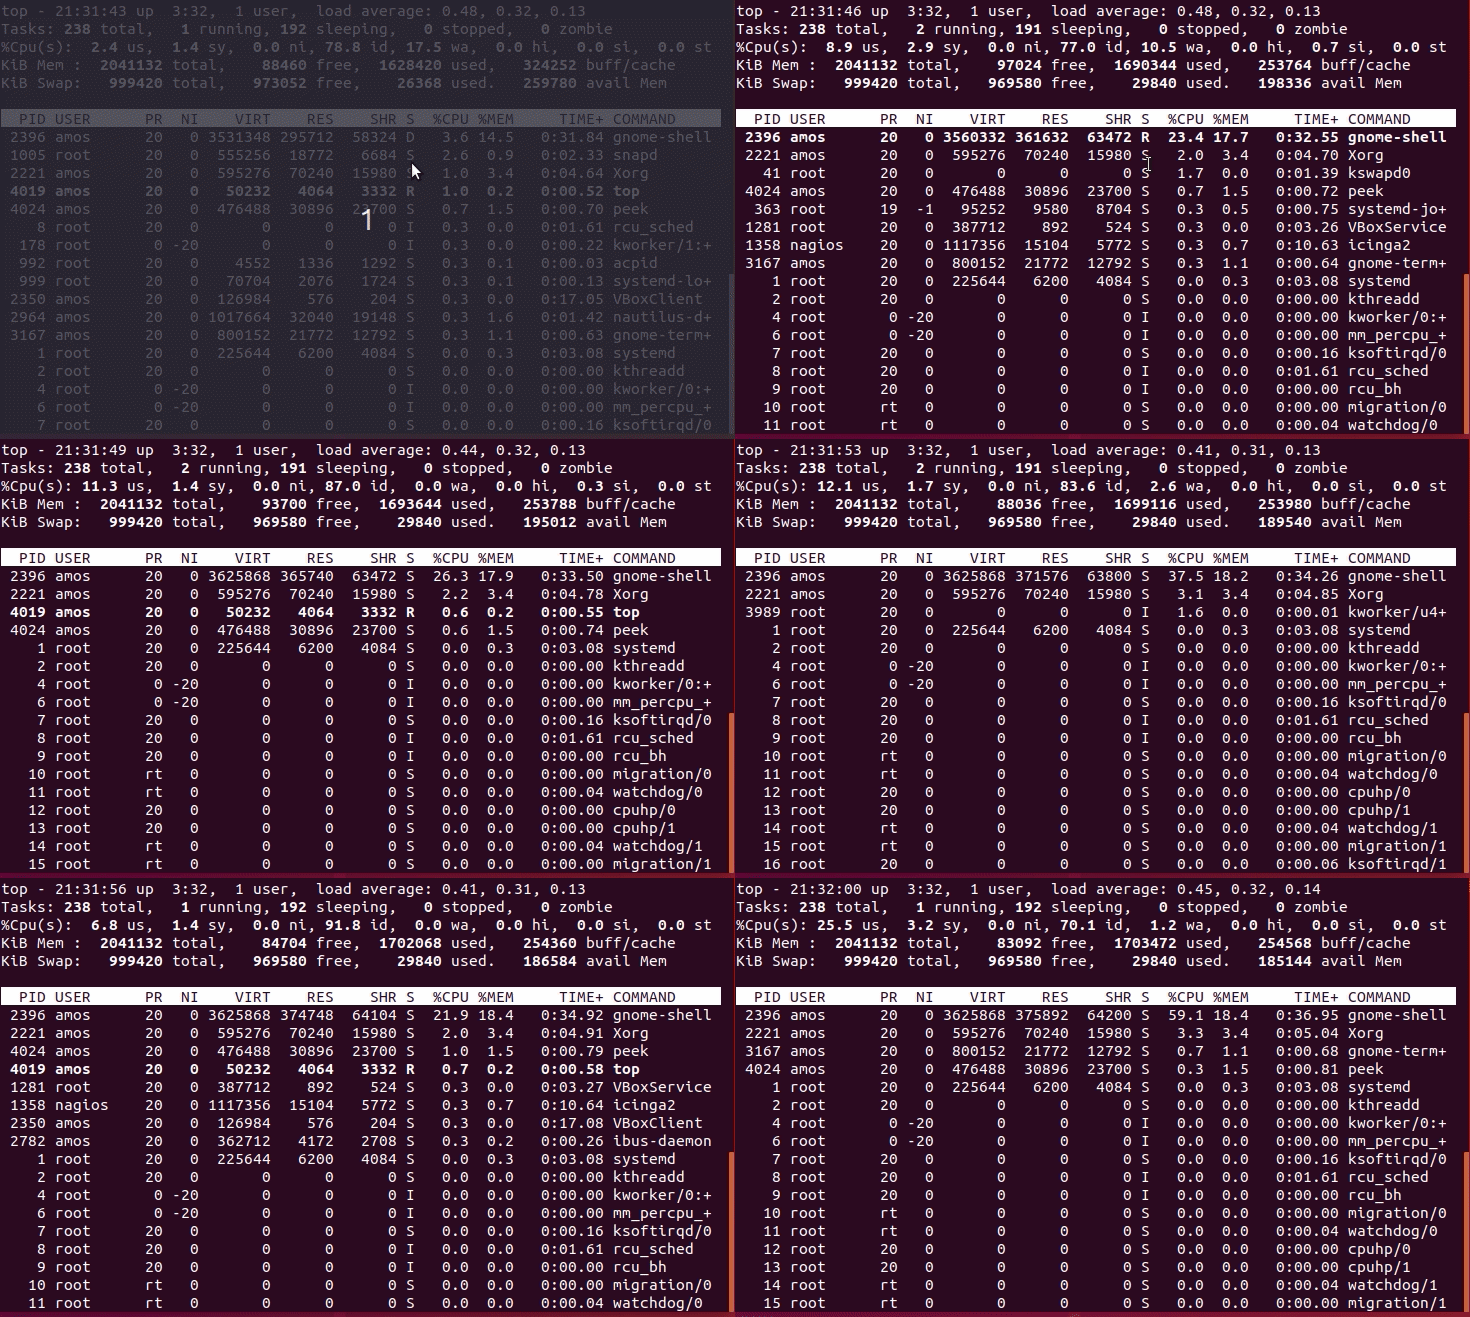
The top program provides a dynamic real-time view of a running system. It can display system summary information as well as a list of processes or threads currently being managed by the Linux kernel. To run this command, just type top on terminal.
topTo sort the output by the %CPU usage, type P.

htop
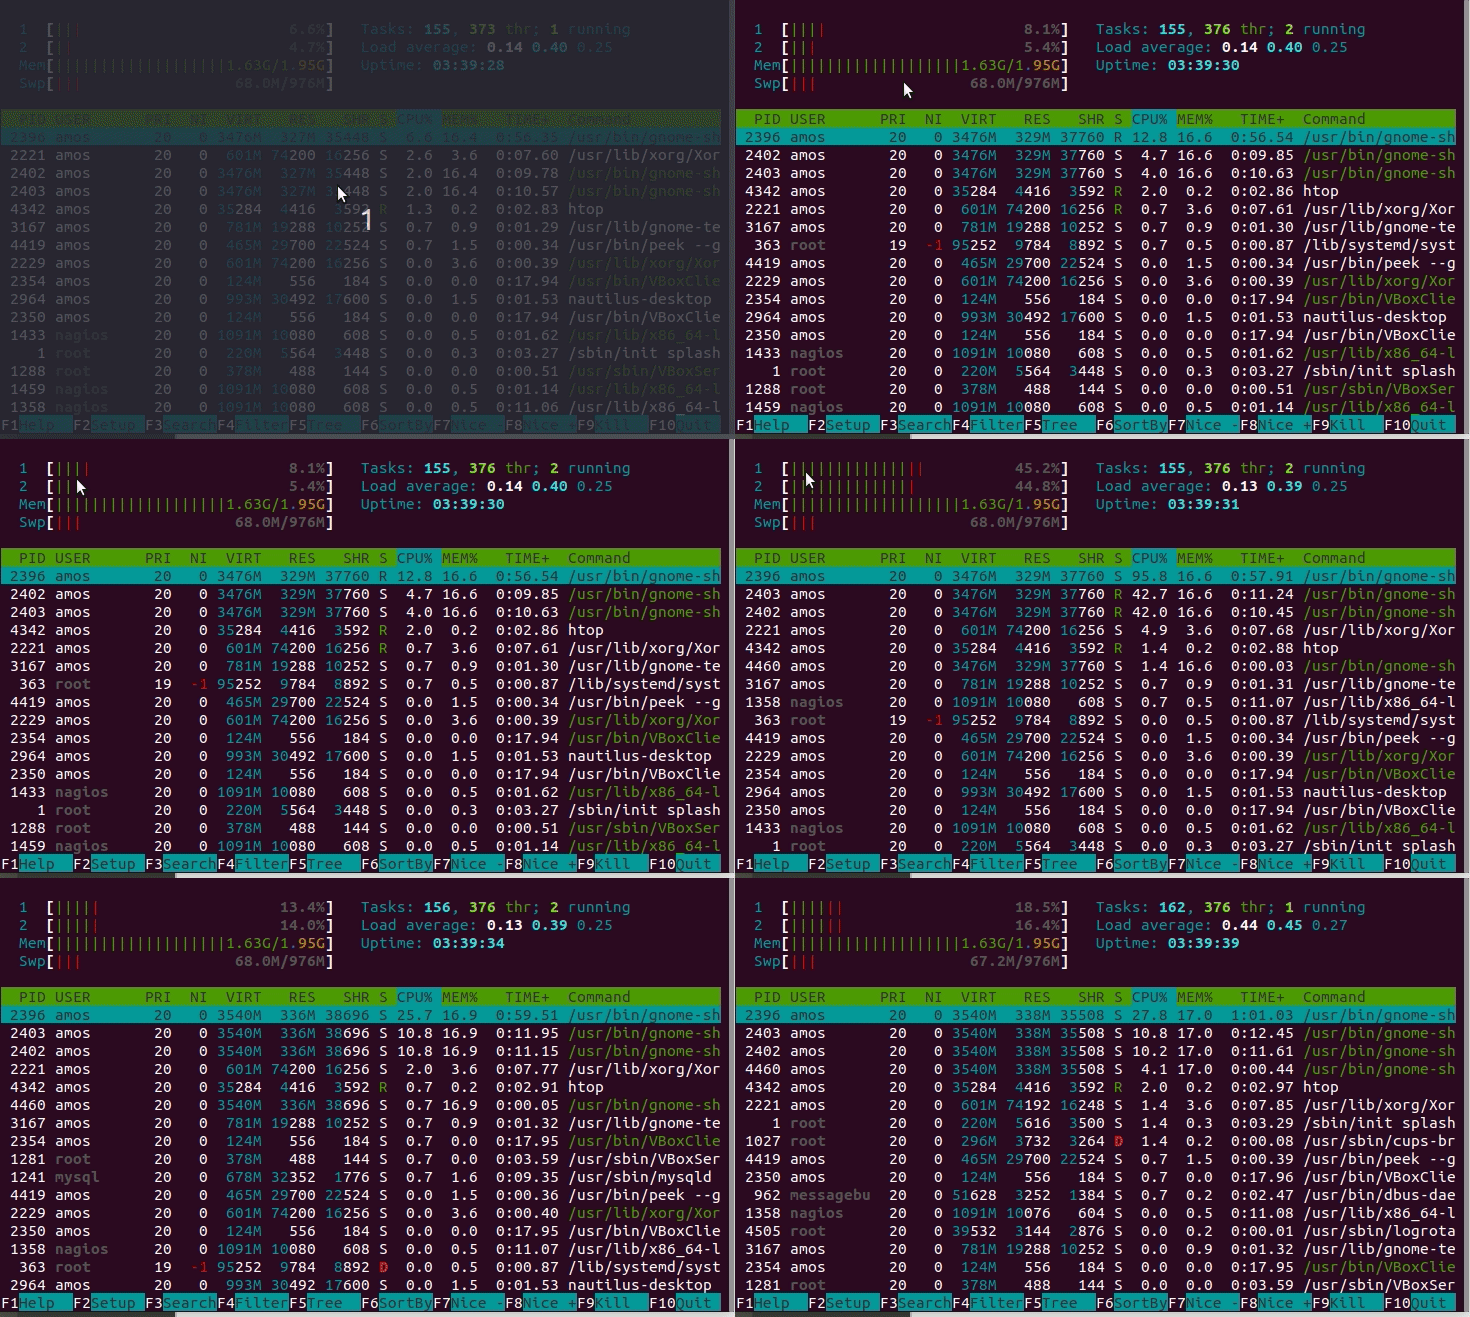
htop is an interactive process viewer similar to top. It allows you to scroll vertically and horizontally so you can see all the processes running on the system, along with their full command lines, as well as viewing them as a process tree, selecting multiple processes and acting on them all at once.
htop can be used to determine percentage CPU usage along with memory and swap usage statistics.
Launch htop by typing;
htop
The top-left section shows the CPU and memory usage statistics. To sort the output by the %CPU usage, type P. You can also launch htop with the following command to sort the ouput with by Percentage CPU usage.
htop -s PERCENT_CPUOn the CPU information on the left corner, you may spot three different colours; Green, Red or Blue. They indicate Normal user process, Kernel process and Low priority process respectively.
sar
sar program collects, reports, or saves system activity information.
- It writes to standard output the contents of selected cumulative activity counters in the operating system. The accounting system, based on the values in the count and interval
parameters, writes information the specified number of times spaced at the specified intervals in seconds. - If the interval parameter is set to zero, the sar command displays the average statistics for the time since the system was started.
- If the interval parameter is specified without the count parameter, then reports are generated continuously.
- The collected data can also be saved in the file specified by the -o filename flag, in addition to being displayed onto the screen e.g sar -u ALL 1 2 -o /tmp/sar
- If filename is omitted, sar uses the standard system activity daily data file. Standard system activity daily data files are named saDD or saYYYYMMDD, where YYYY stands for the current year, MM for the current month and DD for the current day.
- The collected data saved to a file can only be read using sar command e.g sar -f /tmp/sar
To check CPU usage using sar command, you need to pass the -u switch e.g to display two reports at interval of one second,
sar -u 1 2
Linux 4.13.0-45-generic (kifarunix.example.com) 	10/15/2018 	_x86_64_	(4 CPU)

10:36:38 AM     CPU     %user     %nice   %system   %iowait    %steal     %idle
10:36:39 AM     all     30.23      0.00      3.78      0.00      0.00     65.99
10:36:40 AM     all     30.73      0.00      3.78      0.00      0.00     65.49
Average:        all     30.48      0.00      3.78      0.00      0.00     65.74
Where by:
- %system: Percentage of CPU utilization that occurred while executing at the kernel level
- %iowait: Percentage of time that the CPU(s) were idle during which the system had an
outstanding disk I/O request. - %steal: Percentage of time spent in involuntary wait by the virtual CPU(s) while the
hypervisor was servicing another virtual processor. - %idle: Percentage of time that the CPU(s) were idle and the system did not have an
outstanding disk I/O request. - %user: Percentage of CPU utilization that occurred while executing at the user level
- %nice: Percentage of CPU utilization that occurred while executing at the user level with
nice priority.
mpstat
The mpstat command writes to standard output activities for each available processor, processor 0 being the first one. The command line syntax for mpstat is:
mpstat [options] [interval[ [count]- The interval parameter specifies the amount of time in seconds between each report. A value of 0 (or no parameters at all) reports processors statistics for the time since system startup (boot).
- The value of count determines the number of reports generated at interval seconds apart.
- If the interval parameter is specified without the count parameter, the mpstat command generates reports continuously
Examples
To display two reports on all processors at an interval of two seconds;
mpstat 2 2
Linux 4.13.0-45-generic (kifarunix.example.com) 	10/14/2018 	_x86_64_	(4 CPU)

11:23:31 AM  CPU    %usr   %nice    %sys %iowait    %irq   %soft  %steal  %guest  %gnice   %idle
11:23:33 AM  all   27.30    0.00    4.91    0.00    0.00    0.13    0.00    0.00    0.00   67.67
11:23:35 AM  all   27.44    0.00    5.89    0.25    0.00    0.38    0.00    0.00    0.00   66.04
Average:     all   27.37    0.00    5.40    0.13    0.00    0.25    0.00    0.00    0.00   66.85
To display one report for individual processor at an interval of two seconds;
mpstat -P ALL 2 1
Linux 4.13.0-45-generic (kifarunix.example.com) 	10/14/2018 	_x86_64_	(4 CPU)

11:27:08 AM  CPU    %usr   %nice    %sys %iowait    %irq   %soft  %steal  %guest  %gnice   %idle
11:27:10 AM  all   27.75    0.00    4.50    0.00    0.00    0.00    0.00    0.00    0.00   67.75
11:27:10 AM    0    4.52    0.00    5.03    0.00    0.00    0.00    0.00    0.00    0.00   90.45
11:27:10 AM    1    3.02    0.00    5.53    0.00    0.00    0.00    0.00    0.00    0.00   91.46
11:27:10 AM    2    4.98    0.00    5.47    0.00    0.00    0.00    0.00    0.00    0.00   89.55
11:27:10 AM    3   98.49    0.00    1.51    0.00    0.00    0.00    0.00    0.00    0.00    0.00

Average:     CPU    %usr   %nice    %sys %iowait    %irq   %soft  %steal  %guest  %gnice   %idle
Average:     all   27.75    0.00    4.50    0.00    0.00    0.00    0.00    0.00    0.00   67.75
Average:       0    4.52    0.00    5.03    0.00    0.00    0.00    0.00    0.00    0.00   90.45
Average:       1    3.02    0.00    5.53    0.00    0.00    0.00    0.00    0.00    0.00   91.46
Average:       2    4.98    0.00    5.47    0.00    0.00    0.00    0.00    0.00    0.00   89.55
Average:       3   98.49    0.00    1.51    0.00    0.00    0.00    0.00    0.00    0.00    0.00
Upto that far you should now be able to troubleshoot any CPU related issue using any of the above utilities. Please refer to man pages for each utility to explore a comprehensive description of options used with each of them. Also note that CPU monitoring tools are not limited to the above. Feel free to dig further.
That closes our guide on how to measure CPU Usage in Linux.
Other Tutorials
How to Check Docker Container RAM and CPU Usage

