In this tutorial, you will learn how to Monitor Disk Input/Output on Linux. In most cases whenever your Linux Server experience a performance slow down, the first thing you would want to check is the CPU or Memory usage using top, htop or any othet command. However all my seem well except the I/O Wait (wa, %iowait), a form of CPU idle time when nothing could be scheduled since the CPU has to wait on disk. In this tutorial, we are going to learn various tools that can be used to troubleshoot or monitor disk I/O activity on Linux.
Monitoring Disk Input/Output on Linux
iotop
Just like top, iotop command displays disk I/O usage by processes or threads on the system in real time. It also shows the disk bandwidth consumed by various processes or threads that are performing I/O.
The iotop command can be invoked by just typing iotop on the command line interface. By default, it shows all the processes and threads.
iotop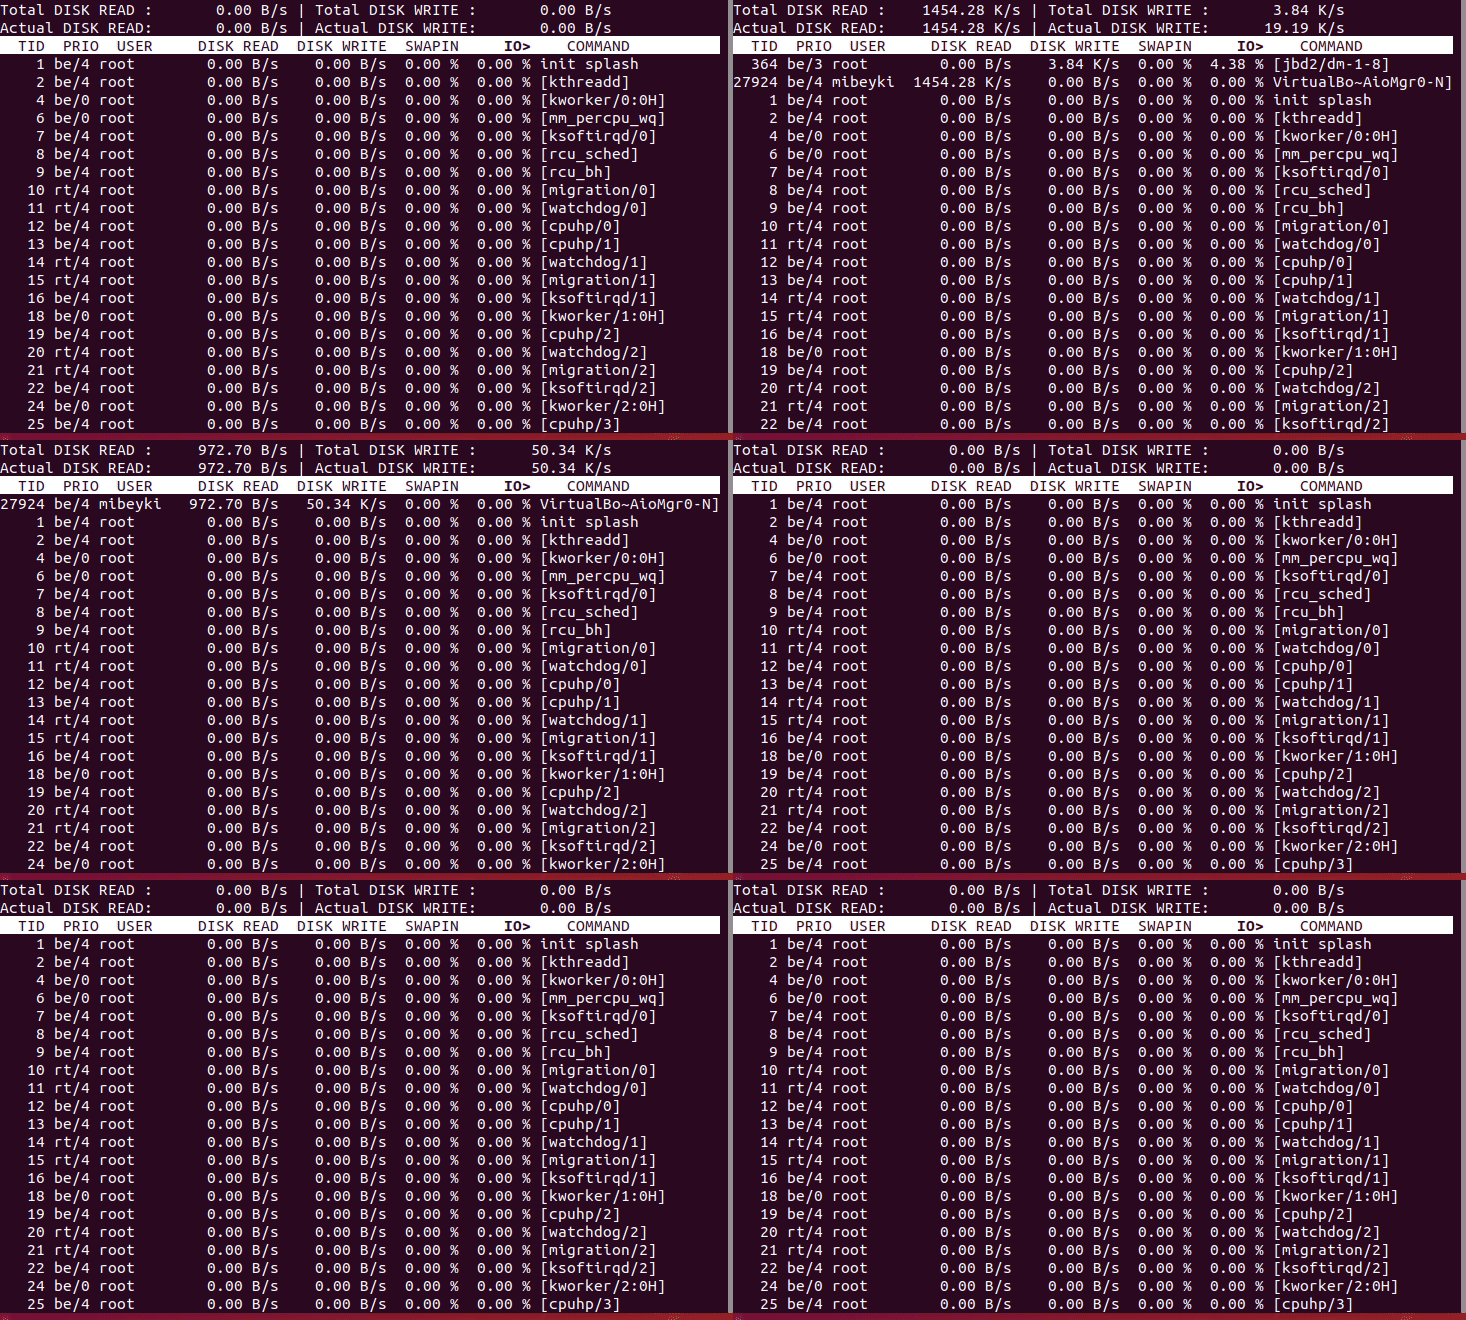
To display only processes that are actually doing the I/O pass the options -oP.
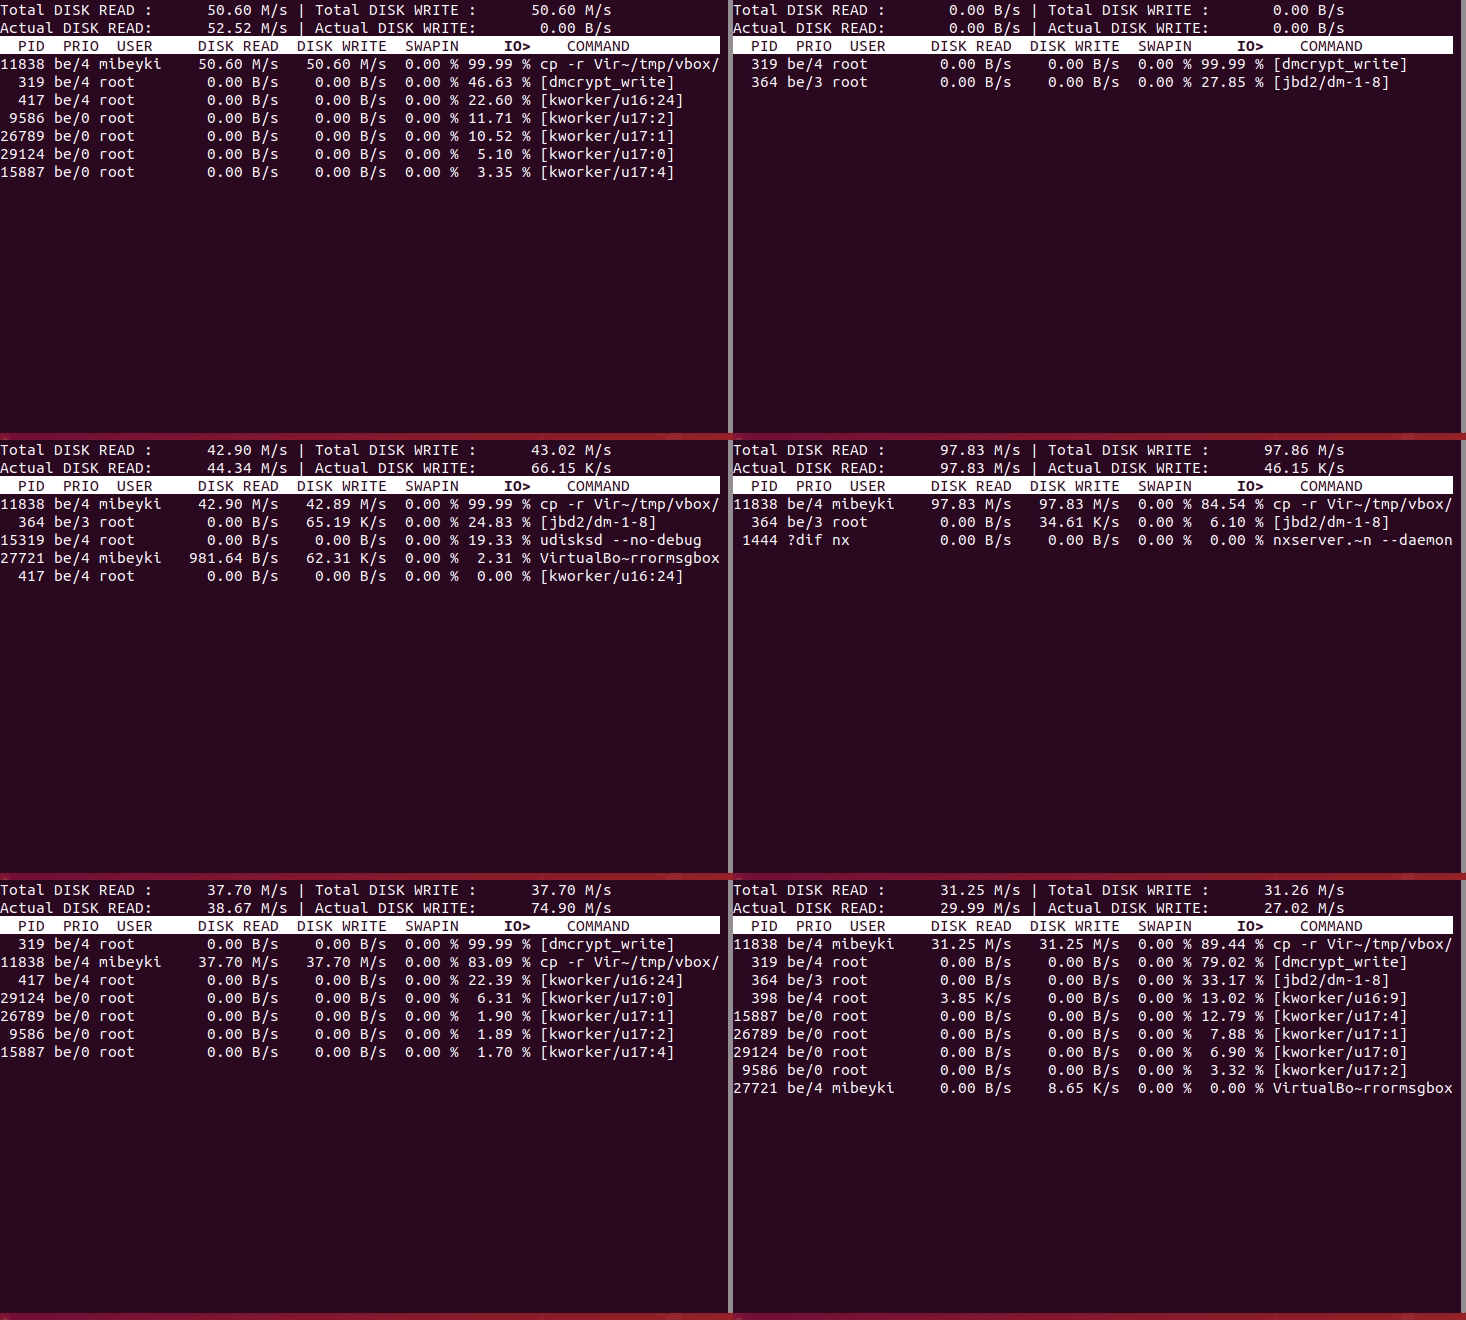
For more options that can be used with iotop command, see man iotop.
sar
The sar command can be used to report on I/O and transfer rate statistics. The command syntax is:
sar [option] [interval] [count]To display two I/O reports at an interval of 2 seconds, run the command as shown in below.
sar -b 1 2
Linux 4.15.0-36-generic (mibeyki.silensec.com) 	10/22/2018 	_x86_64_	(4 CPU)

08:24:32 PM       tps      rtps      wtps   bread/s   bwrtn/s
08:24:33 PM     81.00      3.00     78.00     24.00 157184.00
08:24:34 PM     84.00      4.00     80.00     32.00 154352.00
Average:        82.50      3.50     79.00     28.00 155768.00
The fields displayed are:
- tps – Total number of transfers per second that were issued to physical devices.
- rtps – Total number of read requests per second issued to physical devices.
- wtps – Total number of write requests per second issued to physical devices.
- bread/s – Total amount of data read from the devices in blocks per second.
- bwrtn/s – Total amount of data written to devices in blocks per second.
Note that each block of data has a size of 512 bytes.
iostat
The iostat command is used for monitoring system input/output device loading by observing the time the devices are active in relation to their average transfer rates. The iostat command generates reports that can be used to change system configuration to better balance the input/output load between physical disks.
The command syntax is;
iotop [option] [interval] [count]The iostat command generates two types of reports, the CPU utilization report and the device utilization report. To display two device utilization reports at an interval of one second in human readable format, run the command below. Option -y ensures that the first report which shows disk I/O statistics since boot (rarely useful) is discarded.
iostat -y -d -h 1 2
Linux 4.15.0-36-generic (kifarunix.example.com) 	10/22/2018 	_x86_64_	(4 CPU)

Device:            tps    kB_read/s    kB_wrtn/s    kB_read    kB_wrtn
loop0             0.00         0.00         0.00          0          0
sda             116.00     15104.00     51472.00      15104      51472
dm-0             75.00     15616.00     24576.00      15616      24576
dm-1             75.00     15616.00     24576.00      15616      24576
dm-2              0.00         0.00         0.00          0          0

Device:            tps    kB_read/s    kB_wrtn/s    kB_read    kB_wrtn
loop0             0.00         0.00         0.00          0          0
sda             186.00     43184.00     15616.00      43184      15616
dm-0            177.00     42928.00        16.00      42928         16
dm-1            177.00     42928.00        16.00      42928         16
dm-2              0.00         0.00         0.00          0          0
Check the man pages for a comprehensive description of iostat command usage.
ioping
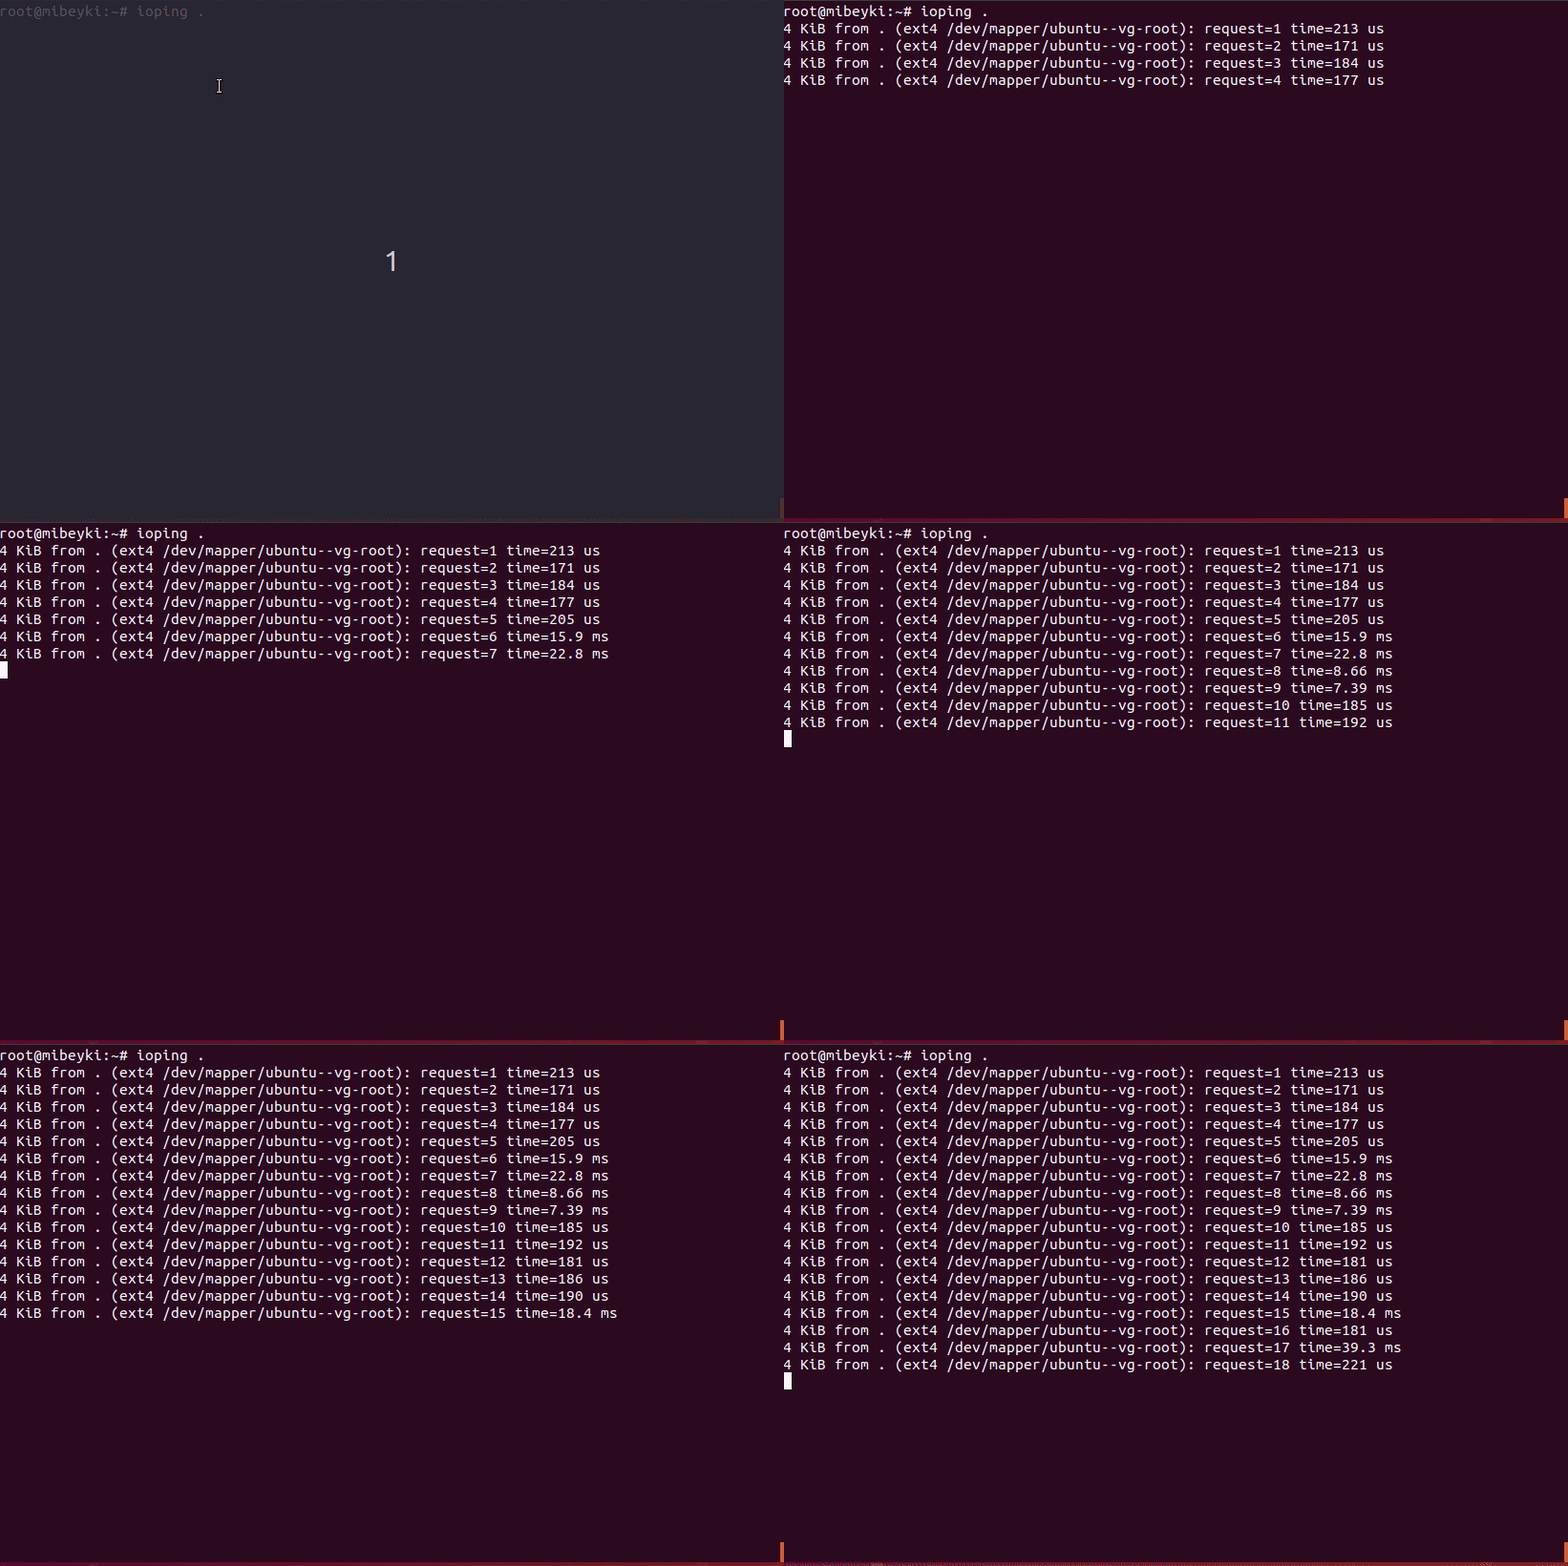
ioping tool is used to monitor I/O latency in real time. It shows disk latency in the same way as ping shows network latency. To show disk I/O latency at the current directory, run iotop command as shown below.
If the command is not installed, you can install it with your specific package manager. See the man pages for comprehensive list of options that can be used with ioping.
dstat
dstat is a versatile tool for generating system resource statistics. It is a replacement for vmstat, iostat and ifstat. It enables you to see the throughput for all the block devices that make up a single filesystem or storage system.
To check disk utilization in percentage as well as transactions per second statistics, run the command below.;
dstat -d --disk-tps --disk-util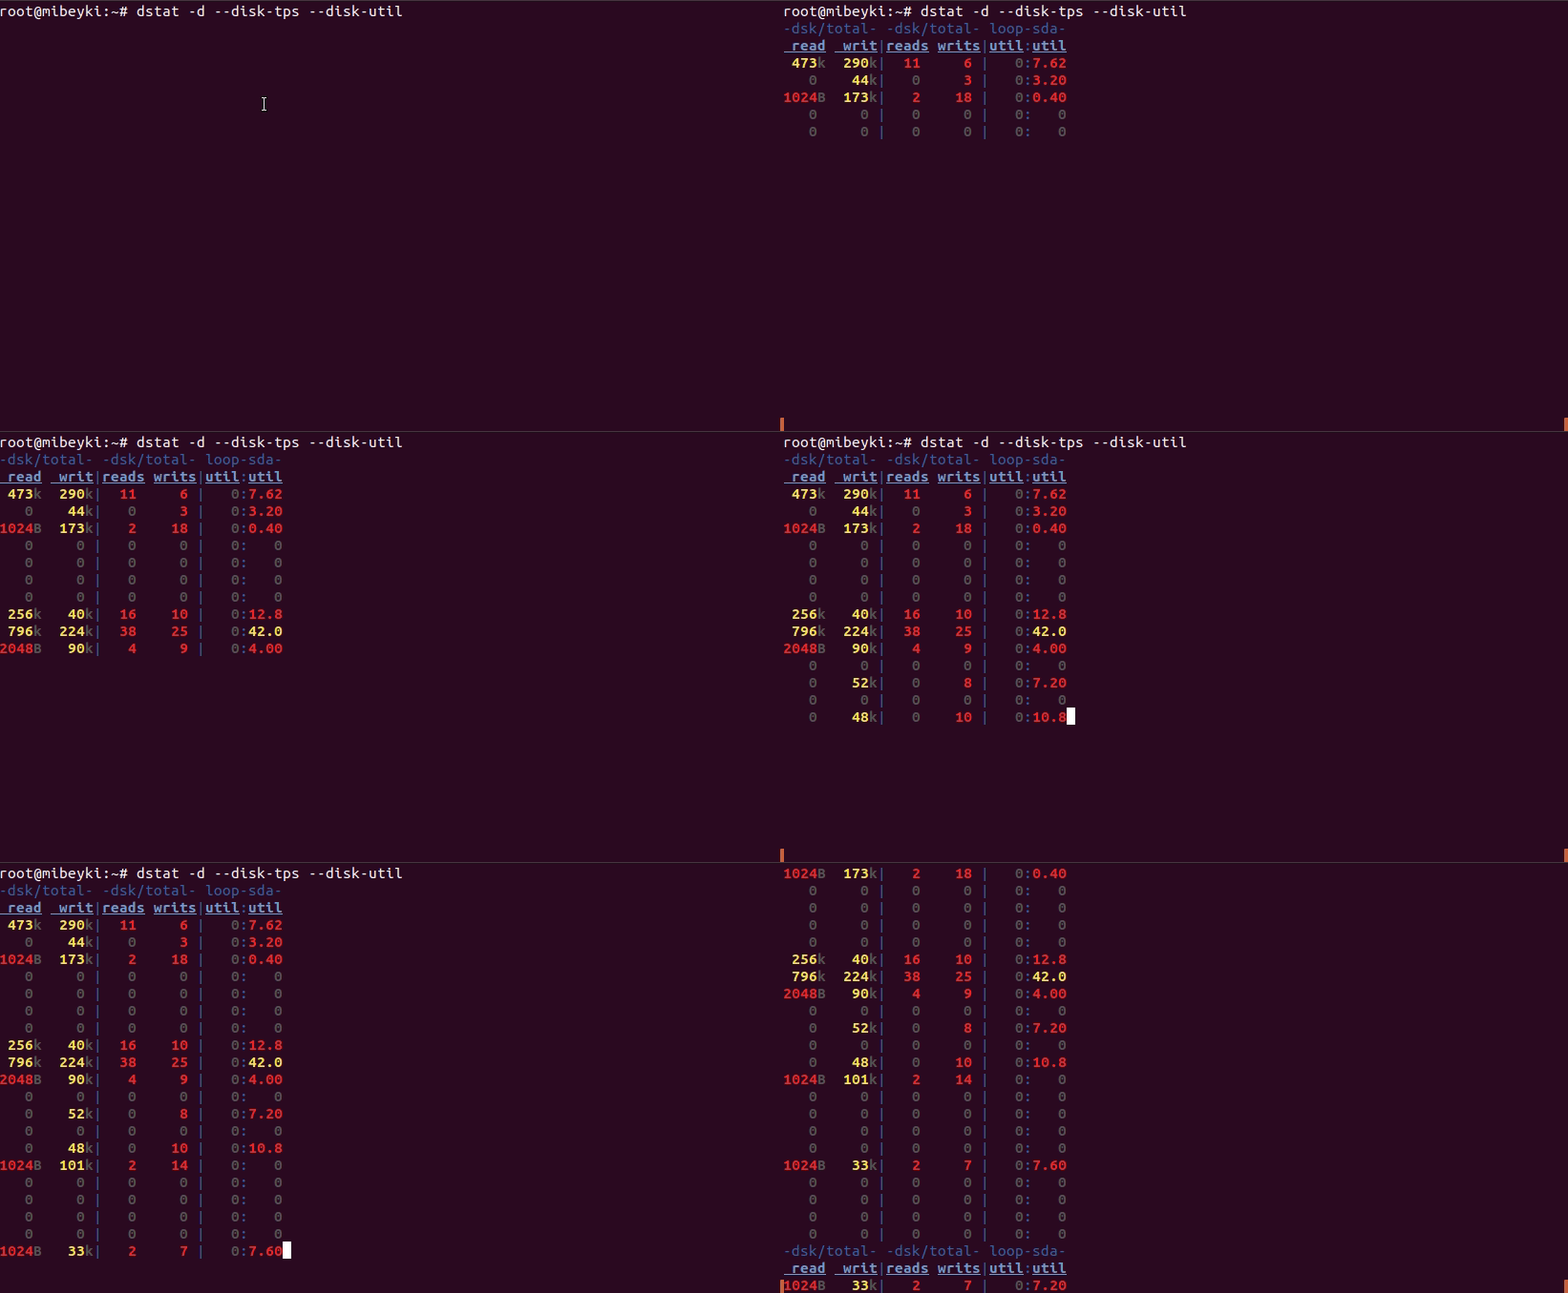
If the command is not already install, you can install it with your specific package manager. See the man pages for comprehensive list of options for dstat.
atop
The atop program is an interactive monitor to view the load on a Linux system. It shows the
occupation of the most critical hardware resources (from a performance point of view) on system level, i.e. cpu, memory, disk and network.
When atop is started, it checks whether the standard output channel is connected to a screen, or to a file/pipe. In the first case it produces screen control codes (via the ncurses library) and behaves interactively; in the second case it produces flat ASCII-output.
For the resource consumption on system level, atop uses colors to indicate that a critical occupation percentage has been (almost) reached. A critical occupation percentage means that is likely that this load causes a noticeable negative performance influence for applications using this resource.
In an interactive mode the output of atop can be controlled by pressing particular keys. However it is also possible to specify such key as flag on the command line. In the latter case atop will switch to the indicated mode on beforehand; this mode can be modified again
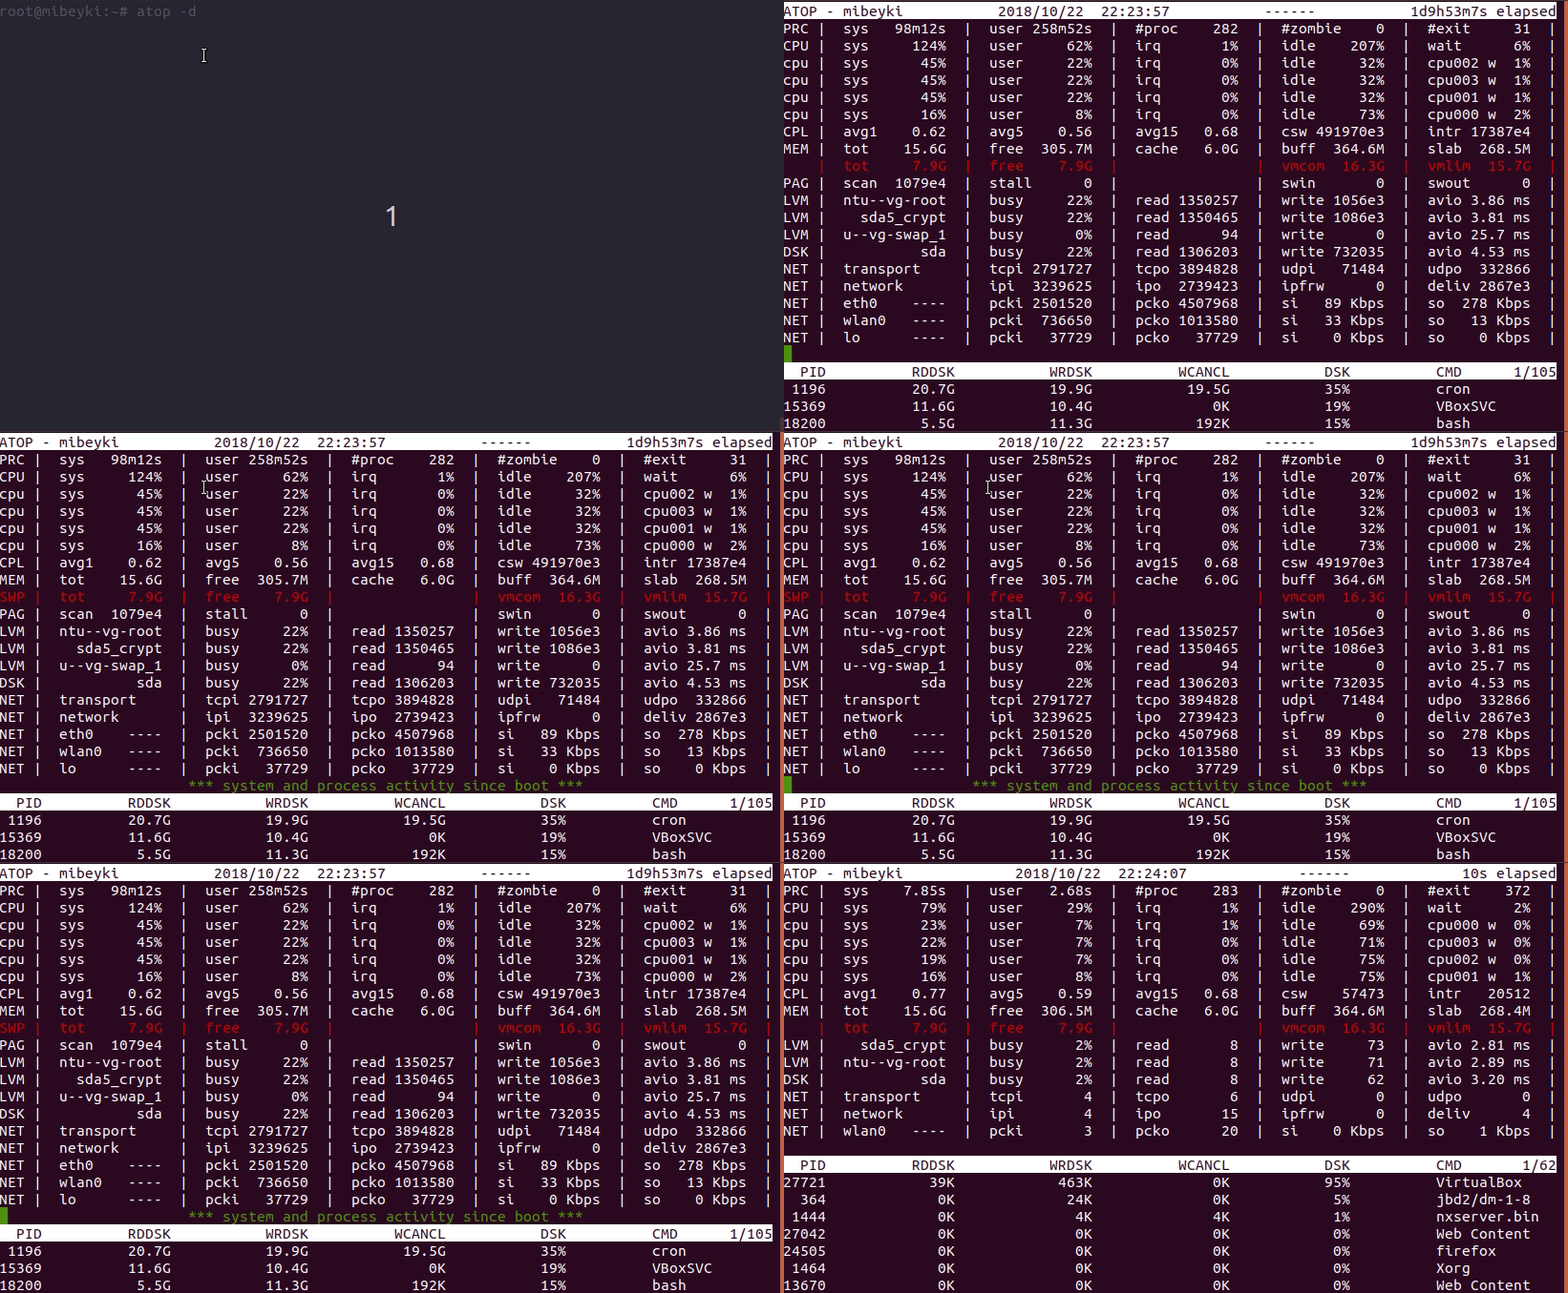
interactively. For example, to show show disk-related process-info run the atop command with option -d or run it without options and press letter d to toggle the view.
atop -dIf the command is not installed already, you can install it with your specific package manager. See the man pages for comprehensive description.
That is all on how to monitor Disk Input/Output on Linux.
You should now be able to determine I/O disk statistics. Be sure to check the man pages for all these commands.
Other Tutorials
How to Measure CPU Usage in Linux

