This tutorial will take you through how to ship system logs to ELK stack using Elastic Agents. You might be so used to using Elastic beats such as Filebeat, metricsbeat, Winlogbeat etc. to ship log from your end points to ELK for visualization. However, Elastic has announced the general availability Elastic Agents. Elastic Agent is a single, unified agent that you deploy to hosts or containers to collect data and send it to the Elastic Stack. Behind the scenes, Elastic Agent runs the Beats shippers or Elastic Endpoint required for your configuration.
Read more about the capabilities of both the Elastic Beats and Elastic Agents.
Shipping System Logs to ELK Stack with Elastic Agents
In order to collect and forward system logs to ELK stack using Elastic Agents, you need to deploy the Elastic agents.
There are multiple ways in which Elastic agents can be deployed;
- Install and manage Elastic Agent using Kibana Fleet UI: This method enables you install the agent on each monitored host and manage its lifecycle and policy/configuration central point in Kibana Fleet UI. This is, as of this writing, the recommended way to deploy Elastic Agents.
- Standalone mode: With this method, you install the agent on each monitored host and once installed, all configuration is applied to the Elastic Agent manually.
- Install Elastic Agent in a containerized environment
So, in this setup, we will deploy Elastic agents using the recommended method.
Install and manage Elastic Agents using Kibana Fleet UI
1. Install and Setup Elastic Stack
To begin with, you need to be having a running Elastic stack. You can follow the tutorials below to install Elastic stack;
Install ELK Stack on Debian 11
Install ELK Stack on Rocky Linux 8
Install ELK Stack on Ubuntu 20.04
In our setup, we are running ELK stack v 7.16.
2. Configure Basic Security for Elastic Stack
Next, you need to configure a secure and encrypted connections in Elastic stack.
- Stop Kibana and Elasticsearch
systemctl stop elasticsearch kibana- Enabling some of the Elasticsearch security features by running the command below. Run this command on each Elasticsearch node.
echo -e "xpack.security.enabled: true\nxpack.security.authc.api_key.enabled: true" >> /etc/elasticsearch/elasticsearch.ymlNext, start Elasticsearch;
systemctl start elasticsearch- Create passwords for Elastic stack built-in users
Use either command, /usr/share/elasticsearch/bin/elasticsearch-setup-passwords, to generate the password.
See how to use the command by passing -h option.
/usr/share/elasticsearch/bin/elasticsearch-setup-passwords -hTo Uses randomly generated passwords, run the command below;
echo "y" | /usr/share/elasticsearch/bin/elasticsearch-setup-passwords autoSample output;
Initiating the setup of passwords for reserved users elastic,apm_system,kibana,kibana_system,logstash_system,beats_system,remote_monitoring_user.
The passwords will be randomly generated and printed to the console.


Changed password for user apm_system
PASSWORD apm_system = 0ULOnDiadDDpLehYPDI3

Changed password for user kibana_system
PASSWORD kibana_system = 1LaDy3SBeDRKhvXpZG1A

Changed password for user kibana
PASSWORD kibana = 1LaDy3SBeDRKhvXpZG1A

Changed password for user logstash_system
PASSWORD logstash_system = YHvf3EtvaIrcX4xSrIoK

Changed password for user beats_system
PASSWORD beats_system = mw4LN3BurdA3qwrDMk4P

Changed password for user remote_monitoring_user
PASSWORD remote_monitoring_user = XpRuM8iFlXJWMj3HP97J

Changed password for user elastic
PASSWORD elastic = WSZdCjtgn9c8Pphd4St4
For now, we are only interested in passwords for the users: elastic and kibana_system.
Be sure to save all these passwords as they are needed to be used later.
- Enable Authenticated connection between Kibana and Elasticsearch
When Elastic security features are enabled, Kibana has to connect to Elasticsearch using valid credentials.
In this case, it uses the username kibana_system and its password from the command output above, 1LaDy3SBeDRKhvXpZG1A.
Add the username password to Kibana keystore instead of plain text in the configuration file;
/usr/share/kibana/bin/kibana-keystore create/usr/share/kibana/bin/kibana-keystore add elasticsearch.passwordWhen prompted, enter the password for kibana_system user.
Next, define the Kibana username by uncommenting the line, elasticsearch.username.
sed -i '/\.username/s/^#//' /etc/kibana/kibana.yml- Define Kibana saved objects encryption key value,
xpack.encryptedSavedObjects.encryptionKey: value. This is required by the Fleet to save API keys and encrypt them in Kibana.
/usr/share/kibana/bin/kibana-encryption-keys generate -qThis commands generates a number of encryption keys. We only need xpack.encryptedSavedObjects.encryptionKey
Add the line into kibana.yml config;
echo "xpack.encryptedSavedObjects.encryptionKey: f5021271183cff711f40f41686bb1a46" >> /etc/kibana/kibana.yml- Restart Kibana
systemctl start kibana- Log in to Kibana as the
elasticuser
Kibana now prompts to username/password to allow you login. Use the elastic user and its password generated above.
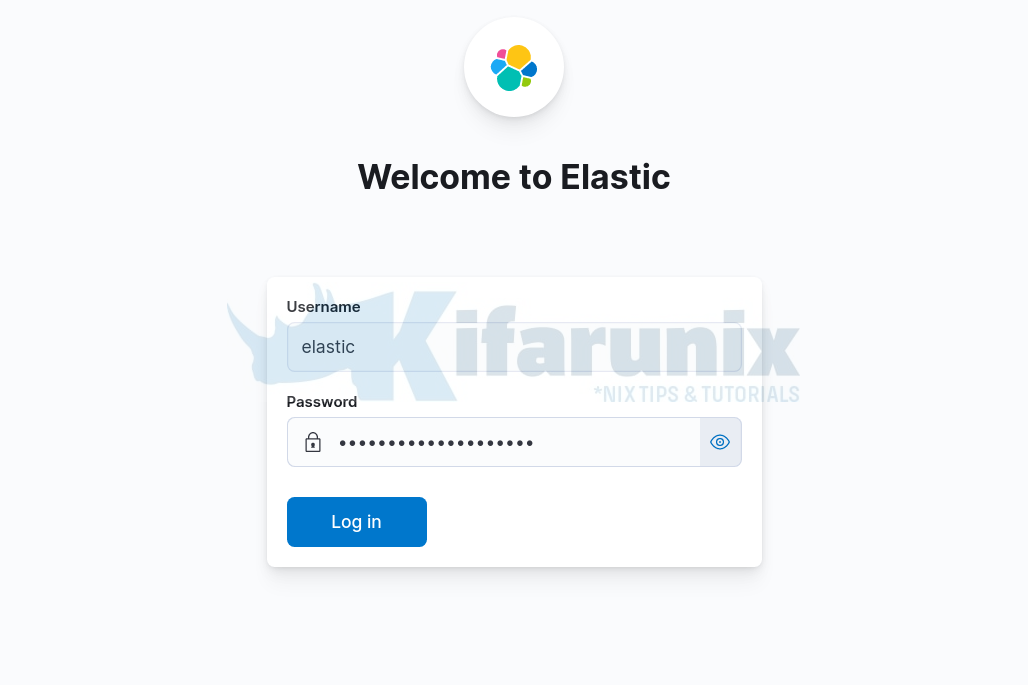
3. Setup Elastic Fleet
Once logged into Kibana, navigate to menu > Management > Fleet.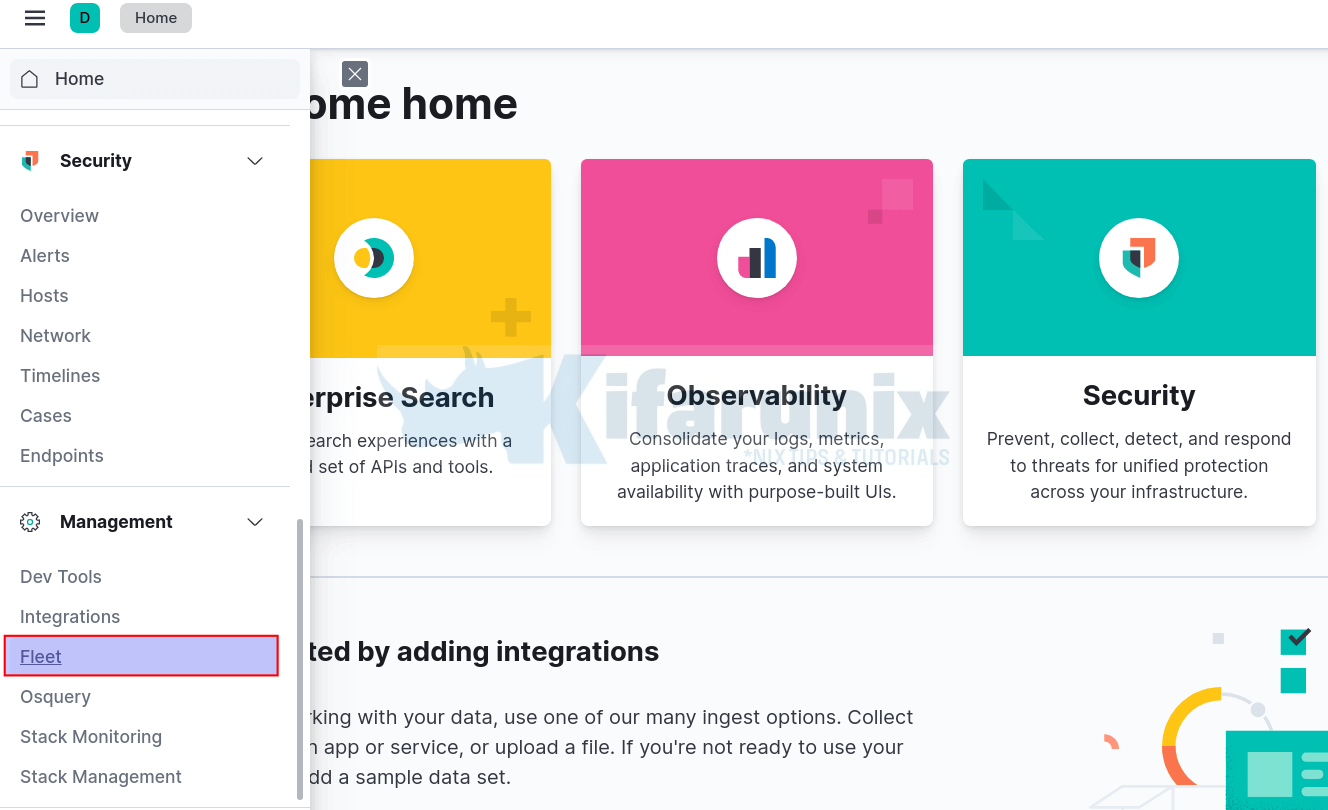
When you click on Fleet, the Fleet configuration interface opens up. It takes a while to load fully, for the first time.
Ensure that your Kibana server has internet connection as it requires to download and install integration packages from the Elastic Package Registry.
Once it loads, this is how it looks;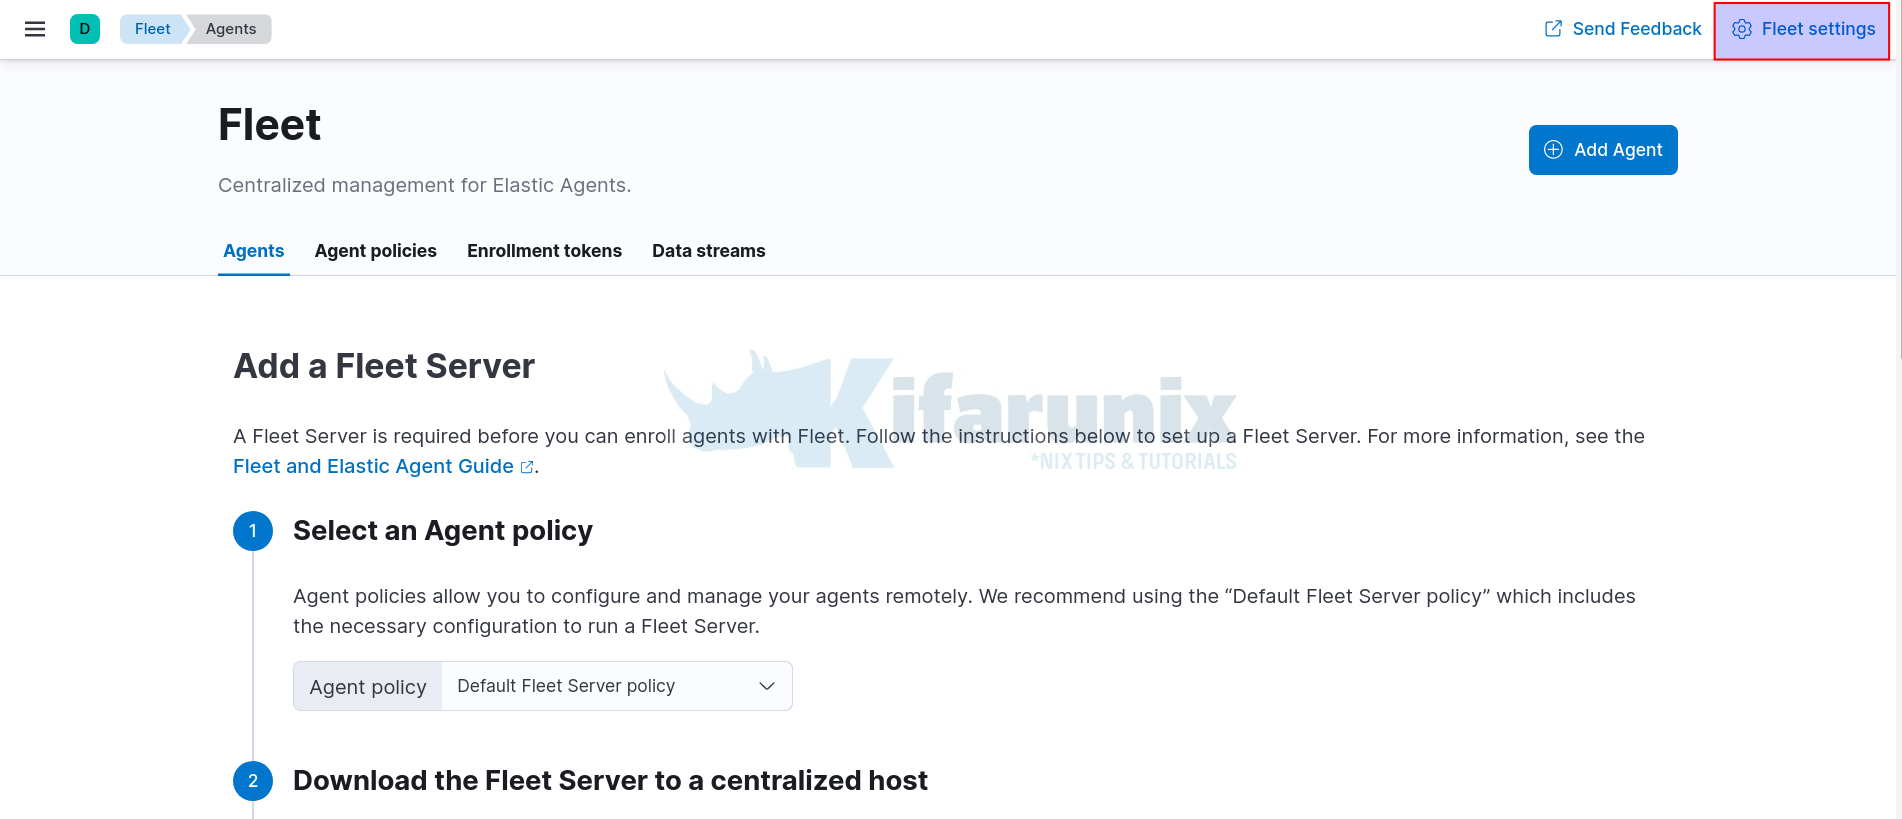
Click on Fleet Settings at the top right corner and;
- Define the Fleet Server URL. By default, Fleet server listens on port 8220/tcp. The agents will connect to the Fleet server using this URL.
- Define Elasticsearch output URL. The agents will ship logs to Elasticsearch via this URL.
- NOTE the use of HTTPS in the url. We will configure Fleet server in production mode and hence we will generate our own TLS certificates.
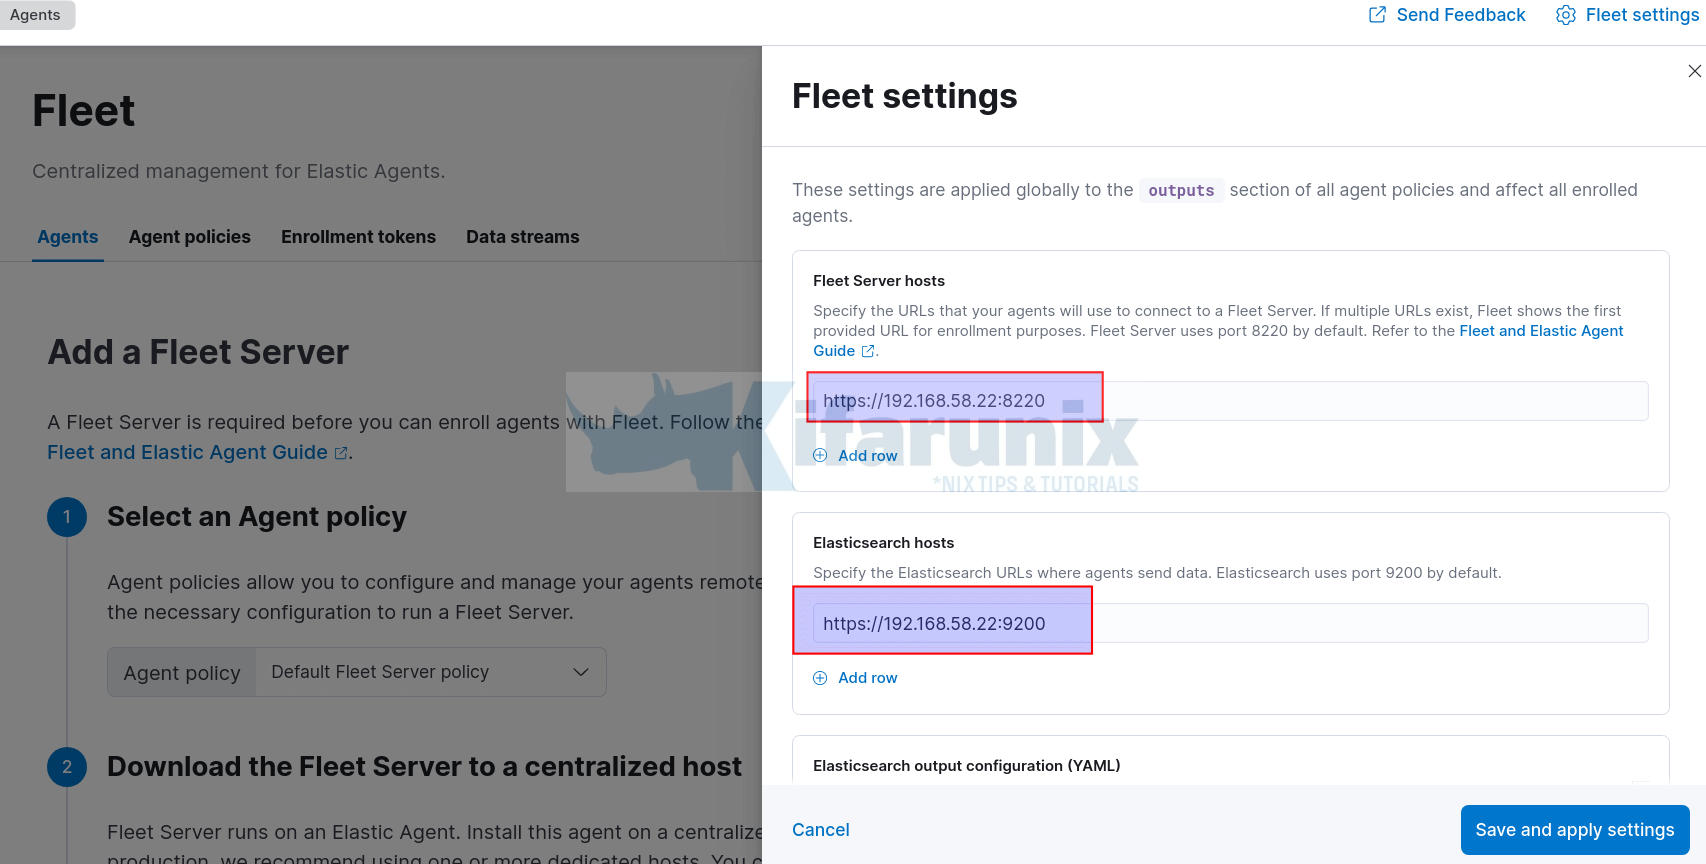
- Click Save and Apply the settings to save the changes.
- Ensure these ports are opened on the firewall to allow remote agents to connect.
Next, add a Fleet Server. Fleet server is required before you can enroll agents with Fleet.
To add a Fleet server;
- Navigate to Agents tab on Fleet interface
- Choose an Agent policy. We will go with the default Policy.
- Download and install Fleet server Elastic agent.
By Clicking on the download link provided, you are taken to a web page where you can download the Fleet server Elastic agent installer.
In my current setup, ELK stack is running on Debian 11. Hence, we use the DEB binary installer;
wget https://artifacts.elastic.co/downloads/beats/elastic-agent/elastic-agent-7.16.0-amd64.deb
apt install ./elastic-agent-7.16.0-amd64.deb
If you have Elastic repos in place, you should be able to install straight from those repos;
apt install elastic-agent -yThe method of installation will determine how you start the fleet server. If you used the TAR file, you can start the Fleet server from the archive with the command ./elastic-agent install... If you used DEB or RPM binary or installed from repos, then start fleet server using elastic-agent enroll... command.
- Choose a deployment mode for security.
In this setup, we will use production setup. Hence, we need to generate the TLS certs.
Generate a CA.
/usr/share/elasticsearch/bin/elasticsearch-certutil ca --pem --out /etc/elasticsearch/elastic-stack-ca.zip --days 3650A zip file with CA is placed under /etc/elasticsearch/elastic-stack-ca.zip.
Navigate to this directory and extract the CA;
/etc/elasticsearch/unzip elastic-stack-ca.zipYou now have a directory called ca, with your CA cert and key;
ls -1 $PWD/ca/*/etc/elasticsearch/ca/ca.crt
/etc/elasticsearch/ca/ca.keyNext, generate certificates using the CA above. The command prompts to enter the name of the zip file to stop certs. Press enter to go with default.
/usr/share/elasticsearch/bin/elasticsearch-certutil cert \
--name kifarunix-demo-fleet-server \
--ca-cert /etc/elasticsearch/ca/ca.crt \
--ca-key /etc/elasticsearch/ca/ca.key \
--dns elk.kifarunix-demo.com \
--ip 192.168.58.22 \
--days 3650 \
--out /etc/elasticsearch/certificate-bundle.zip \
--pem
Extract the certs;
unzip certificate-bundle.zipls -1 $PWD/kifarunix-demo-fleet-server/*/etc/elasticsearch/kifarunix-demo-fleet-server/kifarunix-demo-fleet-server.crt
/etc/elasticsearch/kifarunix-demo-fleet-server/kifarunix-demo-fleet-server.keyNext, enable Elasticsearch HTTPS connection;
cat >> /etc/elasticsearch/elasticsearch.yml << 'EOL'
xpack.security.http.ssl.verification_mode: certificate
xpack.security.http.ssl.key: kifarunix-demo-fleet-server/kifarunix-demo-fleet-server.key
xpack.security.http.ssl.certificate: kifarunix-demo-fleet-server/kifarunix-demo-fleet-server.crt
xpack.security.http.ssl.certificate_authorities: ca/ca.crt
EOL
Restart Elasticsearch;
systemctl stop elasticsearchsystemctl start elasticsearchEnable Kibana Elasticsearch HTTPS connection as well;
cp /etc/elasticsearch/ca/ca.crt /etc/kibana/Update the path to the CA cert.
sed -i '/elasticsearch.ssl.certificateAuthorities:/s/^#//;/elasticsearch.ssl.certificateAuthorities:/s/".*."/\/etc\/kibana\/ca.crt/' /etc/kibana/kibana.ymlSet the Elasticsearch URL to https;
sed -i '/:9200/s/http/https/' /etc/kibana/kibana.ymlStart and Stop Kibana;
systemctl stop kibanasystemctl start kibana- Add the Fleet Server host and set the Elasticsearch TLS certificates
Once Elasticsearch and Kibana are up, login back to Kibana and define the IP address of the Fleet server host. NOTE if you already added the Fleet server above, skip this step.
Next, click Fleet Settings and add the TLS certificates generated above under Elasticsearch output configuration (YAML). See screenshot below;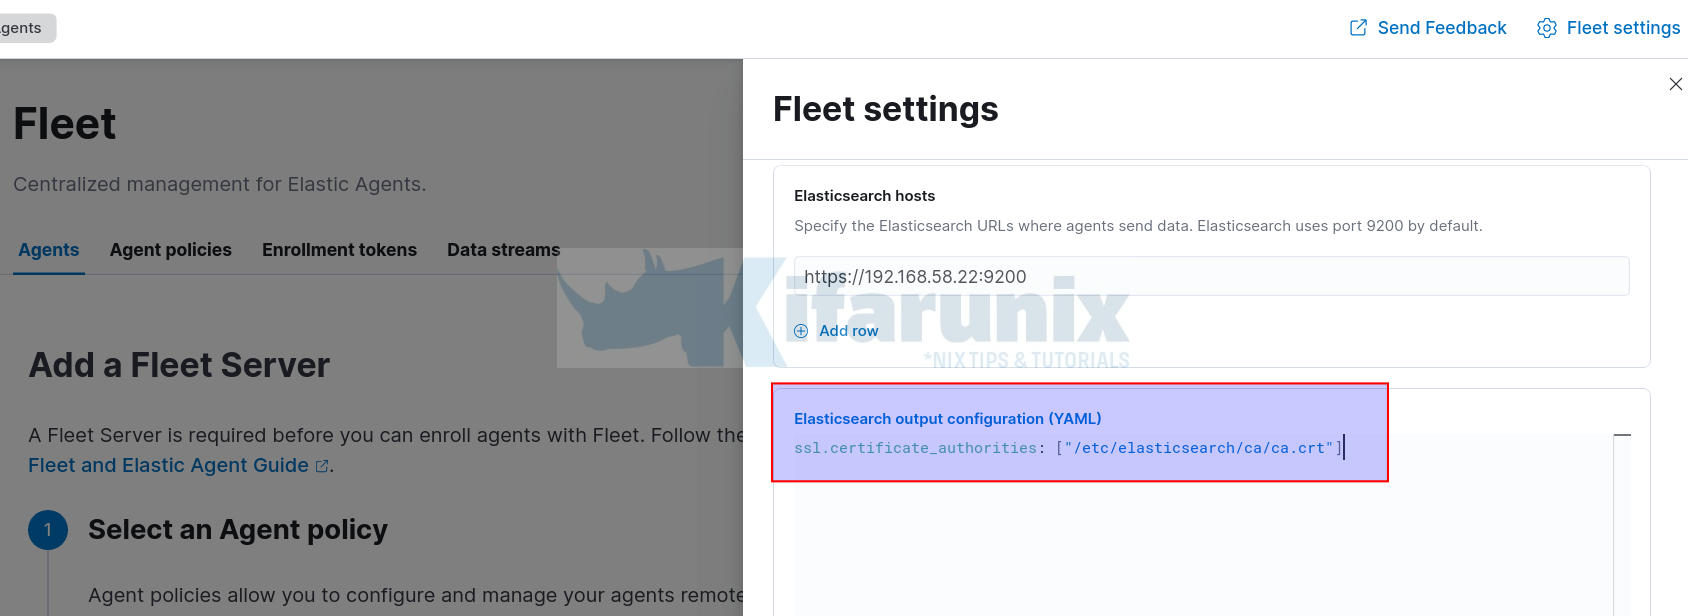
- Generate a service token which allows Fleet Server to write to Elasticsearch;
Sample key;
AAEAAWVsYXN0aWMvZmxlZXQtc2VydmVyL3Rva2VuLTE2MzkyNTMzMjE4ODY6dVloNERYWlVUQVctbHR5VDlNSmNlQQ- Start Fleet Server
If you downloaded the TAR of the Elastic Agent, extract and run the command below from within the Elastic agent archive folder;
cd elastic-agent-7.16.0-linux-x86_64/
sudo ./elastic-agent install -f --url=https://192.168.58.22:8220 \
  --fleet-server-es=https://192.168.58.22:9200 \
  --fleet-server-service-token=AAEAAWVsYXN0aWMvZmxlZXQtc2VydmVyL3Rva2VuLTE2MzkyNTY0MTk5NDg6NjJOR1hua0xRcXFpb2J0VmlHWmRGZw \
  --fleet-server-policy=7ffb6ea0-5a5f-11ec-a136-bbf180de0c1d \
  --certificate-authorities=/etc/elasticsearch/ca/ca.crt \
  --fleet-server-es-ca=/etc/elasticsearch/ca/ca.crt \
  --fleet-server-cert=/etc/elasticsearch/kifarunix-demo-fleet-server/kifarunix-demo-fleet-server.crt \
  --fleet-server-cert-key=/etc/elasticsearch/kifarunix-demo-fleet-server/kifarunix-demo-fleet-server.key
If you installed the Elastic agent already using the DEB/RPM or from the Elastic repo using the package manager, start the Fleet server using the command;
sudo elastic-agent enroll -f --url=https://192.168.58.22:8220 \
  --fleet-server-es=https://192.168.58.22:9200 \
  --fleet-server-service-token=AAEAAWVsYXN0aWMvZmxlZXQtc2VydmVyL3Rva2VuLTE2MzkyNTY0MTk5NDg6NjJOR1hua0xRcXFpb2J0VmlHWmRGZw \
  --fleet-server-policy=7ffb6ea0-5a5f-11ec-a136-bbf180de0c1d \
  --certificate-authorities=/etc/elasticsearch/ca/ca.crt \
  --fleet-server-es-ca=/etc/elasticsearch/ca/ca.crt \
  --fleet-server-cert=/etc/elasticsearch/kifarunix-demo-fleet-server/kifarunix-demo-fleet-server.crt \
  --fleet-server-cert-key=/etc/elasticsearch/kifarunix-demo-fleet-server/kifarunix-demo-fleet-server.key
Sample Agent enrollment output;
2021-12-12T00:00:49.379+0300	INFO	cmd/enroll_cmd.go:555	Spawning Elastic Agent daemon as a subprocess to complete bootstrap process.
2021-12-12T00:00:49.561+0300	INFO	application/application.go:67	Detecting execution mode
2021-12-12T00:00:49.564+0300	INFO	application/application.go:88	Agent is in Fleet Server bootstrap mode
2021-12-12T00:00:49.799+0300	INFO	[api]	api/server.go:62	Starting stats endpoint
2021-12-12T00:00:49.799+0300	INFO	application/fleet_server_bootstrap.go:130	Agent is starting
2021-12-12T00:00:49.800+0300	INFO	[api]	api/server.go:64	Metrics endpoint listening on: /var/lib/elastic-agent/data/tmp/elastic-agent.sock (configured: unix:///var/lib/elastic-agent/data/tmp/elastic-agent.sock)
2021-12-12T00:00:49.800+0300	INFO	application/fleet_server_bootstrap.go:140	Agent is stopped
2021-12-12T00:00:49.802+0300	INFO	stateresolver/stateresolver.go:48	New State ID is zS4iwuzb
2021-12-12T00:00:49.802+0300	INFO	stateresolver/stateresolver.go:49	Converging state requires execution of 1 step(s)
2021-12-12T00:00:49.857+0300	INFO	operation/operator.go:284	operation 'operation-install' skipped for fleet-server.7.16.0
2021-12-12T00:00:50.028+0300	INFO	stateresolver/stateresolver.go:66	Updating internal state
2021-12-12T00:00:50.028+0300	INFO	log/reporter.go:40	2021-12-12T00:00:50+03:00 - message: Application: fleet-server--7.16.0[]: State changed to STARTING: Starting - type: 'STATE' - sub_type: 'STARTING'
2021-12-12T00:00:50.384+0300	INFO	cmd/enroll_cmd.go:760	Fleet Server - Starting
2021-12-12T00:00:51.575+0300	WARN	status/reporter.go:236	Elastic Agent status changed to: 'degraded'
2021-12-12T00:00:51.576+0300	INFO	log/reporter.go:40	2021-12-12T00:00:51+03:00 - message: Application: fleet-server--7.16.0[]: State changed to DEGRADED: Running on policy with Fleet Server integration: 7ffb6ea0-5a5f-11ec-a136-bbf180de0c1d; missing config fleet.agent.id (expected during bootstrap process) - type: 'STATE' - sub_type: 'RUNNING'
2021-12-12T00:00:52.386+0300	INFO	cmd/enroll_cmd.go:741	Fleet Server - Running on policy with Fleet Server integration: 7ffb6ea0-5a5f-11ec-a136-bbf180de0c1d; missing config fleet.agent.id (expected during bootstrap process)
2021-12-12T00:00:53.096+0300	INFO	cmd/enroll_cmd.go:442	Starting enrollment to URL: https://192.168.58.22:8220/
2021-12-12T00:01:02.899+0300	INFO	cmd/enroll_cmd.go:254	Elastic Agent has been enrolled; start Elastic Agent
Successfully enrolled the Elastic Agent.
2021-12-12T00:01:02.900+0300	INFO	cmd/run.go:184	Shutting down Elastic Agent and sending last events...
2021-12-12T00:01:02.900+0300	INFO	operation/operator.go:216	waiting for installer of pipeline 'default' to finish
2021-12-12T00:01:02.900+0300	INFO	process/app.go:176	Signaling application to stop because of shutdown: fleet-server--7.16.0
2021-12-12T00:01:04.431+0300	INFO	status/reporter.go:236	Elastic Agent status changed to: 'online'
2021-12-12T00:01:04.431+0300	INFO	log/reporter.go:40	2021-12-12T00:01:04+03:00 - message: Application: fleet-server--7.16.0[]: State changed to STOPPED: Stopped - type: 'STATE' - sub_type: 'STOPPED'
2021-12-12T00:01:04.431+0300	INFO	cmd/run.go:192	Shutting down completed.
2021-12-12T00:01:04.432+0300	INFO	[api]	api/server.go:66	Stats endpoint (/var/lib/elastic-agent/data/tmp/elastic-agent.sock) finished: accept unix /var/lib/elastic-agent/data/tmp/elastic-agent.sock: use of closed network connection
- Next start and enable Elastic Agent to run on system boot;
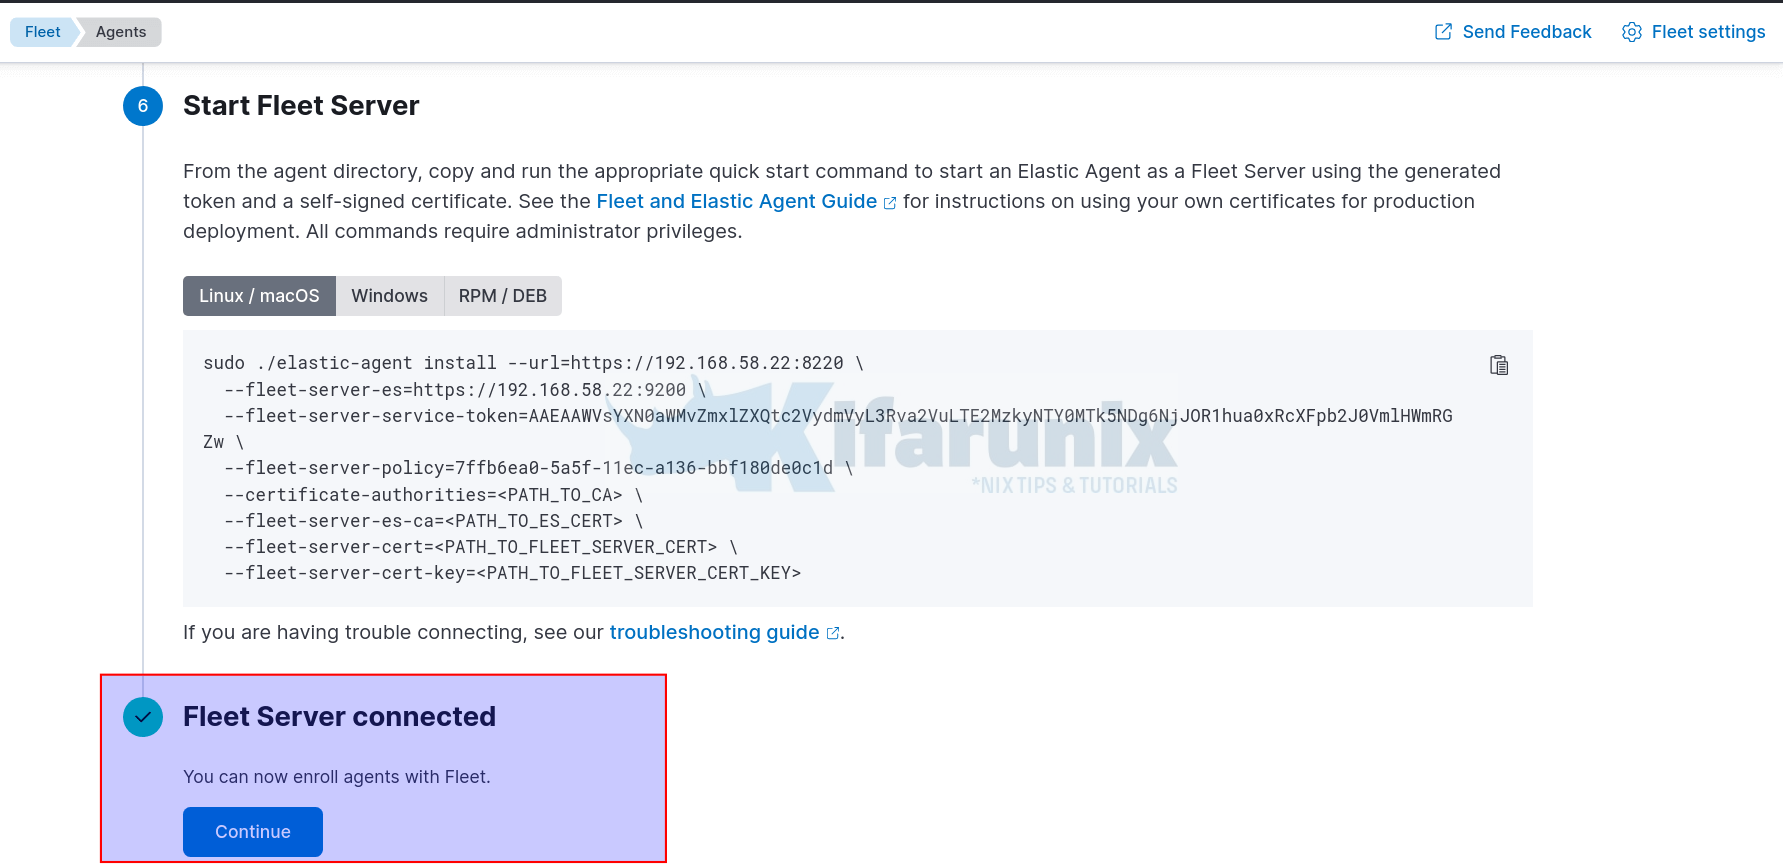
systemctl enable --now elastic-agent- Navigate back to Kibana Fleet interface and you should that the Fleet server is now connected.
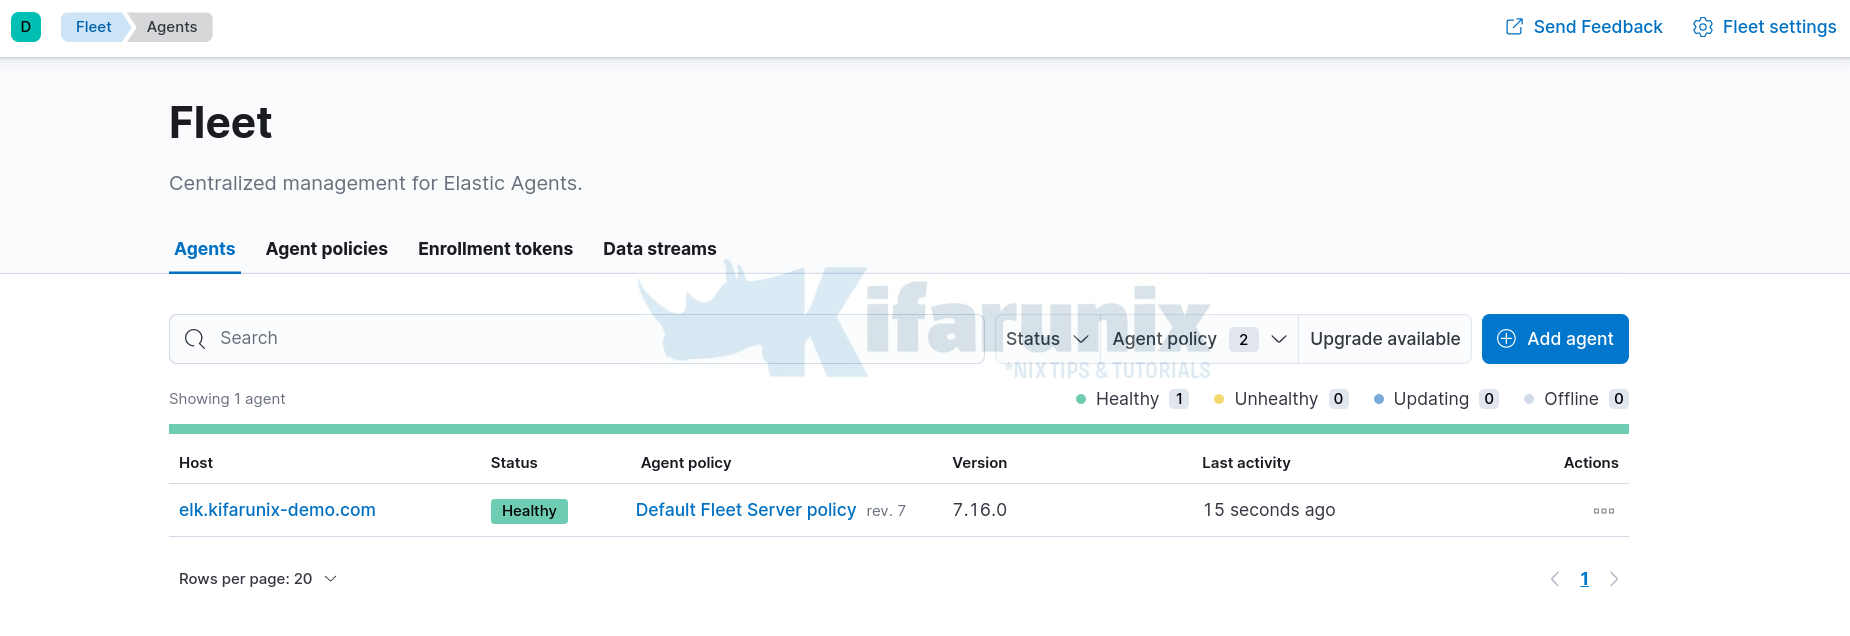
- Click Continue to go back to Agents tab. You should see that the Fleet host server Elastic agent is connected and status healthy.
Viewing Logs Collected by Elastic Agent on Fleet Manager
Click on Data streams to view data collected.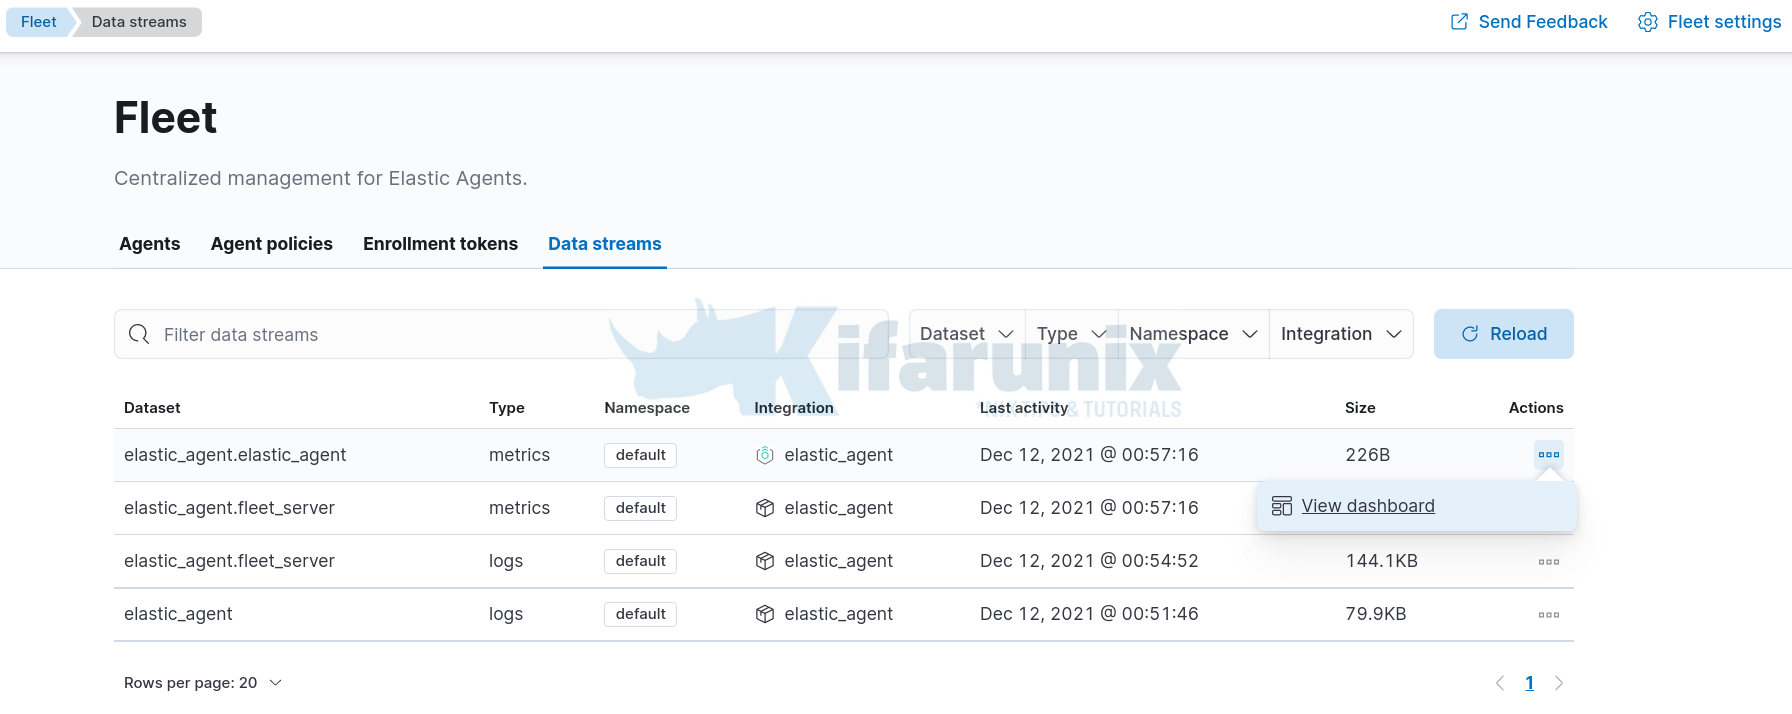
You can view dashboards associated with each data set by clicking actions > view dashboards.
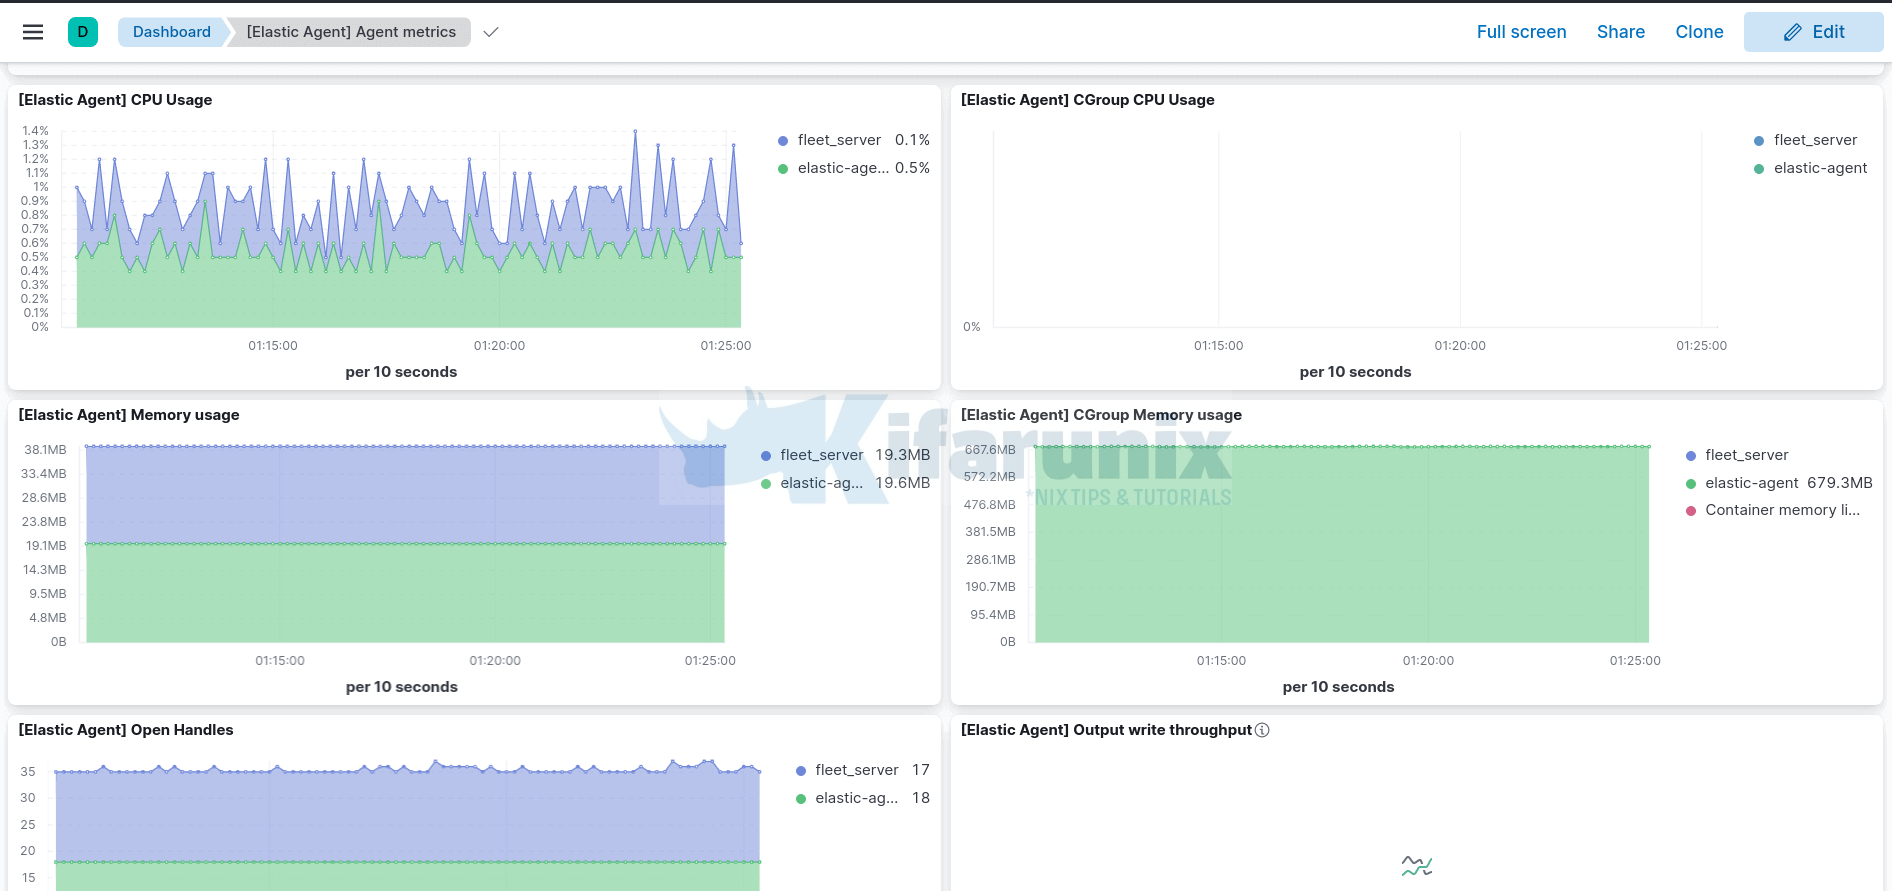
In our next tutorial, we will learn how to install and enroll remote Elastic agents on Fleet manager.
Install and Enroll Elastic Agents to Fleet Manager in Linux
Reference
Other Tutorials
Detect Changes to Critical Files in Linux using Auditbeat and ELK


This is a really Good one, but i need some clarification from your side regarding this option “–fleet-server-es-ca”
With install you used
–fleet-server-es-ca=/etc/elasticsearch/ca/ca.crt
and with enroll
–fleet-server-es-ca=/etc/elasticsearch/kifarunix-demo-fleet-server/kifarunix-demo-fleet-server.crt
could you explain since this point confuses me !!
thanks for spotting that, -:). It should be the same as for install. Corrected
Looks like something may have changed because with ELK 7.16.3 I get to the point of logging into Kibana for the first time after enabled the security and it doesn’t work any more. It was fine when enabling the elastic password but this point
sed -i ‘/elasticsearch.ssl.certificateAuthorities:/s/^#//;/elasticsearch.ssl.certificateAuthorities:/s/”.*.”/\/etc\/kibana\/ca.crt/’ /etc/kibana/kibana.yml
It fails and the kibana logs have this
{“type”:”log”,”@timestamp”:”2022-01-28T13:32:24+00:00″,”tags”:[“error”,”elasticsearch-service”],”pid”:203102,”message”:”Unable to retrieve version information from Elasticsearch nodes. write EPROTO 139960378783680:error:1408F10B:SSL rou
tines:ssl3_get_record:wrong version number:../deps/openssl/openssl/ssl/record/ssl3_record.c:332:\n”}
With all of these settings, I can only log into kibana with Elastic set to http and not https.