In this tutorial, you will learn how to use htop command in Linux. An interactive process viewer (htop) is a free GNU GPL process viewer for Linux which have a slight difference with the top command, htop command;
- allows you to scroll vertically and horizontally so that you can see all processes running in the system along with their full command lines.
- Tasks like
killingandrenicingthe processes can be done withhtopcommand without entering their PIDs. - Also
htopcommand allows you to view processes as process tree hence selecting multiple processes and acting on them all at once.
Using htop Command in Linux
Install htop Command in Linux
Note that htop command may not be installed by default in most of the Linux distos. Launch the terminal and execute the following commands to check if the htop command is installed.
On Ubuntu/Debian Linux
if it’s installed you will obtain the following output:
dpkg -s htop
Package: htop
Status: install ok installed
Priority: optional
Section: utils
Installed-Size: 220
Maintainer: Ubuntu Developers <[email protected]>
Architecture: amd64
Version: 2.2.0-2build1
Depends: libc6 (>= 2.15), libncursesw6 (>= 6), libtinfo6 (>= 6)
And if not installed you will obtain the following output:
dpkg-query: package 'htop' is not installed and no information is available
Use dpkg --info (= dpkg-deb --info) to examine archive files.
On RHEL/CentOS 6.x Linux and above
If it’s installed you will obtain the following output:
yum list installed {PACKAGE_NAME}
yum list installed htop
Installed Packages
htop.x86_64
And if not installed you will obtain the following output:
Error: No matching Packages to listOn Fedora Linux 22 and above
If it’s installed you will obtain the following output:
dnf list installed {PACKAGE_NAME}
dnf list installed htop
Installed Packages
htop.x86_64
And if not installed you will obtain the following output:
Error: No matching Packages to listTo install htop execute the following commands:
On Ubuntu/Debian Linux
apt install htopOn RHEL/CentOS 6.x Linux and above
yum install htopOn Fedora Linux 22 and above
dnf install htopUsing htop Command
Command line syntax;
htop [-dChustv]
When htop is successfully installed in your system, launch your terminal and execute htop command.
htop
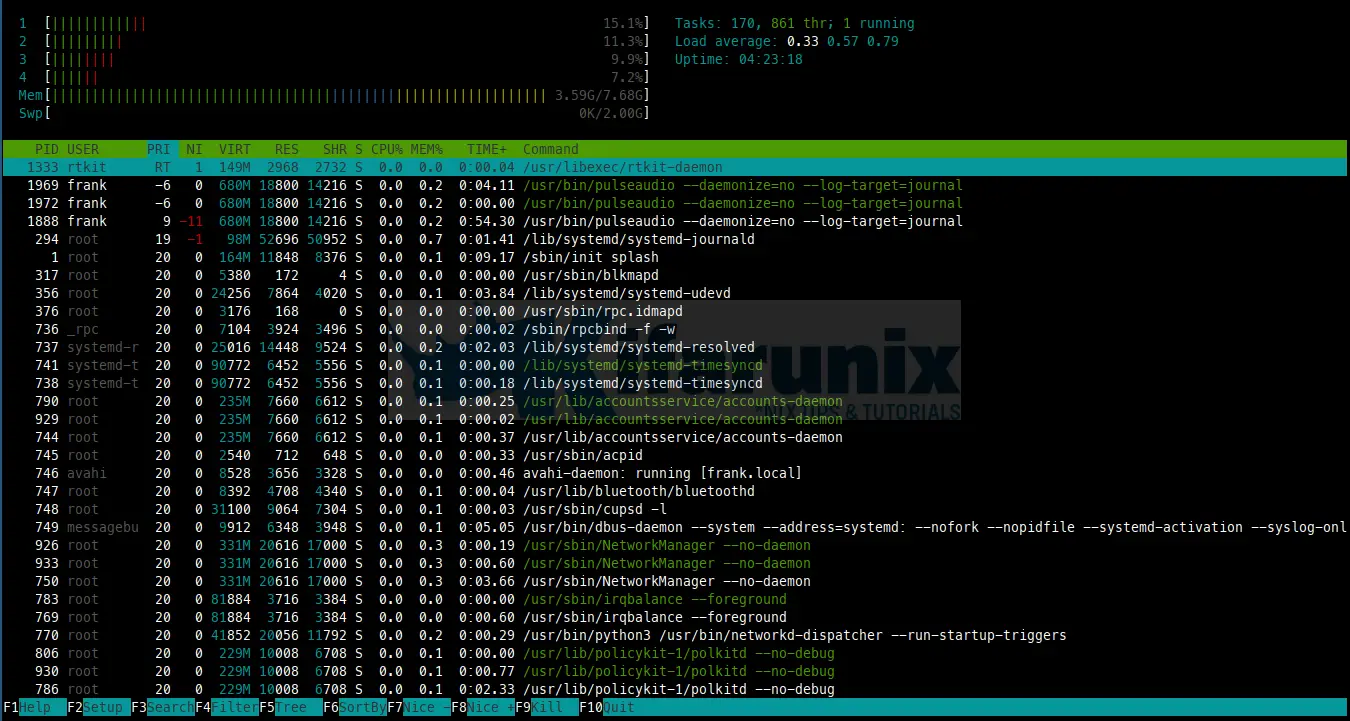
By default htop window has 3 sections:
Section 1: TOP

In this section we get information like CPU, Memory, Tasks, Load average and Uptime.
Section 2: CENTER

In this section we get the list of all running processes in the system. It has the following columns:
- PID The process ID.
- USER The username of the process.
- PRI The kernel’s internal priority for the process.
- NI The nice value of a process, from 19 (low priority) to -20 (high priority).
- VIRT The size of the virtual memory of the process.
- RES The resident set size (text + data + stack) of the process.
- SHR The size of the process’s shared pages.
- S (STATE)
- S for sleeping (idle)
- R for running
- D for disk sleep (uninterruptible)
- Z for zombie (waiting for parent to read its exit status)
- T for traced or suspended (e.g by SIGTSTP)
- W for paging
- CPU% The percentage of the CPU time that the process is currently using.
- MEM% The percentage of memory the process is currently using.
- TIME+ The time, measured in clock ticks that the process has spent in user and system time.
- Command The full command line of the process (i.e. program name and arguments).
Section 3: BOTTOM
This section displays different htop options.
Usage of Htop Command in Linux
Let’s now see various uses of htop command in Linux to view processes. Htop has two main types of uses:
- COMMAND-LINE OPTIONS This is where we can interact with
htopcommand in CLI. - INTERACTIVE COMMANDS This is where we can use various options in
htoputility tool.
COMMAND-LINE OPTIONS
Start htop in monochrome mode
-C --no-color --no-colourDelay between updates, in tenths of seconds
-d --delay=DELAYShow only the given PIDs
-p --pid=PID,PID...Sort by the column
-s --sort-key COLUMNShow processes in tree view
-t --treeShow only the processes of a given user
-u --user=USERNAMEOutput version information and exit
-v --versionDisplay a help message and exit
-h --helpINTERACTIVE COMMANDS
While in htop utility tool, the following commands are used to interact with processes.
Filtering Processes
Through F4 Filter option, processes are filtered and only processes whose names match will be shown. To cancel filtering, enter
the F4 Filter option again and press Esc.
Sorting Processes
Sorting of processes can be done through F6 SortBy option. On sorted view, select a field for sorting, also accessible through Up and Down arrow keys. The current sort field is indicated by a highlight in the header.
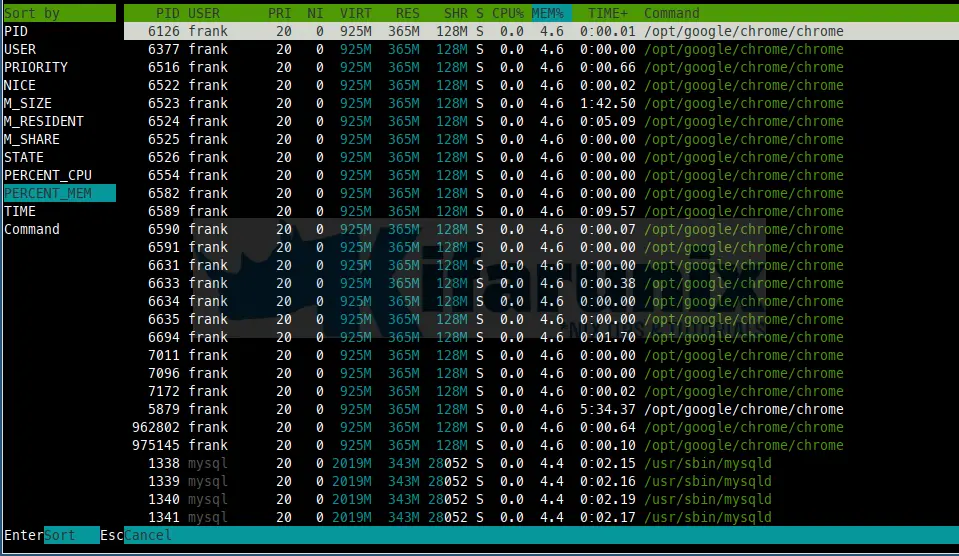
In the above display, it has been sorted by the percentage of memory the process is currently using.
Display Processes in Tree like Format
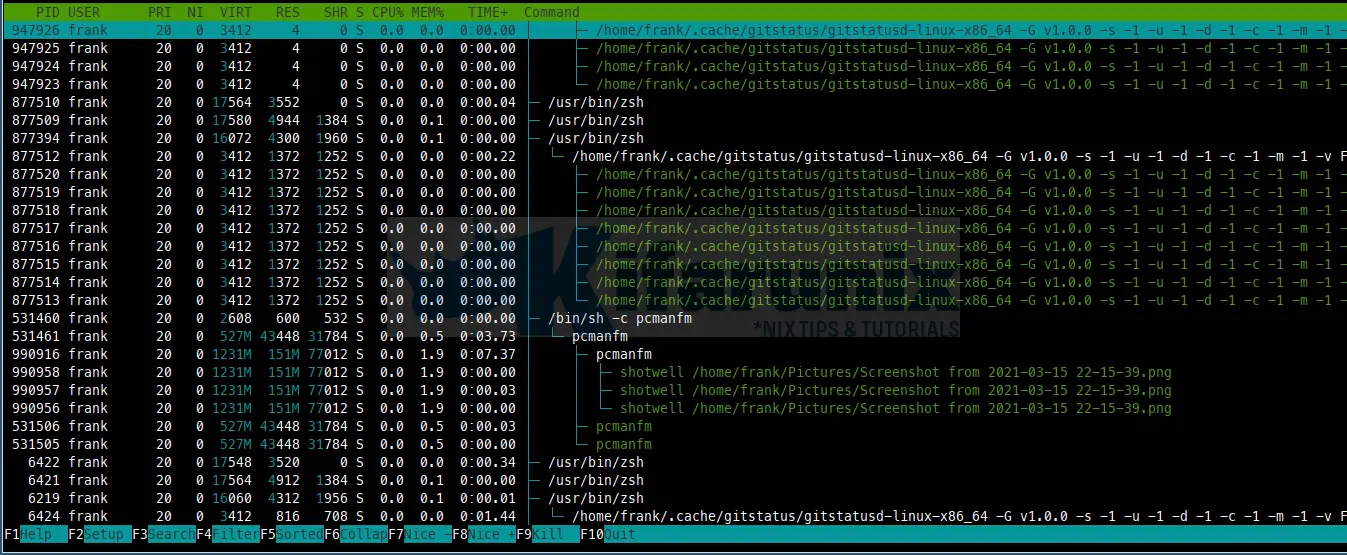
Through F5 Tree option, processes are organised by parenthood and layout the relations between them as a tree.
Seaching Processes
Using F3 Search option, Incrementally search the command lines of all the displayed processes. The currently selected (highlighted) command will update as you type. While in search mode, pressing F3 will cycle through matching occurrences.
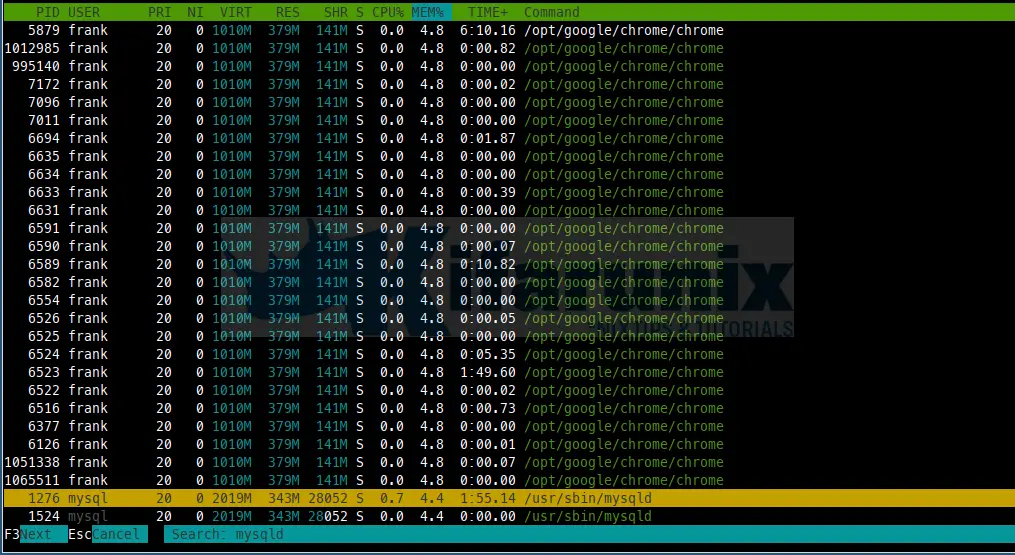
In the above example, we searched for myqld and it has been highlighted in yellow color.
Increasing the Priority of a Process
Using F7 Nice- option,we increase the selected process’s priority (subtract from ‘nice’ value). This can only be done by the superuser.
Decreasing the Priority of a Process
Using F8 Nice+ option, we decrease the selected process’s priority (add to ‘nice’ value).
Displaying Help
Using F1 Help option, we get help on how to use htop utility tool and and various shortcuts in the tool.
Customizing Htop
Using F2 Setup option, we get setup screen, where you can configure the meters displayed at the top of the screen, set various display options, choose among color schemes,and select which columns are displayed, in which order.
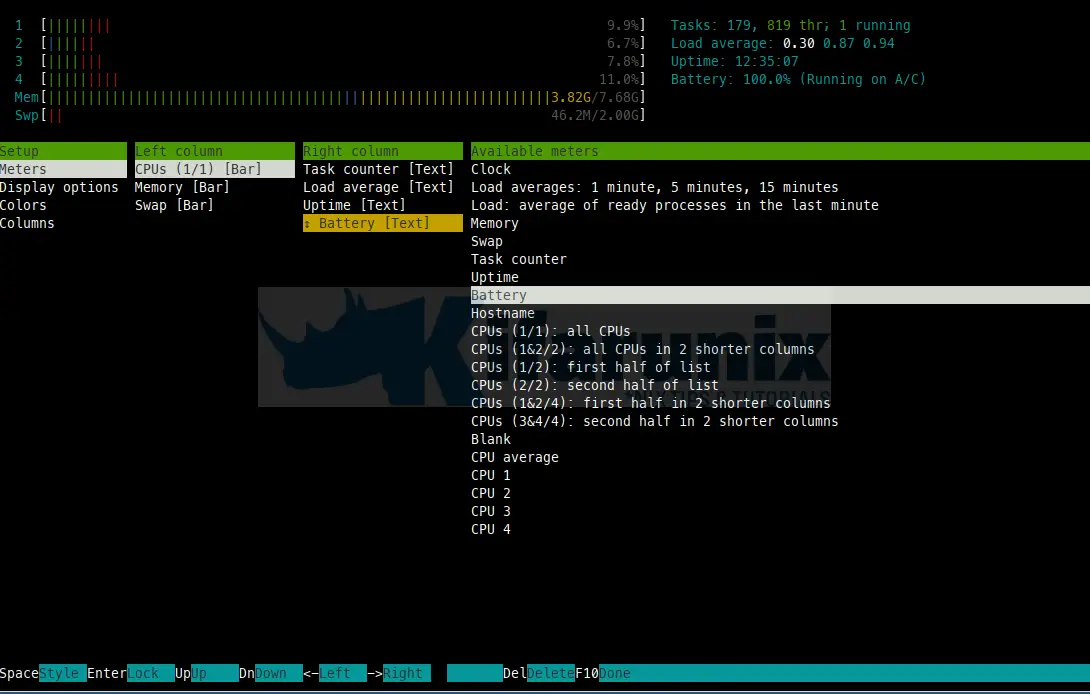
In the above example, we have setup battery to be displayed in the top section of htop utility.
Killing Processes
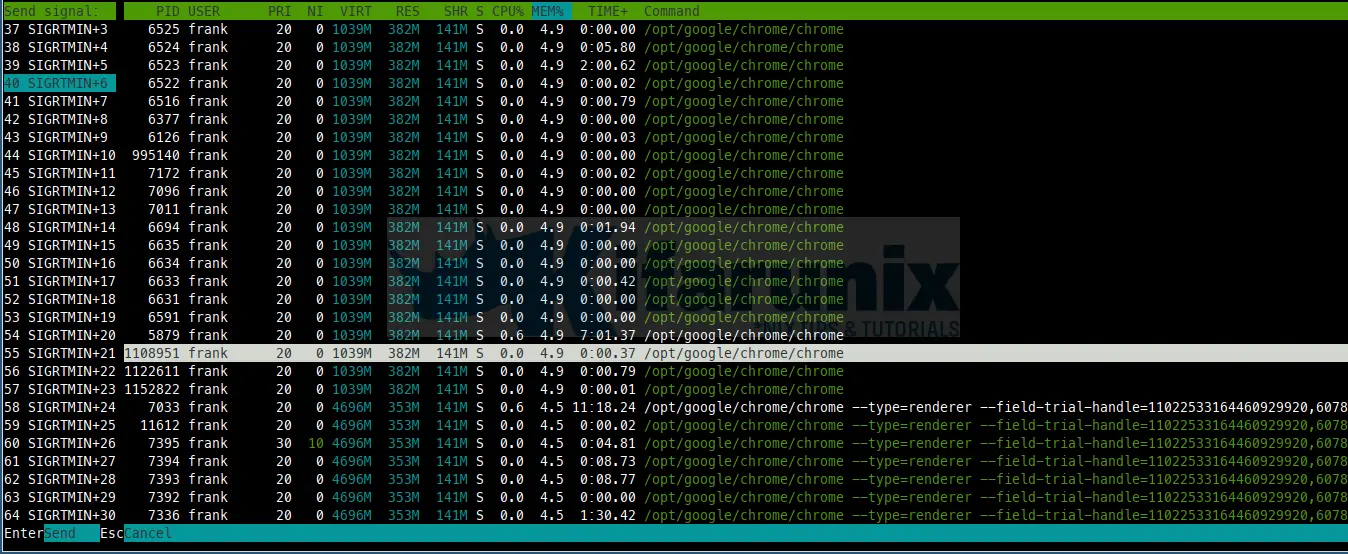
Using F9 Kill option, “Kill” process: sends a signal which is selected in a menu, to one or a group of processes. If processes were tagged, sends the signal to all tagged processes. If none is tagged, sends to the currently selected process.
Exiting
We use F10 Quit option to exit htop utility tool.
In this tutorial you have learnt how to;
- Check if
htopis installed in different Linux Distos - Install
htopin different Linux Distros - Use
htopin Linux


