
In this tutorial, you will learn how to monitor Linux system metrics with ELK Stack. ELK Stack, or if you like, Elastic stack can be used to monitor Linux system metrics with the aid of the Metricbeat. Metricbeat is a lightweight shipper for system metrics. It can collect system-level CPU usage, memory, file system, disk IO, and network IO statistics, as well as top-like statistics for every process running on your systems and ship them to Elasticsearch for indexing to enable visualization through the visualization tools like Kibana.
Table of Contents
Monitoring Linux System Metrics with ELK Stack
Install and Setup ELK Stack
You need to have an ELK stack already setup and running. The setup of ELK Stack is beyond the scope of this guide, however, you can follow the links below to install and setup ELK Stack
Deploy a Single Node Elastic Stack Cluster on Docker Containers
Install Metricbeat in Linux Systems
In this tutorial we will be using a CentOS 8 and an Ubuntu 20.04 systems for demo.
Install Metricbeat on Ubuntu
You can install Metricbeat from the official Elastic repos or directly using the Metricbeat DEB binary. We use the former method in this setup.
Install Elastic stack repo Public Signing Key:
sudo apt install gnupg2 -ywget -qO - https://artifacts.elastic.co/GPG-KEY-elasticsearch | sudo gpg --dearmor > /etc/apt/trusted.gpg.d/elk.gpgInstall Elastic stack repo on Ubuntu
We are running Elastic Stack 7.17.0, hence we are installing Metricbeat v7.17.0
echo "deb https://artifacts.elastic.co/packages/7.x/apt stable main" | sudo tee -a /etc/apt/sources.list.d/elastic-7.x.listUpdate package cache;
sudo apt updateInstall Metricbeat v7.17.0 on Ubuntu;
sudo apt install metricbeat=7.17.0Install Metricbeat on CentOS
Similarly, you can install Metricbeat on CentOS/RHEL or similar releases using the RPM binary or directly from the Elastic stack repos.
For convenience sake, we install it from the Elastic stack repo, hence;
Install Elastic stack repo Public Signing Key:
sudo rpm --import https://packages.elastic.co/GPG-KEY-elasticsearchInstall Elastic stack repo on CentOS 8;
cat << EOL > /etc/yum.repos.d/elasticstack.repo
[elastic-7.x]
name=Elastic repository for 7.x packages
baseurl=https://artifacts.elastic.co/packages/7.x/yum
gpgcheck=1
gpgkey=https://artifacts.elastic.co/GPG-KEY-elasticsearch
enabled=1
autorefresh=1
type=rpm-md
EOL
Install Metricbeat on CentOS;
sudo dnf install metricbeat-7.17.0Configure Metricbeat to collect various system metrics
Once the installation of metric is done, configure it to collect various system metrics and ship them to either Elasticsearch or Logstash depending on your setup.
Configure Metricbeat in Linux
To begin with, configure Metricbeat output. In this setup, we are sending Metricbeat data directly to Elasticsearch running on a remote host. As such, edit the Metricbeat configuration file and define Elasticsearch output.
vim /etc/metricbeat/metricbeat.yml
...
# ---------------------------- Elasticsearch Output ----------------------------
output.elasticsearch:
  # Array of hosts to connect to.
  #hosts: ["localhost:9200"]
  hosts: ["192.168.57.30:9200"]
If you configured ELK stack authentication, ensure you define username and password with proper roles to write into the respective index you are using for Metricbeat data.
If you are sending the metric data to Logstash instead, comment the Elasticsearch output configs and enable Logstash output as follows;
...
# ---------------------------- Elasticsearch Output ----------------------------
#output.elasticsearch:
  # Array of hosts to connect to.
  #hosts: ["localhost:9200"]
  #hosts: ["192.168.57.30:9200"]

  # Protocol - either `http` (default) or `https`.
  #protocol: "https"

  # Authentication credentials - either API key or username/password.
  #api_key: "id:api_key"
  #username: "elastic"
  #password: "changeme"

# ------------------------------ Logstash Output -------------------------------
output.logstash:
  # The Logstash hosts
  #hosts: ["localhost:5044"]
  hosts: ["192.168.57.30:5044"]
Configure Kibana Endpoint
If you will want to use Metricbeat prebuilt Kibana dashboards and both Kibana and Elasticsearch are running on separate hosts, then you will need to load the dashboard manually. For this reason, you need to configure Kibana endpoint. Otherwise, if Kibana and Elasticsearch are running on the same host, you don’t need to configure Kibana endpoint and can safely ignore this configuration.
vim /etc/metricbeat/metricbeat.yml
...
# =================================== Kibana ===================================

# Starting with Beats version 6.0.0, the dashboards are loaded via the Kibana API.
# This requires a Kibana endpoint configuration.
setup.kibana:

  # Kibana Host
  #host: "localhost:5601"
  host: "192.168.57.30:5601"
Configure Metricbeat logging
To ensure that Metricbeat is logging to its specific file instead of the syslog (/var/log/syslog, /var/log/messages), enter the following lines into the configuration file;
# ================================= Logging ====================================
logging.level: info
logging.to_files: true
logging.files:
  path: /var/log/metricbeat
  name: metricbeat
  keepfiles: 7
  permissions: 0644
Save and exit the configuration.
Enable and configure metrics collection modules
Metricbeat ships with a dozen modules that enabled it to collect specific service metrics. You can list modules by running the command below;
metricbeat modules listThe command shows enabled and disabled modules;
Enabled:
system

Disabled:
activemq
aerospike
apache
...
To enable a module, simply run;
metricbeat modules enable <module-name>Where a module-name you can obtain from the list above.
Similarly, to disable a module;
metricbeat modules disable <module-name>In this setup, we are using the Metricbeat system module, which is already enabled.
This Metricbeat system module collects the following metricsets;
- cpu
- load
- memory
- network
- process
- process_summary
- socket_summary
- entropy
- core
- diskio
- socket
- service
- users
If you want to modify the module, simply open the file, /etc/metricbeat/modules.d/system.yml, for editing.
Load Metric Kibana Dashboards/Elasticsearch Index Template
You can load the recommended index template for writing to Elasticsearch and deploy the sample dashboards for visualizing the Metricbeat data in Kibana by executing the command below;
metricbeat setup -eThe command above expects Kibana to be listening on localhost.
Otherwise, configure Kibana to listen on an IP interface and load the dashboard from the metricbeat host using the command below;
metricbeat setup -e -E setup.kibana.host=192.168.58.22:5601
2023-04-07T17:40:23.797Z	INFO	template/load.go:197	Existing template will be overwritten, as overwrite is enabled.
2023-04-07T17:40:24.404Z	INFO	template/load.go:131	Try loading template metricbeat-7.17.0 to Elasticsearch
2023-04-07T17:40:24.456Z	INFO	template/load.go:123	Template with name "metricbeat-7.17.0" loaded.
2023-04-07T17:40:24.457Z	INFO	[index-management]	idxmgmt/std.go:297	Loaded index template.
2023-04-07T17:40:24.460Z	INFO	[index-management.ilm]	ilm/std.go:126	Index Alias metricbeat-7.17.0 exists already.
Index setup finished.
Loading dashboards (Kibana must be running and reachable)
2023-04-07T17:40:24.460Z	INFO	kibana/client.go:180	Kibana url: http://192.168.58.22:5601
2023-04-07T17:40:24.905Z	INFO	kibana/client.go:180	Kibana url: http://192.168.58.22:5601
2023-04-07T17:40:26.680Z	INFO	[add_cloud_metadata]	add_cloud_metadata/add_cloud_metadata.go:101	add_cloud_metadata: hosting provider type not detected.
2023-04-07T17:42:17.980Z	INFO	instance/beat.go:869	Kibana dashboards successfully loaded.
Loaded dashboards
If you need to define username and password for authentication, pass the options,
-E setup.kibana.username=elastic -E setup.kibana.password=PASSWORDIf you are using Logstash or any other processing engines instead of using Elasticsearch as output, you need to load the index template manually into Elasticsearch. This requires a direct connection to Elasticsearch. The command below is used to load the index template manually to Elasticsearch (It temporarily disables Logstash Output).
metricbeat setup -e -E output.logstash.enabled=false -E output.elasticsearch.hosts=['192.168.57.30:9200'] -E setup.kibana.host=192.168.57.30:5601Running Metricbeat in Linux System
Test Metricbeat configuration syntax;
metricbeat test configIf you get, Config OK, then all is good. otherwise, if there is any error, fix before you can proceed.
Test Modules settings;
metricbeat test modulesAlso, test Metricbeat output connection;
metricbeat test outputSample output;
  parse url... OK
  connection...
    parse host... OK
    dns lookup... OK
    addresses: 192.168.58.22
    dial up... OK
  TLS... WARN secure connection disabled
  talk to server... OK
  version: 7.17.0
Once the installation and configuration of Metricbeat is done, you can start and enable Metricbeat service to run on system boot;
systemctl enable --now metricbeatTo check the status;
systemctl status metricbeat
● metricbeat.service - Metricbeat is a lightweight shipper for metrics.
     Loaded: loaded (/lib/systemd/system/metricbeat.service; enabled; vendor preset: enabled)
     Active: active (running) since Fri 2023-04-07 17:49:49 UTC; 2s ago
       Docs: https://www.elastic.co/beats/metricbeat
   Main PID: 71759 (metricbeat)
      Tasks: 5 (limit: 1026)
     Memory: 60.1M
        CPU: 271ms
     CGroup: /system.slice/metricbeat.service
             └─71759 /usr/share/metricbeat/bin/metricbeat --environment systemd -c /etc/metricbeat/metricbeat.yml --path.home /usr/share/metricbeat --path.config /etc/metr>

Apr 07 17:49:49 ubuntu systemd[1]: metricbeat.service: Deactivated successfully.
Apr 07 17:49:49 ubuntu systemd[1]: Stopped Metricbeat is a lightweight shipper for metrics..
Apr 07 17:49:49 ubuntu systemd[1]: Started Metricbeat is a lightweight shipper for metrics..
Check the logs;
tail -f /var/log/metricbeat/metricbeatIf you get such as error related to Glibc as, Fatal glibc error: rseq registration failed, then check the guide below on how to fix;
How to Fix Beats Glibc Related Errors
Create Metricbeat Kibana Index Pattern
Navigate to your Elastic stack dashboard and create Kibana Metricbeat index to enable you view and visualize the metric data.
The Index should be already created if the Metricbeat is started on your remote monitoring systems and system metric data is already being collected or if you loaded with the metricbeat setup command above.
Confirm under Kibana menu > Management > Stack Management > Data > Index Management;

Next, create metricbeat Kibana index pattern, if it is not already created, by navigating to Kibana menu > Management > Stack Management > Kibana > Index Patterns > Create index pattern.

Enter the pattern that matches your index, and choose @timestamp as Timestamp field and create the index pattern.
View Metricbeat Data in Kibana
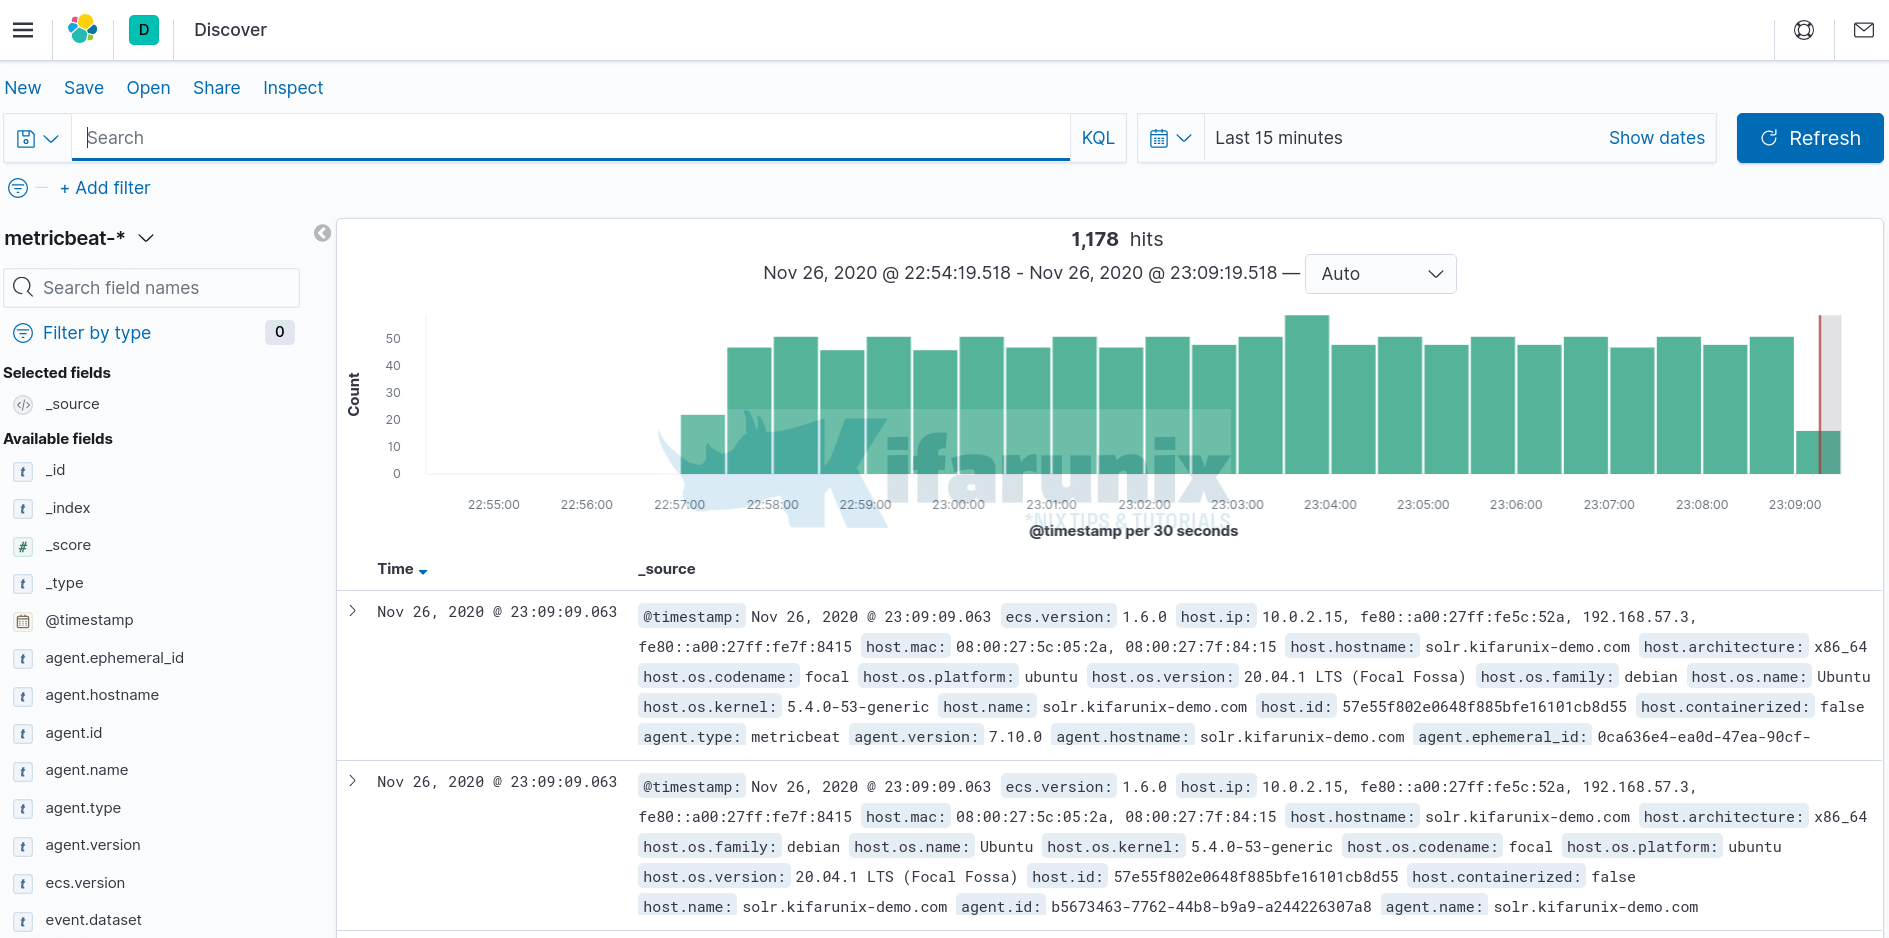
Metricbeat RAW Data
Under the Discover navigation, select metricbeat-* index to view the Metricbeat raw data.
Adjust the time range accordingly.

Metricbeat System Overview Dashboard
In the side navigation, click Dashboard, then select the dashboard that you want to open. For example, [Metricbeat System] Host overview ECS.

Viewing Metrics App Visualizations
In the side navigation, navigate to Observability > Metrics. Under Inventory, you see hosts available.

Click on the specific host to view its metrics and open metrics as page.

And that marks the end of our tutorial.
Reference
Metricbeat quick start: installation and configuration
Related Tutorials
Monitor System Metrics with TICK Stack on Ubuntu 20.04
Monitor Linux System Metrics with Prometheus Node Exporter
Install Grafana Metrics Monitoring Tool on Debian 9
