Hello guys, we are at it again on how to install Grafana metrics monitoring tool on Debian 9. Our previous guide was on installing Grafana Data monitoring tool on Ubuntu 18.04. Well, as you already know, Grafana is an opensource time series data analytic and monitoring tool. Grafana provides beautiful graphing options for the collected system metrics. Among the database backends from which it can collect these metrics include Graphite, InfluxDB, Prometheus, Elasticsearch and several other data sources.
Install Grafana Metrics Monitoring Tool on Debian 9
To install Grafana metrics monitoring tool on Debian 9, there are about three methods that you can use. These include;
- Installing Grafana using DEB file
- Installing Grafana from APT repository
- Installing Grafana from Archive file
In this guide, we are going to look at how to install Grafana using the first two methods. Before you can opt for any of the methods, ensure that your system is upto-date.
apt update
apt upgrade
Installing Grafana using DEB file
The Debian 9 default repositories does not contain Grafana package. In that case, we are going to download the DEB file for Grafana and install it as shown below;
Download Grafana DEB file
The Grafana DEB file can be grabbed using the command below.
wget https://dl.grafana.com/oss/release/grafana_5.4.2_amd64.debInstall Grafana using DEB file
You can use any of the apt, dpkg, or gdebi package managers to install the Grafana DEB file.
sudo dpkg -i grafana_5.4.2_amd64.deb
Selecting previously unselected package grafana.
(Reading database ... 45800 files and directories currently installed.)
Preparing to unpack grafana_5.4.2_amd64.deb ...
Unpacking grafana (5.4.2) ...
Setting up grafana (5.4.2) ...
Adding system user `grafana' (UID 111) ...
Adding new user `grafana' (UID 111) with group `grafana' ...
Not creating home directory `/usr/share/grafana'.
### NOT starting on installation, please execute the following statements to configure grafana to start automatically using systemd
 sudo /bin/systemctl daemon-reload
 sudo /bin/systemctl enable grafana-server
### You can start grafana-server by executing
 sudo /bin/systemctl start grafana-server
Processing triggers for systemd (232-25+deb9u6) ...
Installing Grafana from APT repository
In this case, we are going to create Grafana APT source list under /etc/apt/sources.list.d/ and import the respective GPG APT key for singing Grafana packages. This can be done as shown below;
sudo vim /etc/apt/sources.list.d/grafana.list
deb https://packages.grafana.com/oss/deb stable mainImport Grafana GPG APT key
curl https://packages.grafana.com/gpg.key | sudo apt-key add -
Update your Debian 9 packages
apt update
Install Grafana using the apt package manager. This is a sure bet method since it installs all the necessary dependencies.
apt install grafana
Reading package lists... Done
Building dependency tree
Reading state information... Done
The following NEW packages will be installed:
  grafana
0 upgraded, 1 newly installed, 0 to remove and 0 not upgraded.
Need to get 55.4 MB of archives.
After this operation, 159 MB of additional disk space will be used.
Get:1 https://packages.grafana.com/oss/deb stable/main amd64 grafana amd64 5.4.3 [55.4 MB]
Fetched 55.4 MB in 2min 2s (452 kB/s)
debconf: unable to initialize frontend: Dialog
debconf: (Dialog frontend requires a screen at least 13 lines tall and 31 columns wide.)
debconf: falling back to frontend: Readline
Selecting previously unselected package grafana.
(Reading database ... 45814 files and directories currently installed.)
Preparing to unpack .../grafana_5.4.3_amd64.deb ...
Unpacking grafana (5.4.3) ...
Processing triggers for systemd (232-25+deb9u7) ...
Setting up grafana (5.4.3) ...
### NOT starting on installation, please execute the following statements to configure grafana to start automatically using systemd
 sudo /bin/systemctl daemon-reload
 sudo /bin/systemctl enable grafana-server
### You can start grafana-server by executing
 sudo /bin/systemctl start grafana-server
Processing triggers for systemd (232-25+deb9u7) ...
So either method gets you to the same destination. The choice is yours. If you however choose to got with the dpkg method, ensure that you got adduser and libfontconfig packages installed.
apt install adduser libfontconfig
So far so good, Grafana has been successfully installed. Want to install the latest version of Grafana (v6.2.1).
Install Grafana 6.2.x on Ubuntu 18.04/Debian 9
The next thing is to access the Grafana Web dashboard. But before that, you need to open the Grafana TCP port 3000 on firewall to allow external access.
ufw allow 3000/tcp
Start and enable Grafana to run when system reboots.
sudo systemctl daemon-reload
sudo systemctl enable grafana-server
sudo systemctl start grafana-server
You can verify that Grafana is now listening on TCP port 3000
ss -altnp | grep 3000
LISTEN     0      128         :::3000                    :::*                   users:(("grafana-server",pid=8020,fd=6))
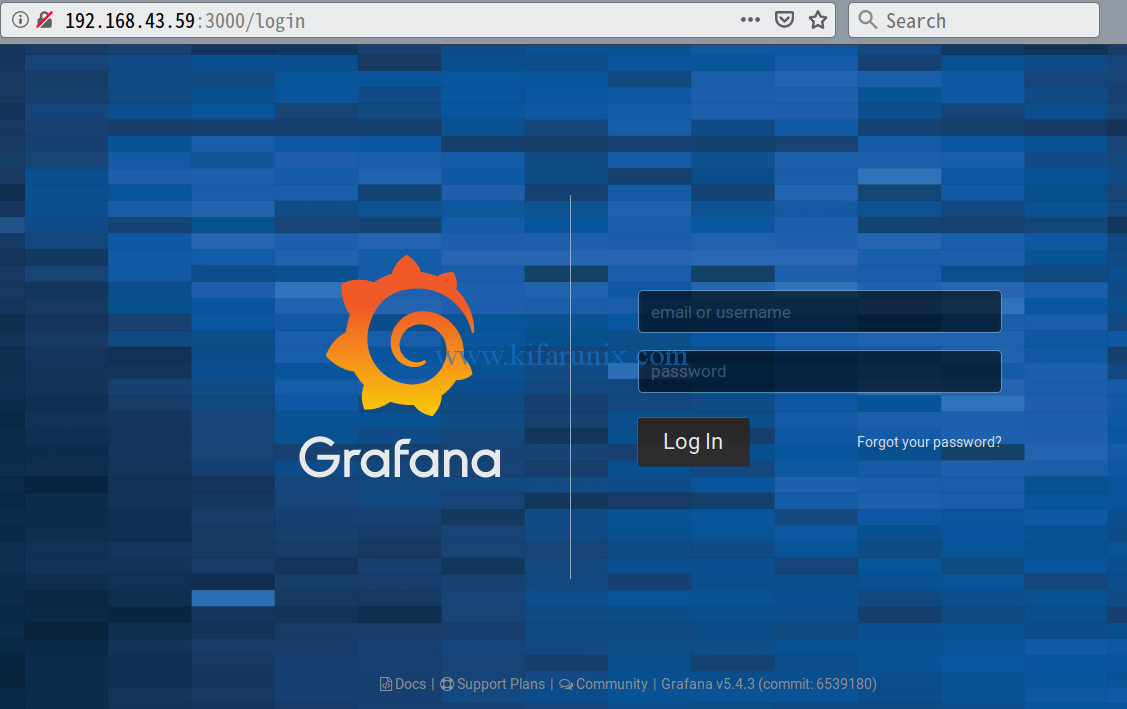
Next, Navigate to the browser and access Grafana using the URL http://server-IP:3000. This will take you the login page.
To login, use the default credentials
username: admin
password: admin
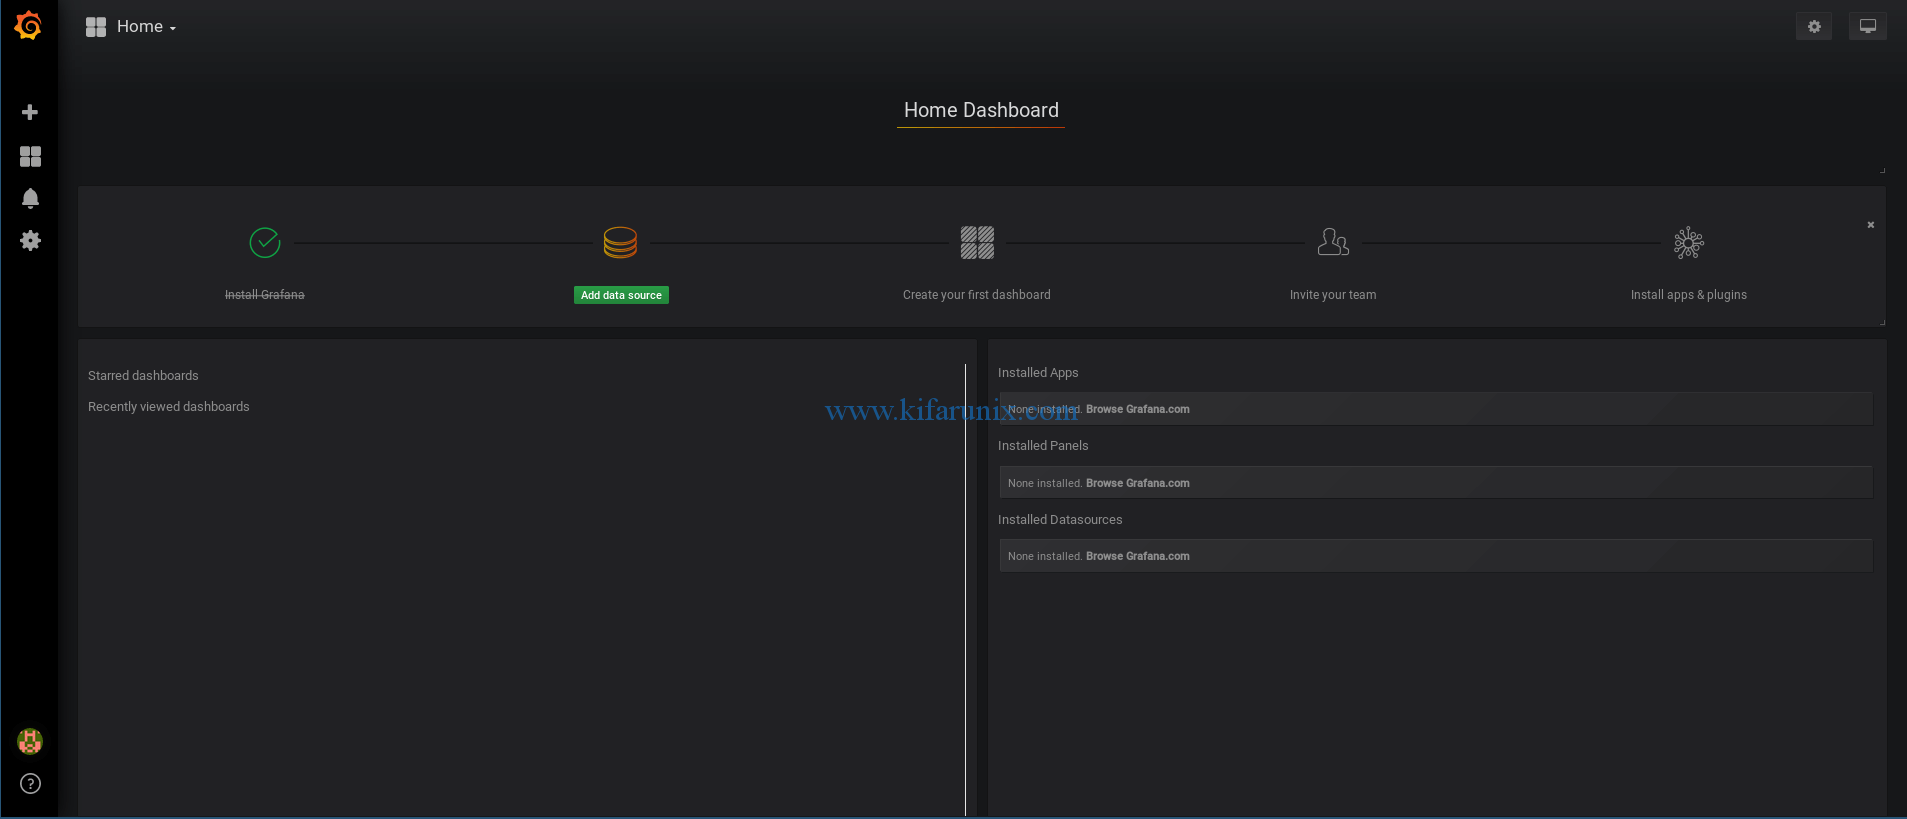
When you login with the default logins, you need to reset the admin password. Please do so and proceed to Grafana default dashboard.
The default Grafana dashboard.
Magnificent!! That is all about how to install Grafana metrics monitoring tool on Debian 9. In our next guides, we will discuss how to collect system metrics using different data stores for monitoring. Stay connected, you are about to experience a whole new experience of system monitoring.
Want to install TIG Stack, ELastic Stack or Graylog? Check our guides below;


