In this tutorial, you will learn how to monitor process creation events on Windows systems using Wazuh and ELK Stack. On Windows systems, when a program runs, a process is created. Process creation events monitoring is paramount in detecting any would-be malicious (malware and threat actor) activities as it gives you more visibility into what is happening within your Windows system environment.
Monitor Process Creation Events on Windows Systems using Wazuh and ELK stack
In order to monitor process creation events on Windows systems, you need to collect the process creation events and push them to Wazuh Manager.
In this tutorial, we will be using Wazuh agents and Sysmon to collect events from various windows event channels including process creation events.
Install and Integrate Wazuh Manager with ELK Stack
Thus before you begin, ensure that you have ELK Stack integrated with Wazuh manager installed and running. See example tutorials below;
Integrate Wazuh Manager with ELK Stack
Install Wazuh Server on Rocky Linux 8
NOTE: We are running ELK 7.14.2 and Wazuh Manager 4.2.5.
Kibana (ELK) version;
cat /usr/share/kibana/package.json | grep versionSample output;
"version": "7.14.2",Wazuh Manager version;
/var/ossec/bin/wazuh-control info | grep WAZUH_VERSIONSample output;
WAZUH_VERSION="v4.2.5"Install Wazuh Agents on Windows Systems
In this example setup, I will be using Windows 10 system for demonstration purposes.
To install Wazuh agent on Windows 10 and automatically add it to Wazuh manager, then;
- Open PowerShell as Administrative user;
- Next, download Wazuh agent from Wazuh agent downloads page;
- In this example, we have downloaded the agent installer to Downloads folder;
cd C:\Users\<username>\Downloads\- To automatically install and register agent, then run the command below. Replace the IP address 192.168.58.26 with your Wazuh Manager IP address.
.\wazuh-agent-4.2.5-1.msi /q WAZUH_MANAGER="192.168.58.26" WAZUH_REGISTRATION_SERVER="192.168.58.26"Once the installation is done, Wazuh agent is started and enabled to run on system boot.
It should also be showing on the Kibana Wazuh App.
To confirm on Wazuh Manager command line;
/var/ossec/bin/agent_control -lYou should see it among the active agents.
Install Sysmon on Windows Systems
In this example setup, we will install Sysmon with a customized SwiftOnSecurity configuration file template with default high-quality event tracing.
Thus;
- Create Sysmon directory on C:\Program Files folder.
- Download SwiftOnSecurity configuration file template and save it under the C:\Program Files\Sysmon created above.
- Download Sysmon from the downloads page.
- Extract the contents of the zipped Sysmon file to C:\Program Files\Sysmon directory.
- Navigate to C:\Program Files\Sysmon and install Sysmon by running the command below;
cd C:\'Program Files'\Sysmon.\Sysmon64.exe -i .\sysmonconfig-export.xml -accepteulaSystem Monitor v13.33 - System activity monitor
By Mark Russinovich and Thomas Garnier
Copyright (C) 2014-2022 Microsoft Corporation
Using libxml2. libxml2 is Copyright (C) 1998-2012 Daniel Veillard. All Rights Reserved.
Sysinternals - www.sysinternals.com
Loading configuration file with schema version 4.50
Sysmon schema version: 4.81
Configuration file validated.
Sysmon64 installed.
SysmonDrv installed.
Starting SysmonDrv.
SysmonDrv started.
Starting Sysmon64..
Sysmon64 started.
Configure Wazuh agent to monitor Sysmon events
Next, you need to ensure that Wazuh agent can monitor Sysmon events.
Thus, edit Wazuh agent configuration file, C:\Program Files (x86)\ossec-agent\ossec.conf using your preferred notepad as administrator.
Add the lines below to the config file;
  <localfile>
  <location>Microsoft-Windows-Sysmon/Operational</location>
  <log_format>eventchannel</log_format>
  </localfile>
We put them just before the policy monitoring section;
...
  <localfile>
    <location>active-response\active-responses.log</location>
    <log_format>syslog</log_format>
  </localfile>

  <localfile>
  <location>Microsoft-Windows-Sysmon/Operational</location>
  <log_format>eventchannel</log_format>
  </localfile>

  <!-- Policy monitoring -->
  <rootcheck>
    <disabled>no</disabled>
    <windows_apps>./shared/win_applications_rcl.txt</windows_apps>
    <windows_malware>./shared/win_malware_rcl.txt</windows_malware>
  </rootcheck>
  ...
Save and file once you add the lines.
Update Wazuh manager Rules
Next, you need to update Wazuh manager rules to process Sysmon events;
cat >> /var/ossec/etc/rules/local_rules.xml << 'EOL'
<group name="sysmon,">
  <rule id="220000" level="3">
    <if_group>sysmon</if_group>
    <description>Windows Sysmon event. Event ID: $(win.system.eventID)</description>
    <options>no_full_log</options>
  </rule>
</group>
EOL
Simulate Process Creation Events
Next, in order to verify that Wazuh-Sysmon integration can actually collect process creation events, you need to simulate these events and check whether they are appearing on the Kibana Wazuh App dashboard.
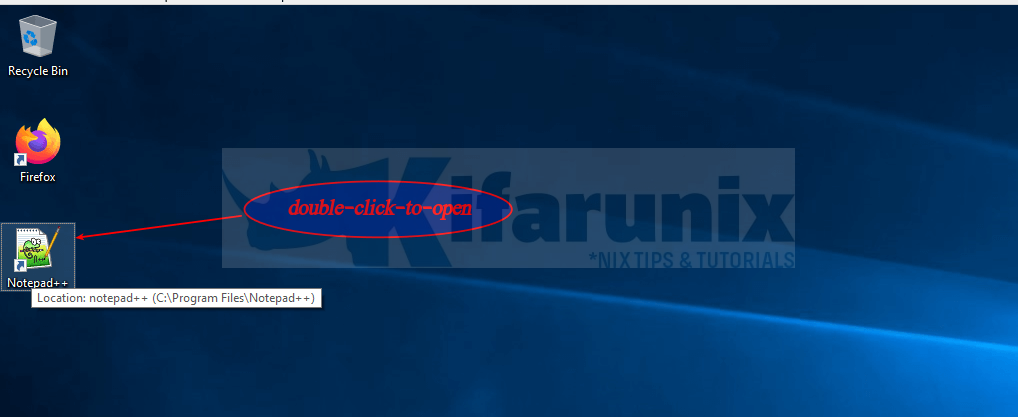
To simulate process creation, try to run some programs. For example, let’s launch Notepad (it can be any program) by clicking the desktop app;
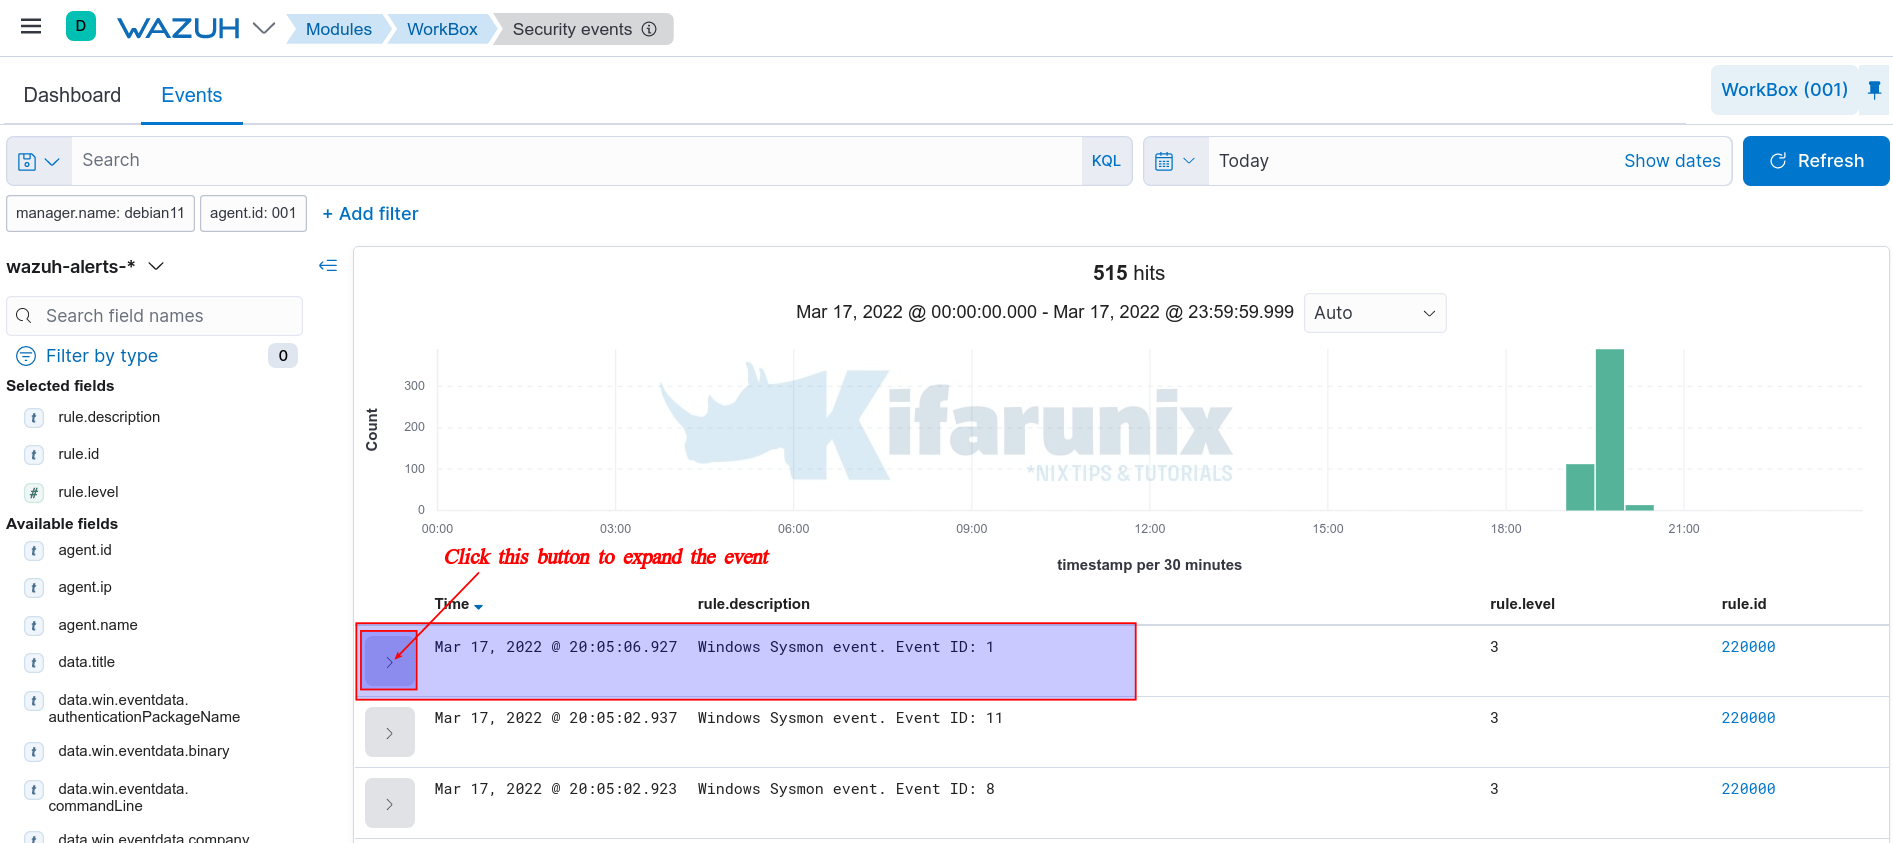
Once it launches, go to Kibana Wazuh App and check the events sent by the Windows host.
The System Process creation events are identified by Event ID 1. Hence, be on the look out for such events. See the event highlighted in the sample screenshot below;
You can as well filter the events based on the ID, for example data.win.system.eventID: 1.
Read more about Sysmon Events and IDS on Sysmon Events page.
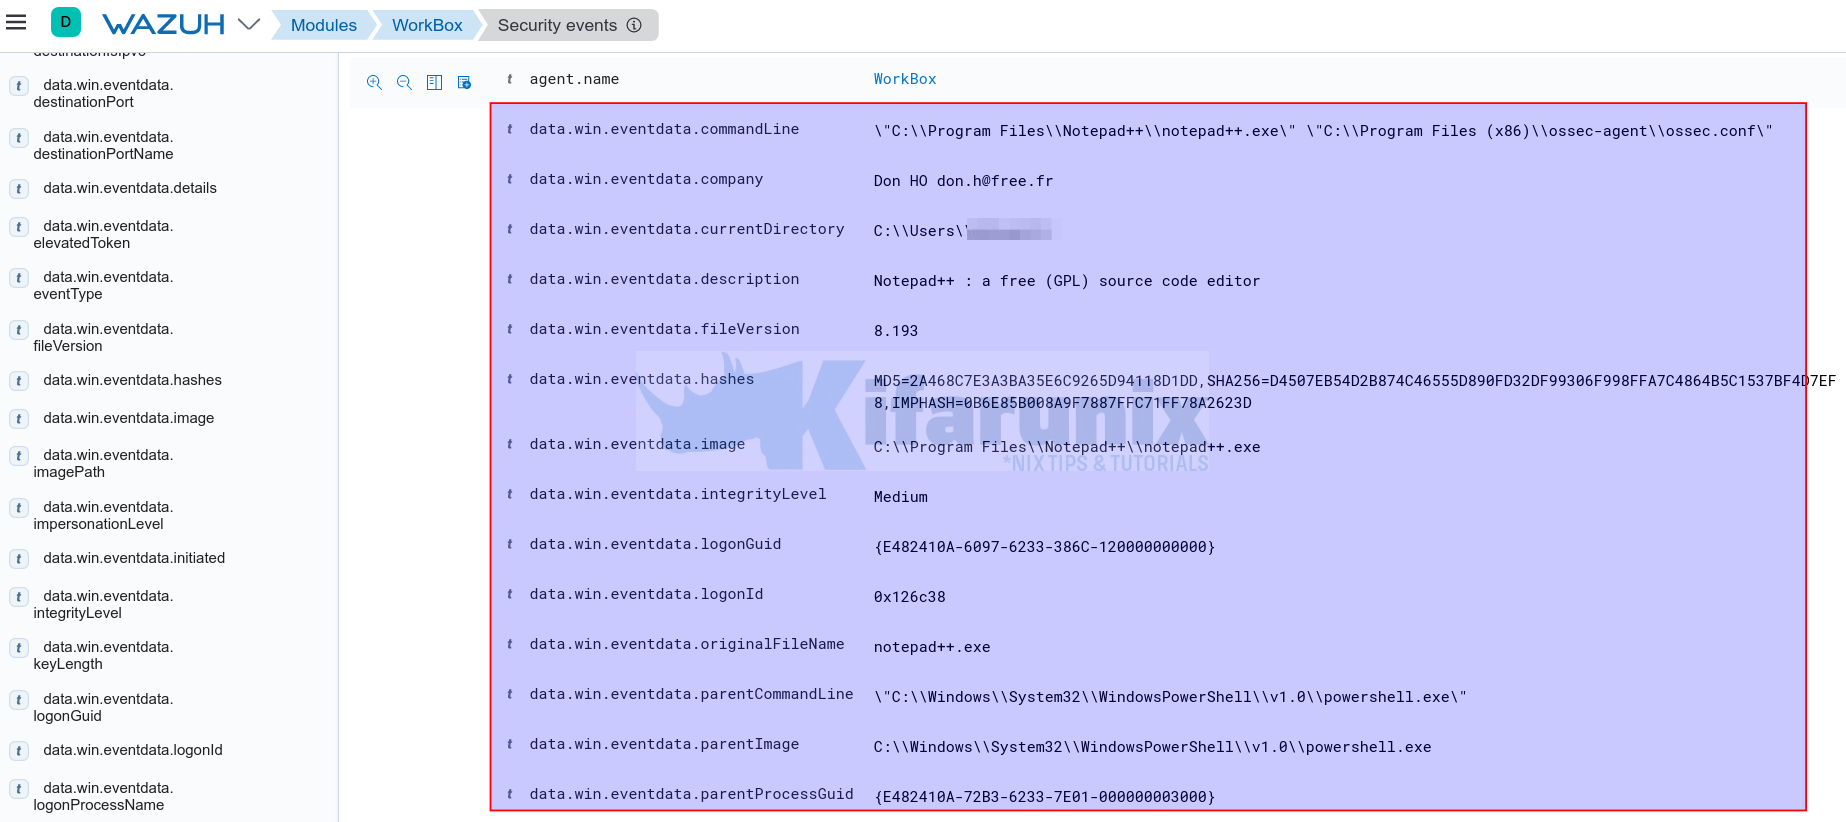
Click the highlighted button to expand and see more details about the event including the extracted fields.
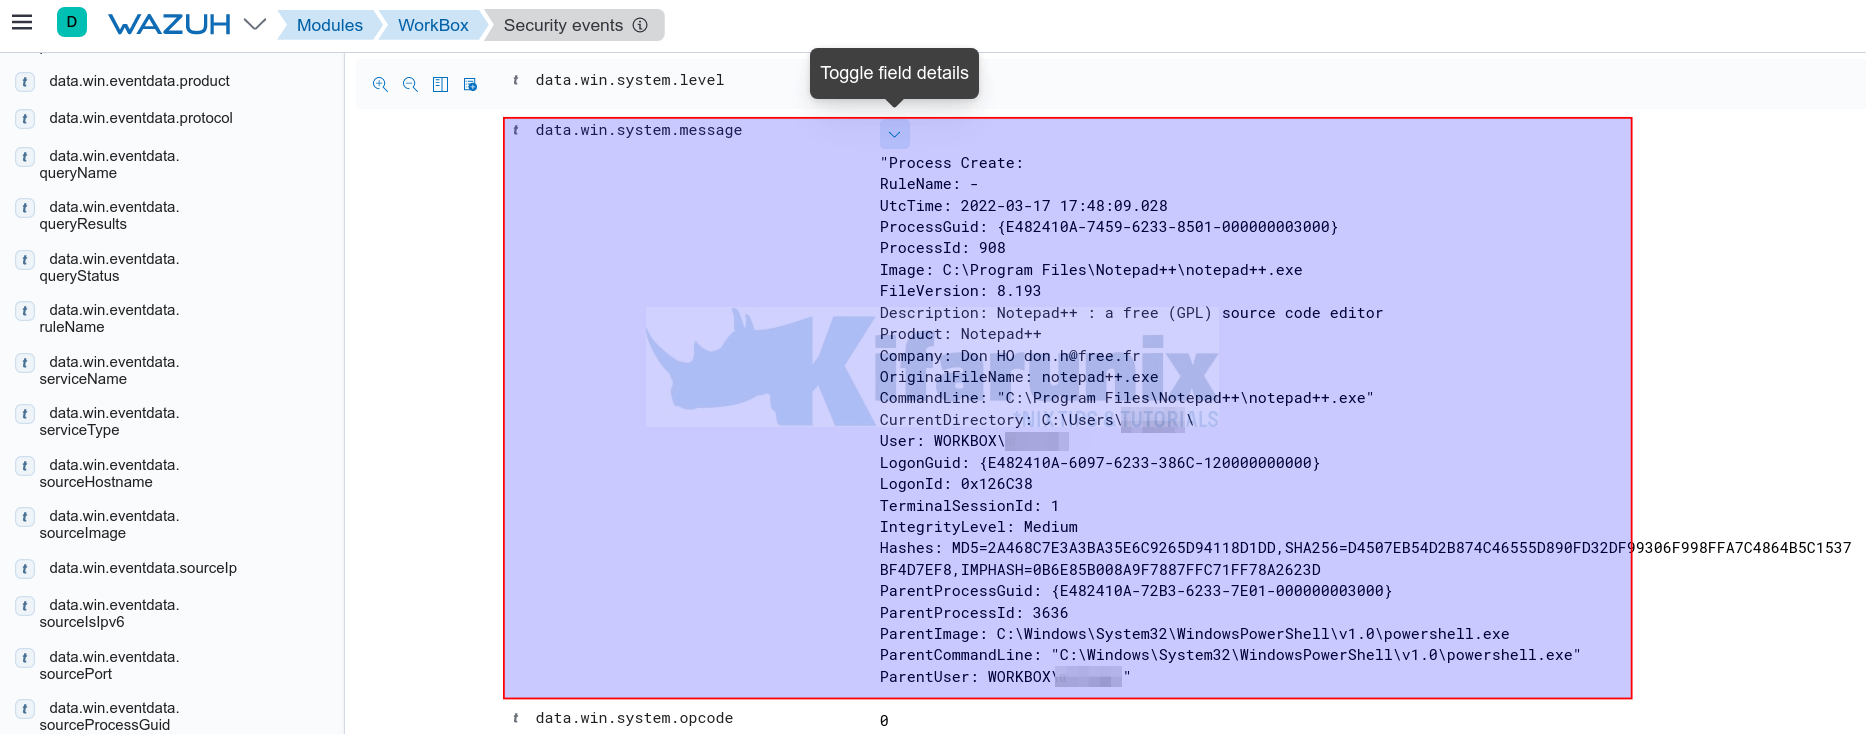
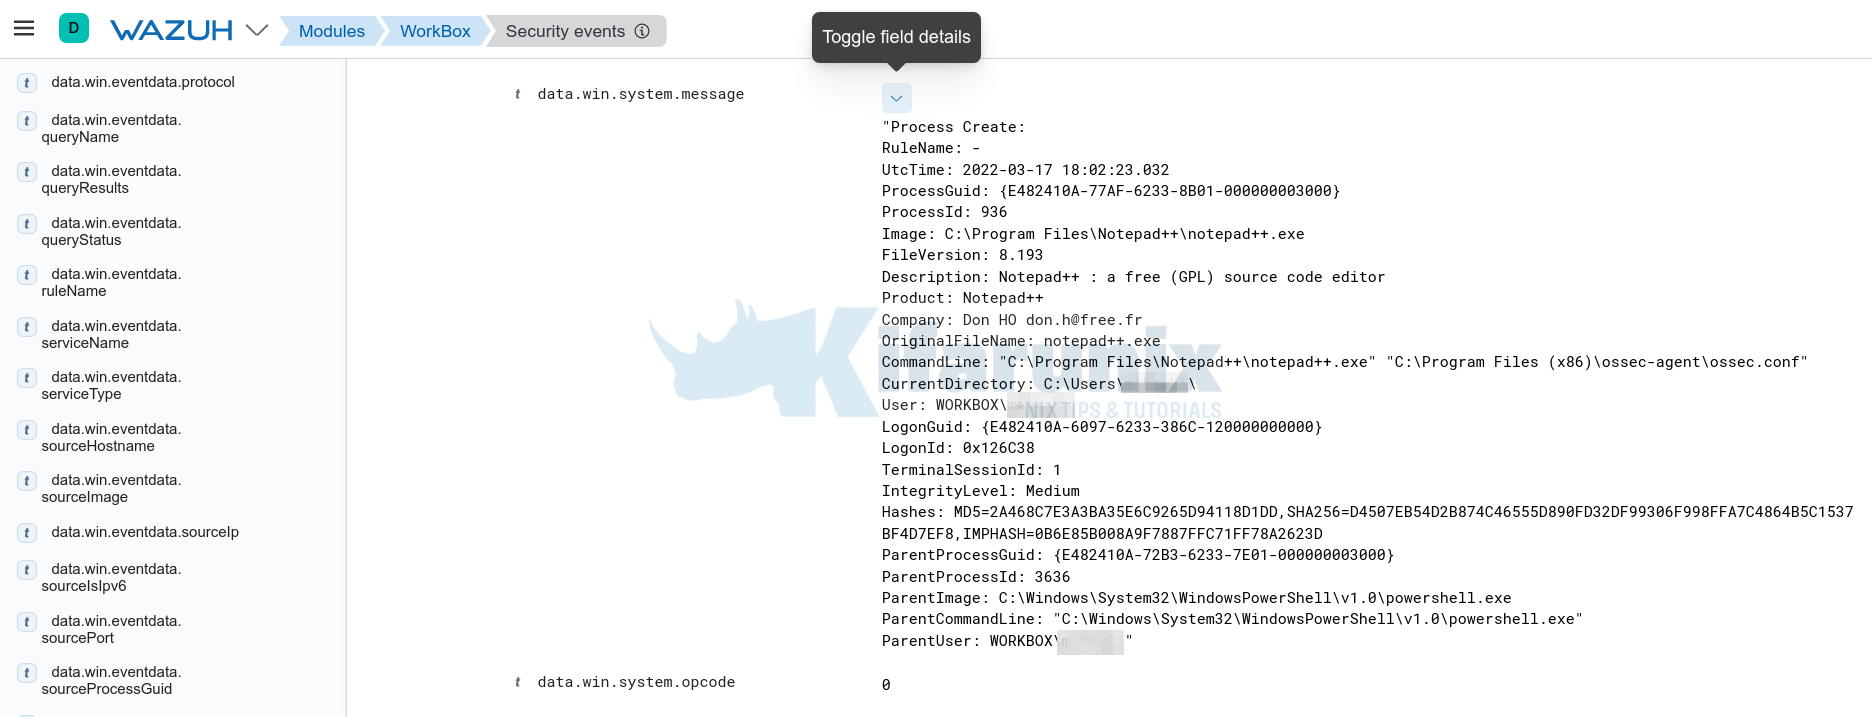
When you scroll down the expanded view, you can see the event message. This is where you can see the details about the process created by launching Notepad++ with all the fields in one place.
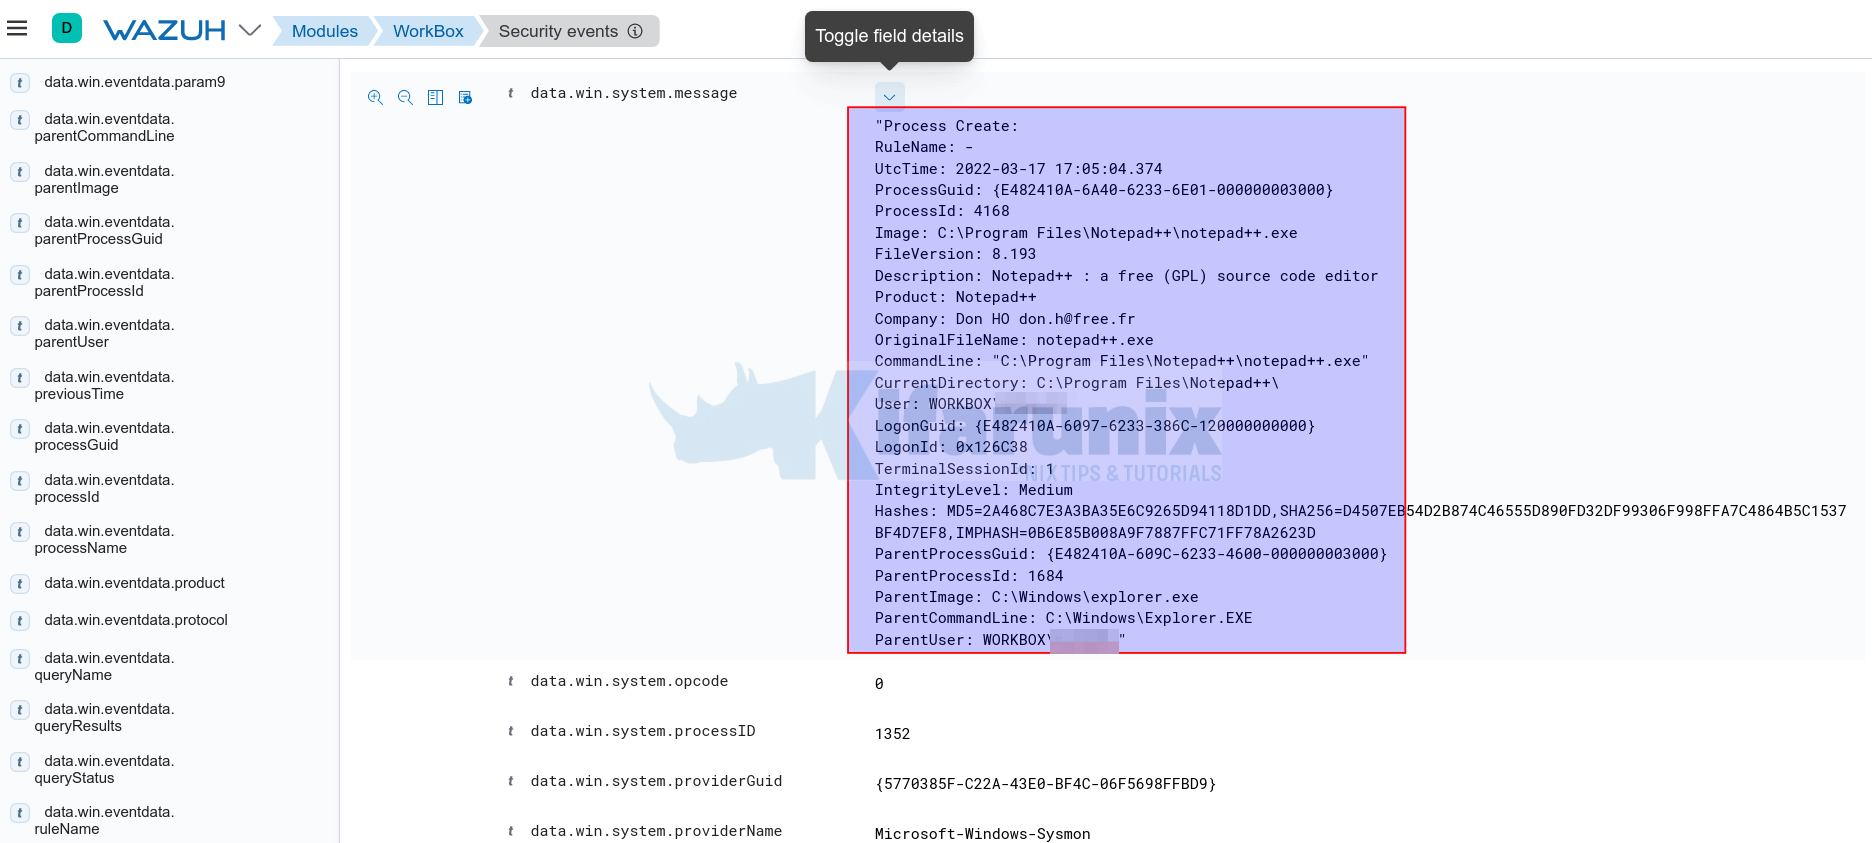
You can also detect the process created by launching a program from powershell. For example, you can launch Notepad++ from Powershell by running;
'C:\Program Files\Notepad++\notepad++.exe'The events will as well show up on the Kibana Wazuh app events dashboard;
You can compare the two events above.
Another example is to launch a program from powershell and pass the command line arguments. Example to open a file using Notepad++ from command line;
& 'C:\Program Files\Notepad++\notepad++.exe' 'C:\Program Files (x86)\ossec-agent\ossec.conf'Sample events;
And there you go. That is how you can easily use Wazuh manager to monitor process creation events on Windows systems.
Reference
Other Tutorials
Monitor Changes to Critical Files on Windows Systems using Wazuh and ELK

