In this tutorial, you will learn how to install latest Grafana on Debian 10. Grafana is an open source analytics and monitoring solution that enables you to query, visualize and alert on various systems metrics that can be pulled from various time series databases such as Graphite, InfluxDB & Prometheus etc.
Installing Grafana on Debian 10
There are various methods in which you can install Grafana. These include;
- Install from Official Grafana APT repository
- Install by downloading a
.debpackage - Install by downloading a binary
.tar.gzfile
Install Grafana from Official Grafana APT repository
In this tutorial, we will discuss how to install Grafana from the Official Grafana APT repository. This is the surest way to ensure that you are running the latest Grafana on Debian 10.
Install Grafana Stable Release Repository
Run the command below to install Grafana stable release repository;
echo "deb https://packages.grafana.com/oss/deb stable main" > /etc/apt/sources.list.d/grafana.listInstall the Grafana repository signing key;
wget -q -O - https://packages.grafana.com/gpg.key | sudo apt-key add -Run system package cache update;
apt updateInstall Grafana;
apt install grafanaWhen installed, Grafana package;
- Installs binary to
/usr/sbin/grafana-server - Installs Init.d script to
/etc/init.d/grafana-server - Creates default file (environment vars) to
/etc/default/grafana-server - Installs configuration file to
/etc/grafana/grafana.ini - Installs systemd service (if systemd is available) name
grafana-server.service - The default configuration sets the log file at
/var/log/grafana/grafana.log - The default configuration specifies a SQLite3 db at
/var/lib/grafana/grafana.db - Installs HTML/JS/CSS and other Grafana files at
/usr/share/grafana
Running Grafana on Debian 10
On systems with systemd init system, Grafana creates a systemd service, grafana-server.service.
In order to start Grafana on Debian 10, you first need to reload systemd daemon configurations;
systemctl daemon-reloadNext, you can start and enable Grafana service to run on system boot using the command below;
systemctl enable --now grafana-serverChecking the status;
systemctl status grafana-server.service● grafana-server.service - Grafana instance
Loaded: loaded (/lib/systemd/system/grafana-server.service; enabled; vendor preset: enabled)
Active: active (running) since Sat 2021-04-03 02:58:17 EDT; 22s ago
Docs: http://docs.grafana.org
Main PID: 2025 (grafana-server)
Tasks: 6 (limit: 2359)
Memory: 17.4M
CGroup: /system.slice/grafana-server.service
└─2025 /usr/sbin/grafana-server --config=/etc/grafana/grafana.ini --pidfile=/var/run/grafana/grafana-server.pid --packaging=deb cfg:default.paths.logs=/var/log/g
Apr 03 02:58:39 debian grafana-server[2025]: t=2021-04-03T02:58:39-0400 lvl=info msg="Executing migration" logger=migrator id="create playlist table v2"
Apr 03 02:58:39 debian grafana-server[2025]: t=2021-04-03T02:58:39-0400 lvl=info msg="Executing migration" logger=migrator id="create playlist item table v2"
...Accessing Grafana Web Interface
Grafana listens on port 3000/tcp on all interfaces by default;
ss -atlnp | grep 3000LISTEN 0 128 *:3000 *:* users:(("grafana-server",pid=2025,fd=11))To be able to access it externally, you need to open this port on Firewall, if at all is running. Otherwise, just navigate to the browser and use the address http://<server-IP>:3000 to access your Grafana interface.
The default login credentials:
- Username:
admin - Password:
admin

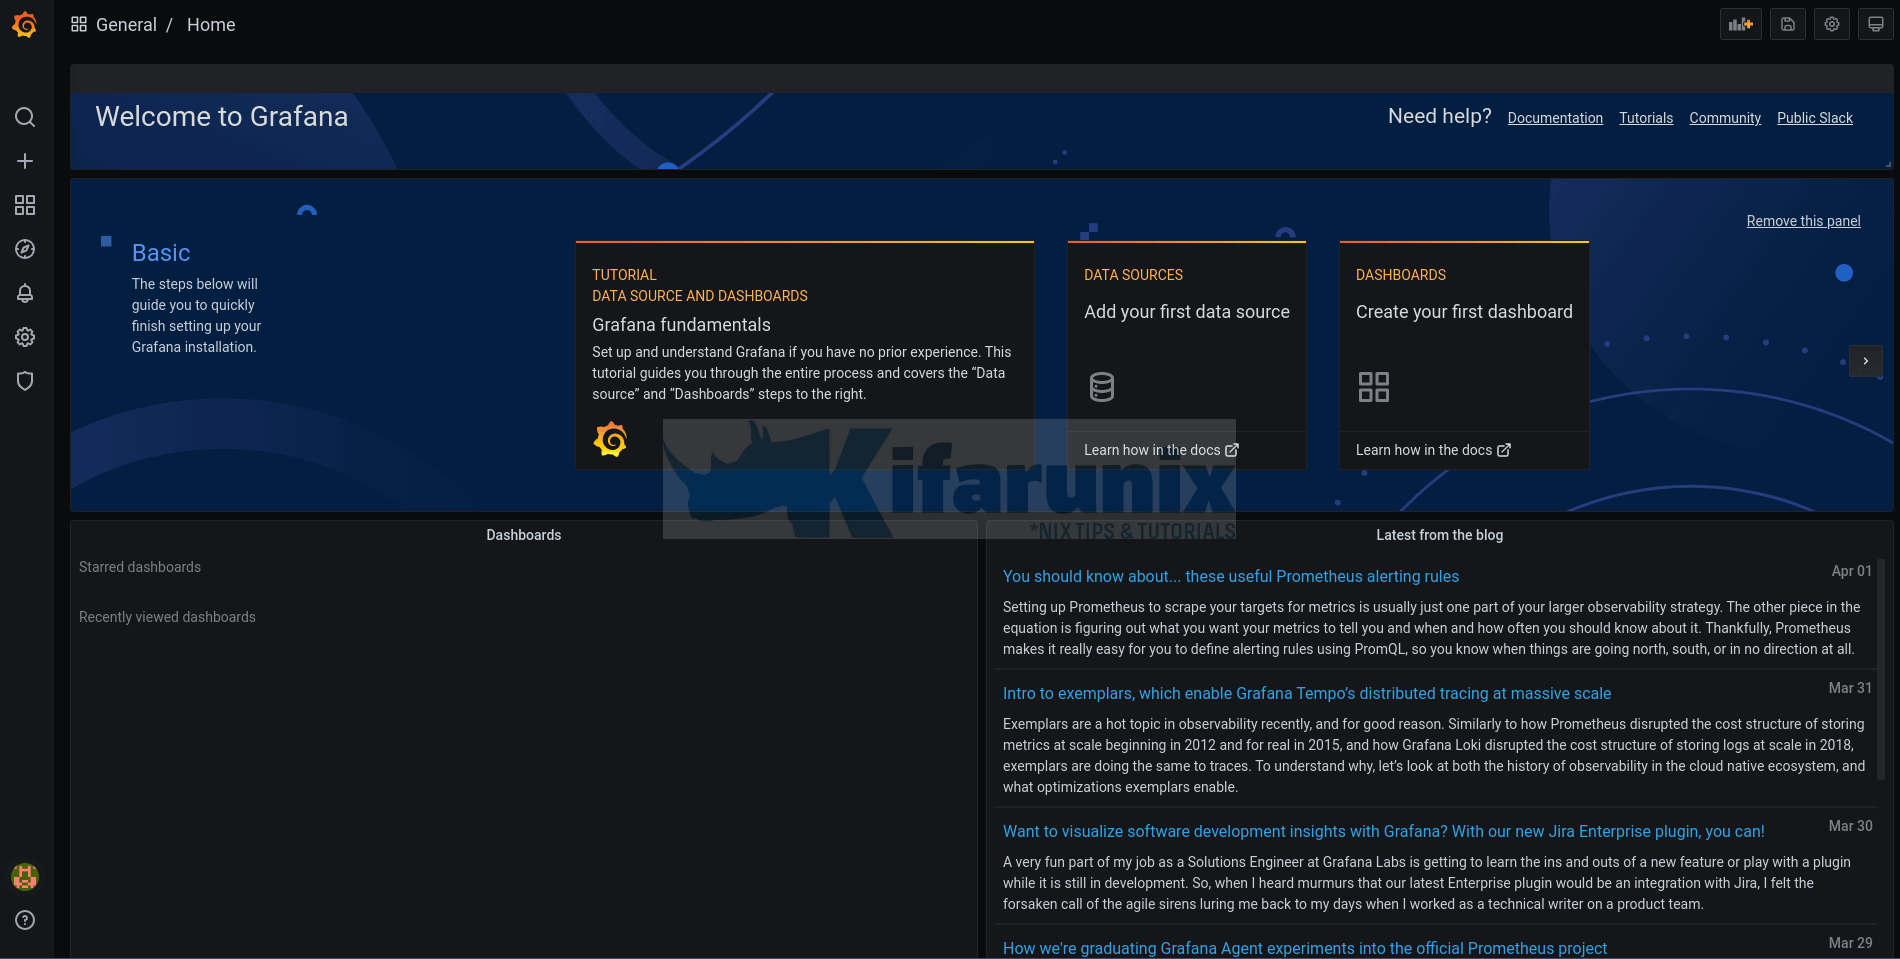
When logged in with the default credentials, you will be prompted to change the password. Do so and proceed to Grafana web interface.

Reference
Other Tutorials
Integrate Prometheus with Grafana for Monitoring

