In this tutorial, we will learn about monitoring Gitlab metrics with Prometheus and Grafana. Grafana is a data visualization and monitoring tool and supports time series datastores such as Graphite, InfluxDB, Prometheus, Elasticsearch. Prometheus is a powerful time-series monitoring service, providing a flexible platform for monitoring GitLab and other software products. GitLab provides out of the box monitoring with Prometheus, providing easy access to high quality time-series monitoring of GitLab services. Grafana can be used to achieve better visualization of the metrics collected by the Prometheus.
Want more Grafana and Prometheus? Check the links below;
Prometheus: Up & Running: Infrastructure and Application Performance Monitoring
Using Prometheus and Grafana to Monitor Gitlab Metrics
Before you can proceed, we assume you have a Gitlab server up and running. However, you can follow the link below to install and setup Gitlab server on an Ubuntu 20.04 system;
Install Gitlab with SSL/TLS Certificate on Ubuntu 20.04
By default, Omnibus Gitlab installations comes bundled with Grafana and Prometheus. To confirm this, simply check the status of Gitlab services;
gitlab-ctl statusrun: alertmanager: (pid 4248) 22043s; run: log: (pid 4158) 22046s
run: gitaly: (pid 4273) 22042s; run: log: (pid 4147) 22046s
run: gitlab-exporter: (pid 4285) 22042s; run: log: (pid 4151) 22046s
run: gitlab-workhorse: (pid 4297) 22042s; run: log: (pid 4157) 22046s
run: grafana: (pid 96055) 13581s; run: log: (pid 4152) 22046s
run: logrotate: (pid 190276) 422s; run: log: (pid 4156) 22046s
run: nginx: (pid 96045) 13583s; run: log: (pid 4155) 22047s
run: node-exporter: (pid 4352) 22041s; run: log: (pid 4148) 22047s
run: postgres-exporter: (pid 4384) 22041s; run: log: (pid 4159) 22047s
run: postgresql: (pid 4425) 22038s; run: log: (pid 4149) 22047s
run: prometheus: (pid 78644) 15085s; run: log: (pid 4160) 22047s
run: puma: (pid 95895) 13594s; run: log: (pid 4150) 22047s
run: redis: (pid 4469) 22036s; run: log: (pid 4153) 22047s
run: redis-exporter: (pid 4477) 22036s; run: log: (pid 4161) 22047s
run: sidekiq: (pid 95784) 13602s; run: log: (pid 4154) 22047s
As you can see, we have Grafana and Prometheus services up and running. Similarly, you can see that we have various exporters such as node-exporter, gitlab-exporter for collecting host and Gitlab performance metrics.
You can check the status of the individual service as follows;
gitlab-ctl status prometheusgitlab-ctl status grafanaConfiguring Prometheus on Gitlab Server
By default, Prometheus is configured to be locally accessible from the Gitlab server itself. If you want to be able to access Prometheus externally, edit the configuration file and adjust the lines below accordingly.
vim /etc/gitlab/gitlab.rb##! Advanced settings. Should be changed only if absolutely needed.
#prometheus['listen_address'] = 'localhost:9090'
prometheus['listen_address'] = '192.168.57.3:9090'
#
...You can replace localhost with a FQDN or an IP address.
If you do not want to allow external access to Gitlab Prometheus, then you can skip the above.
Once you have made the changes, be sure to reconfigure Gitlab services for the changes to take effect;
gitlab-ctl reconfigure...
Recipe: gitlab::gitlab-rails
* execute[clear the gitlab-rails cache] action run
- execute /opt/gitlab/bin/gitlab-rake cache:clear
Recipe: monitoring::prometheus
* execute[reload prometheus] action run
- execute /opt/gitlab/bin/gitlab-ctl hup prometheus
Running handlers:
Running handlers complete
Chef Infra Client finished, 9/811 resources updated in 01 minutes 09 seconds
gitlab Reconfigured!
Viewing Gitlab Performance Metrics on Prometheus
You can access Prometheus dashboard, either locally or externally depending on your setup. In my case, we have configured Prometheus for external access.
To allow external access, ensure that port 9090/tcp is opened on firewall if firewall is running.
Ubuntu systems and the likes;
ufw allow 9090/tcpCentOS systems and the likes;
firewall-cmd --add-port=9090/tcp --permanent
firewall-cmd --reload
Then navigate to the Prometheus dashboard locally, (http://localhost:9090) or externally (http://fqdn-or-IP:9090).
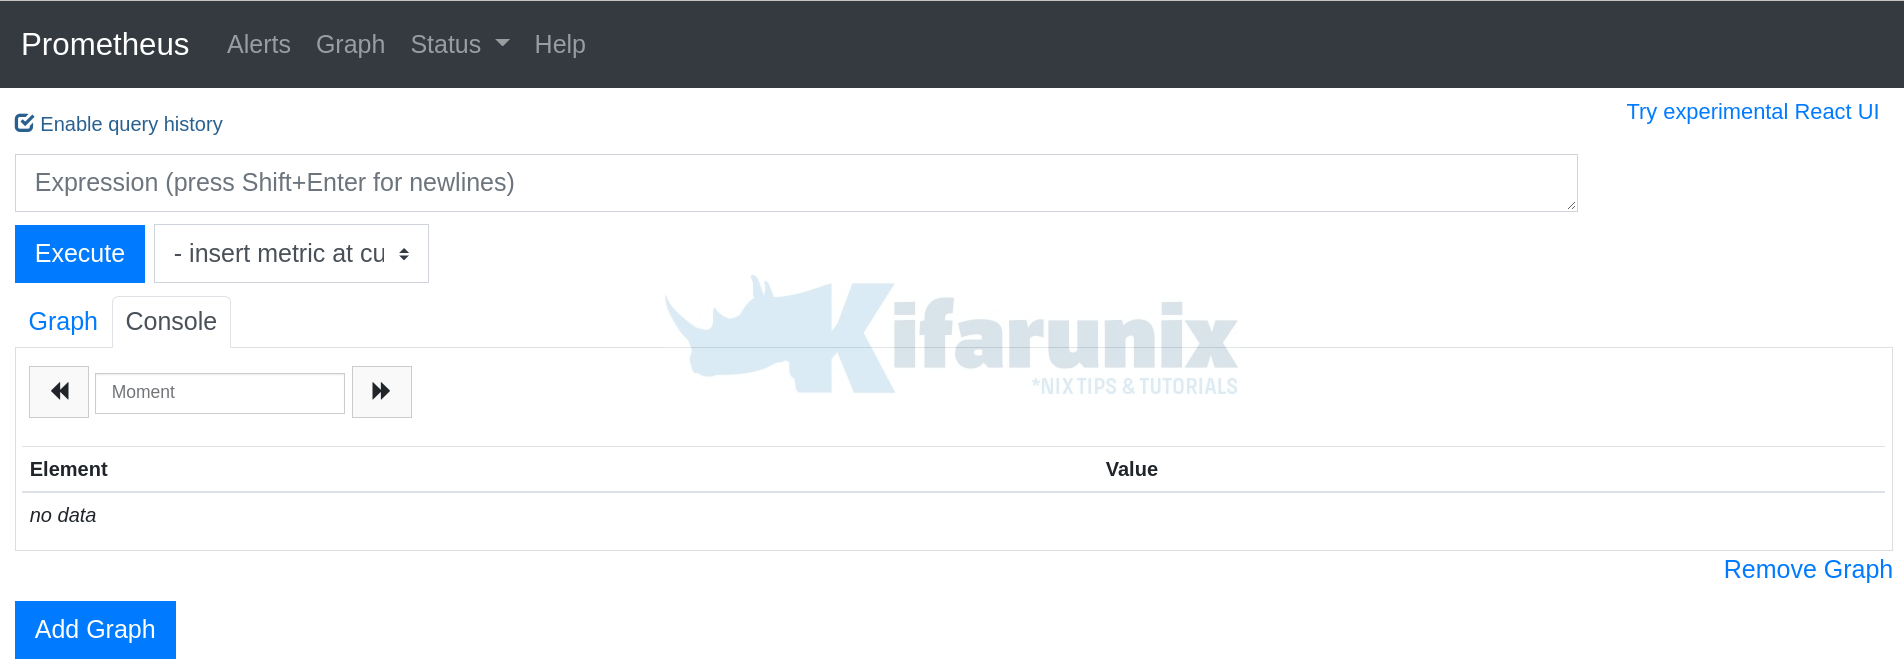
There are a sample Prometheus dashboard queries you have been provided with on Gitlab documentation page;
- % Memory available:
((node_memory_MemAvailable_bytes / node_memory_MemTotal_bytes) or ((node_memory_MemFree_bytes + node_memory_Buffers_bytes + node_memory_Cached_bytes) / node_memory_MemTotal_bytes)) * 100 - % CPU utilization:
1 - avg without (mode,cpu) (rate(node_cpu_seconds_total{mode="idle"}[5m])) - Data transmitted:
rate(node_network_transmit_bytes_total{device!="lo"}[5m]) - Data received:
rate(node_network_receive_bytes_total{device!="lo"}[5m])
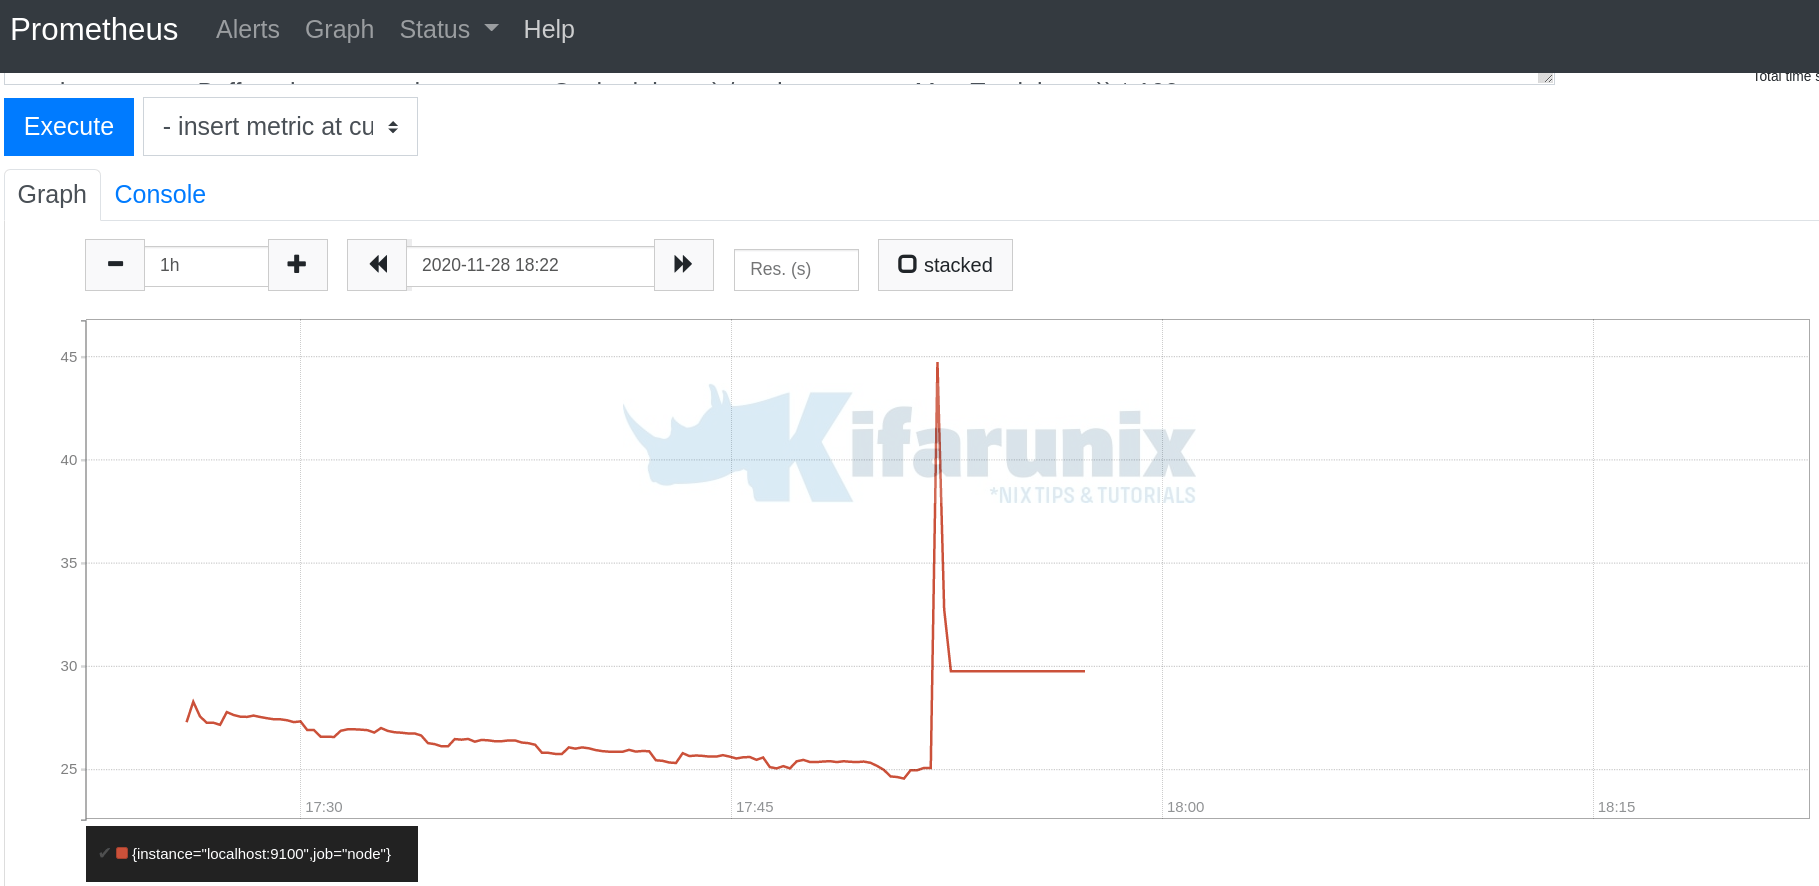
You can execute and view the report on Prometheus dashboard. For example, let us execute the memory utilization query (Percentage memory available on the system) above. You should get such sample console values and graph as shown in the screenshots below;
The Console

The Graph
You can read more about Prometheus Queries.
Monitor Gitlab Metrics with Prometheus and Grafana
As you can see above, we got the metrics yes, but the visualization is not up to the par, -:).
We want to feel the goodness of Grafana visualization. Note that, in this setup, we are utilizing the Grafana that comes bundled with Gitlab server itself.
Enable Grafana Login using username and password
By default, the Grafana is enabled and single sign on with Gitlab is automatically enabled as well. However in this setup, we enable login using username and password.
Authentication to Grafana using username/password is disabled by default. Hence, open the configuration file and navigate to Grafana Dashboards section and enable username/password authentication by uncommenting the line, grafana['disable_login_form'] = false.
vim /etc/gitlab/gitlab.rb...
################################################################################
## Grafana Dashboards
##! Docs: https://docs.gitlab.com/ee/administration/monitoring/prometheus/#prometheus-as-a-grafana-data-source
################################################################################
#grafana['enable'] = true
# grafana['log_directory'] = '/var/log/gitlab/grafana'
# grafana['home'] = '/var/opt/gitlab/grafana'
# grafana['admin_password'] = 'admin'
# grafana['allow_user_sign_up'] = false
# grafana['basic_auth_enabled'] = false
grafana['disable_login_form'] = false
Save and exit the file.
Reconfigure Gitlab to effect the changes;
gitlab-ctl reconfigureAccessing Gitlab Grafana Dashboard
Once you have enabled username/password authentication, navigate to the Gitlab Grafana URL, http://FQDN-or-IP/-/grafana.

The username for logging in is admin. For the password, you can reset it by running the command below;
gitlab-ctl set-grafana-passwordThen login to Grafana. Upon successful login, you are welcomed into Grafana dashboard.
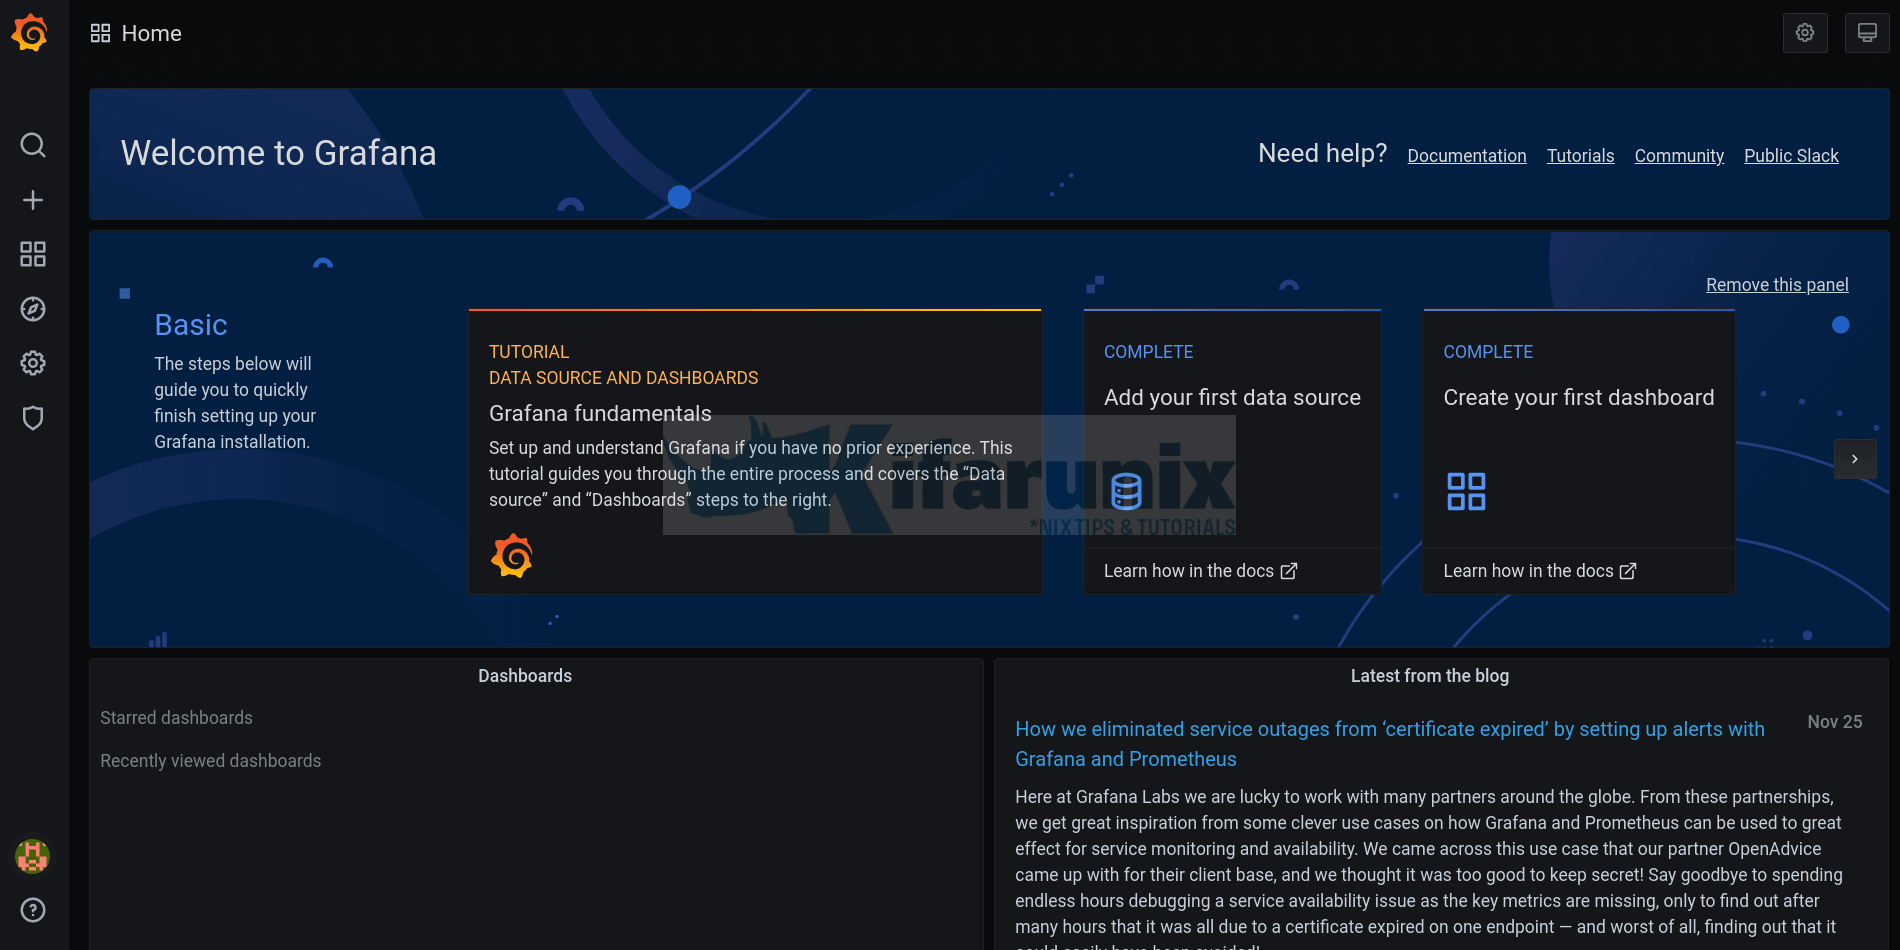
Add Prometheus Datasource to Grafana
In order for Grafana to collect metrics from Prometheus and provide visualizations, you need to add Prometheus datasource. By default, you will find that Prometheus datasource has been added automatically. You can check by navigating to Configuration > Datasources.

However, if you need to add a new datasource;
- Navigate to Configuration > Datasources > Add data source.
- From the data source types, select Prometheus. This opens up Prometheus datasource configuration page.
- Enter the Prometheus server URL. If you are running Grafana and Prometheus on the same server, use the address http://localhost:9090 otherwise, use the address http://<prometheus-server-IP>:9090.
- After that, click Save & Test.
Import Gitlab Grafana Dashboards
Similarly, there are some default dashboards that the Prometheus datasource ships with. If you navigate to Configuration > Datasources > click on Gitlab Omnibus datasource > Dashboards. Click Import to import the dashboard. The button changes to Re-import after importing.

Viewing Gitlab Grafana Dashboards
Once you have imported the dashboards, you can now view them. Click the search button and select the dashboard you want to view its visualizations. For example, let us view the Prometheus 2.0 stats dashboard.
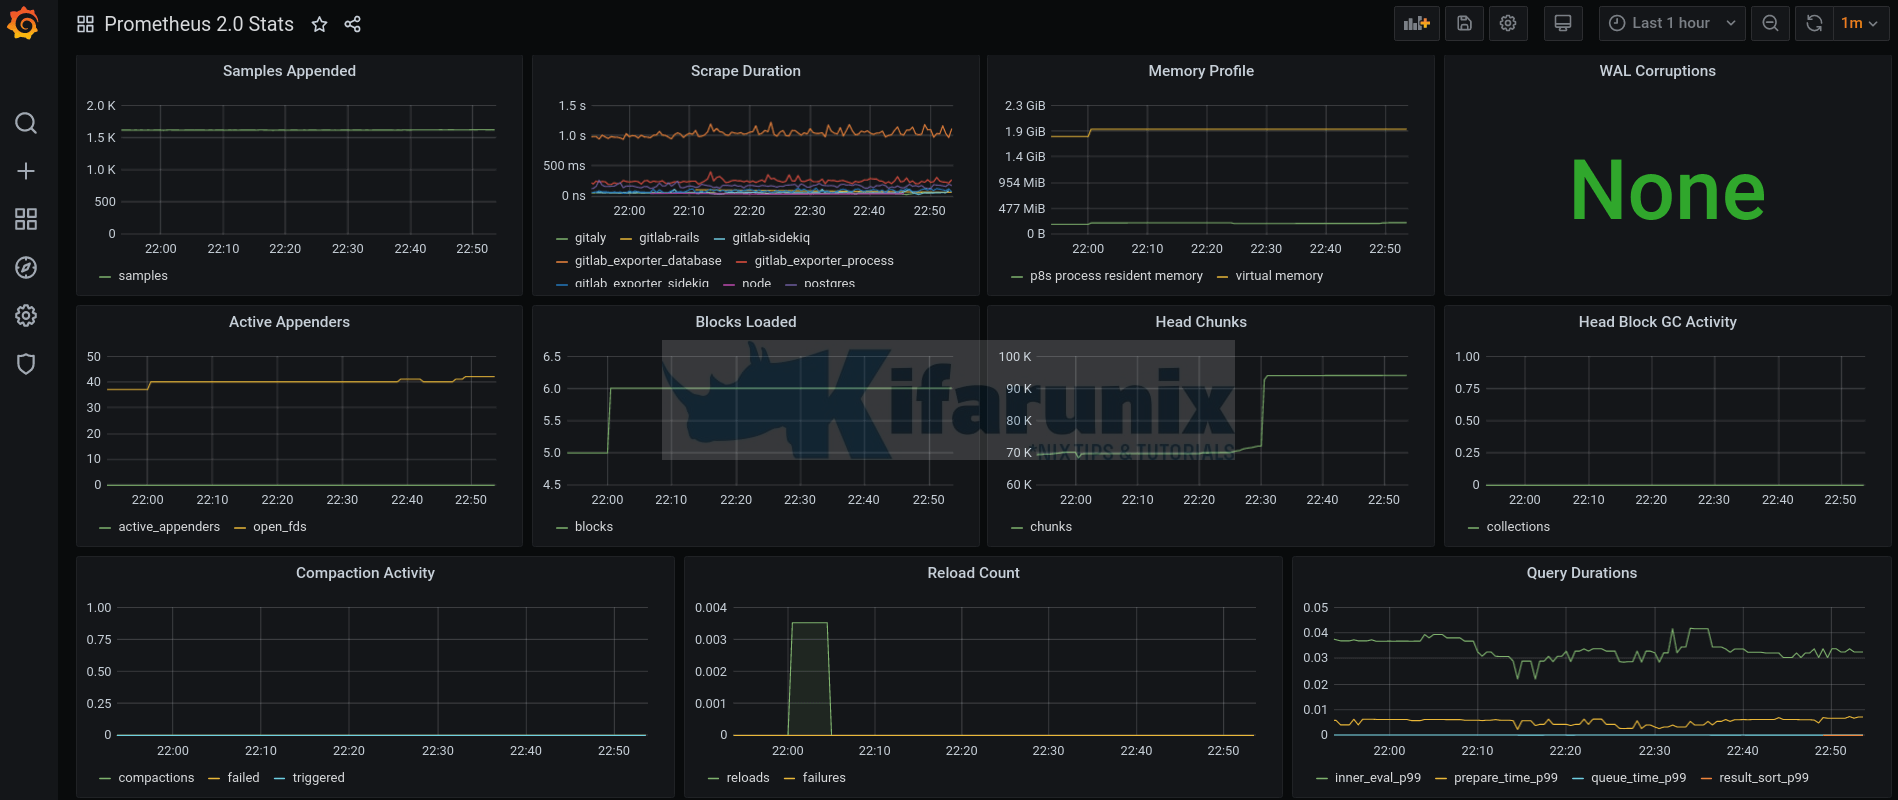
Similarly, you can monitor the Gitlab server system metrics such as cpu usage, RAM, disk I/O e.t.c. See the dashboard below;
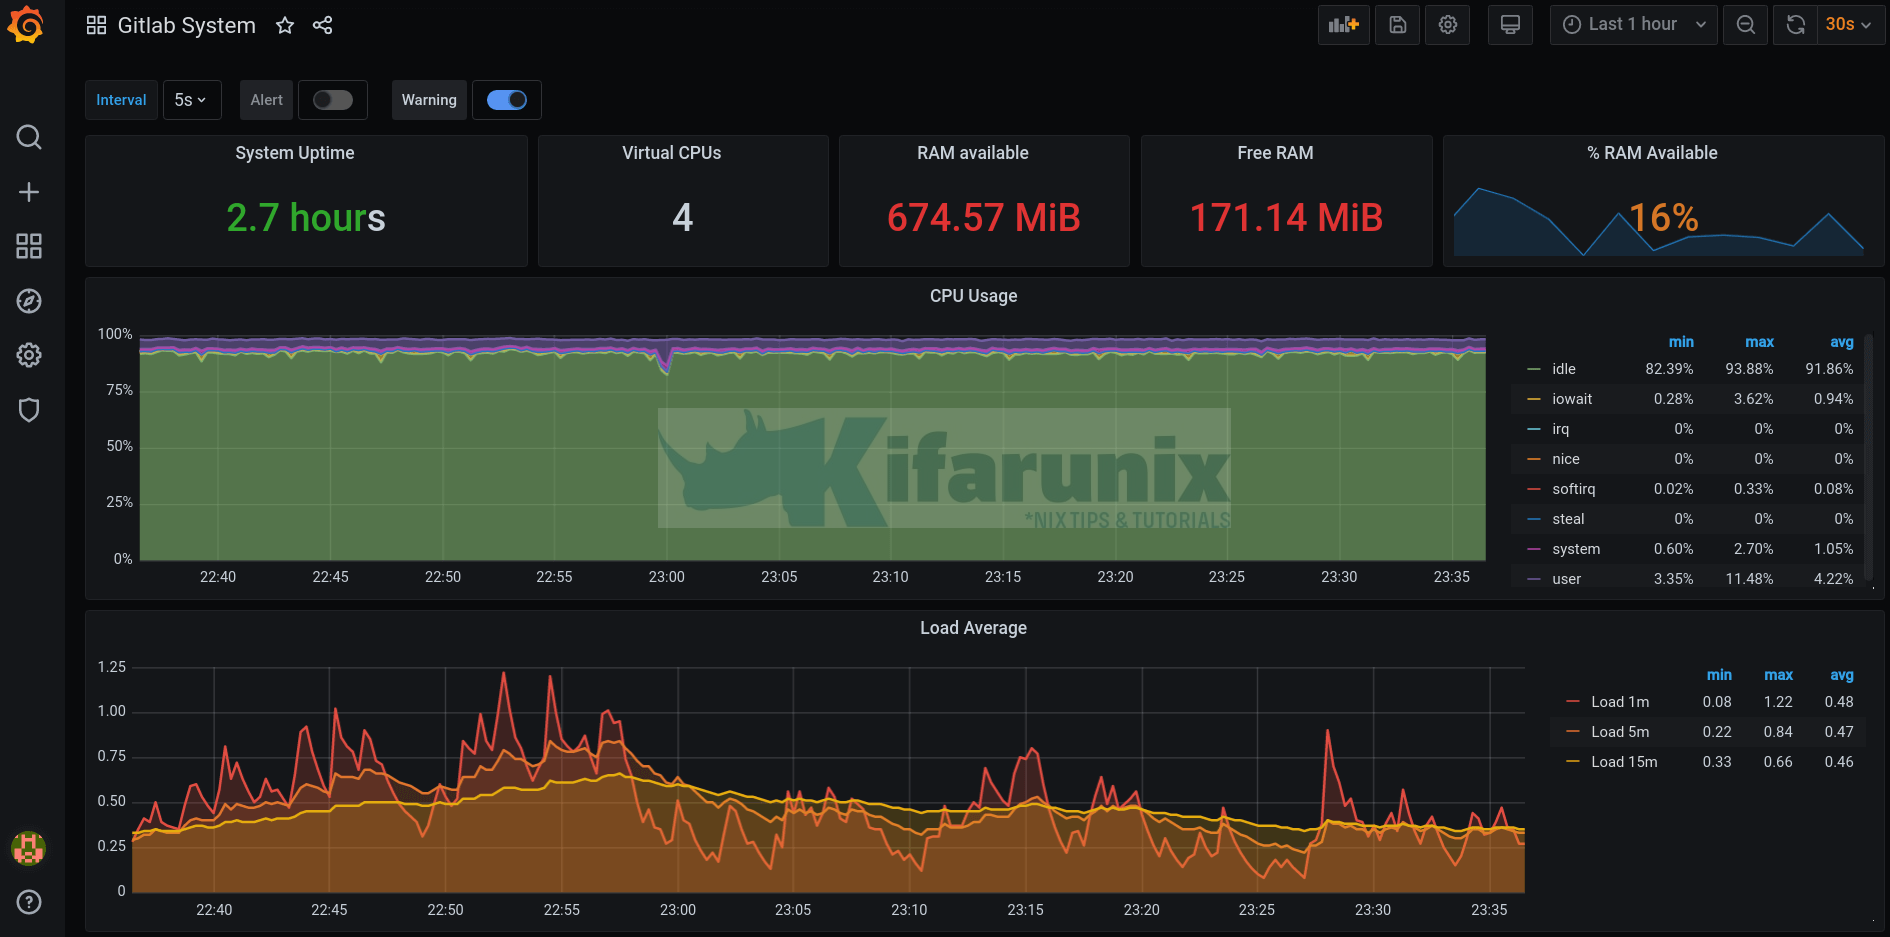
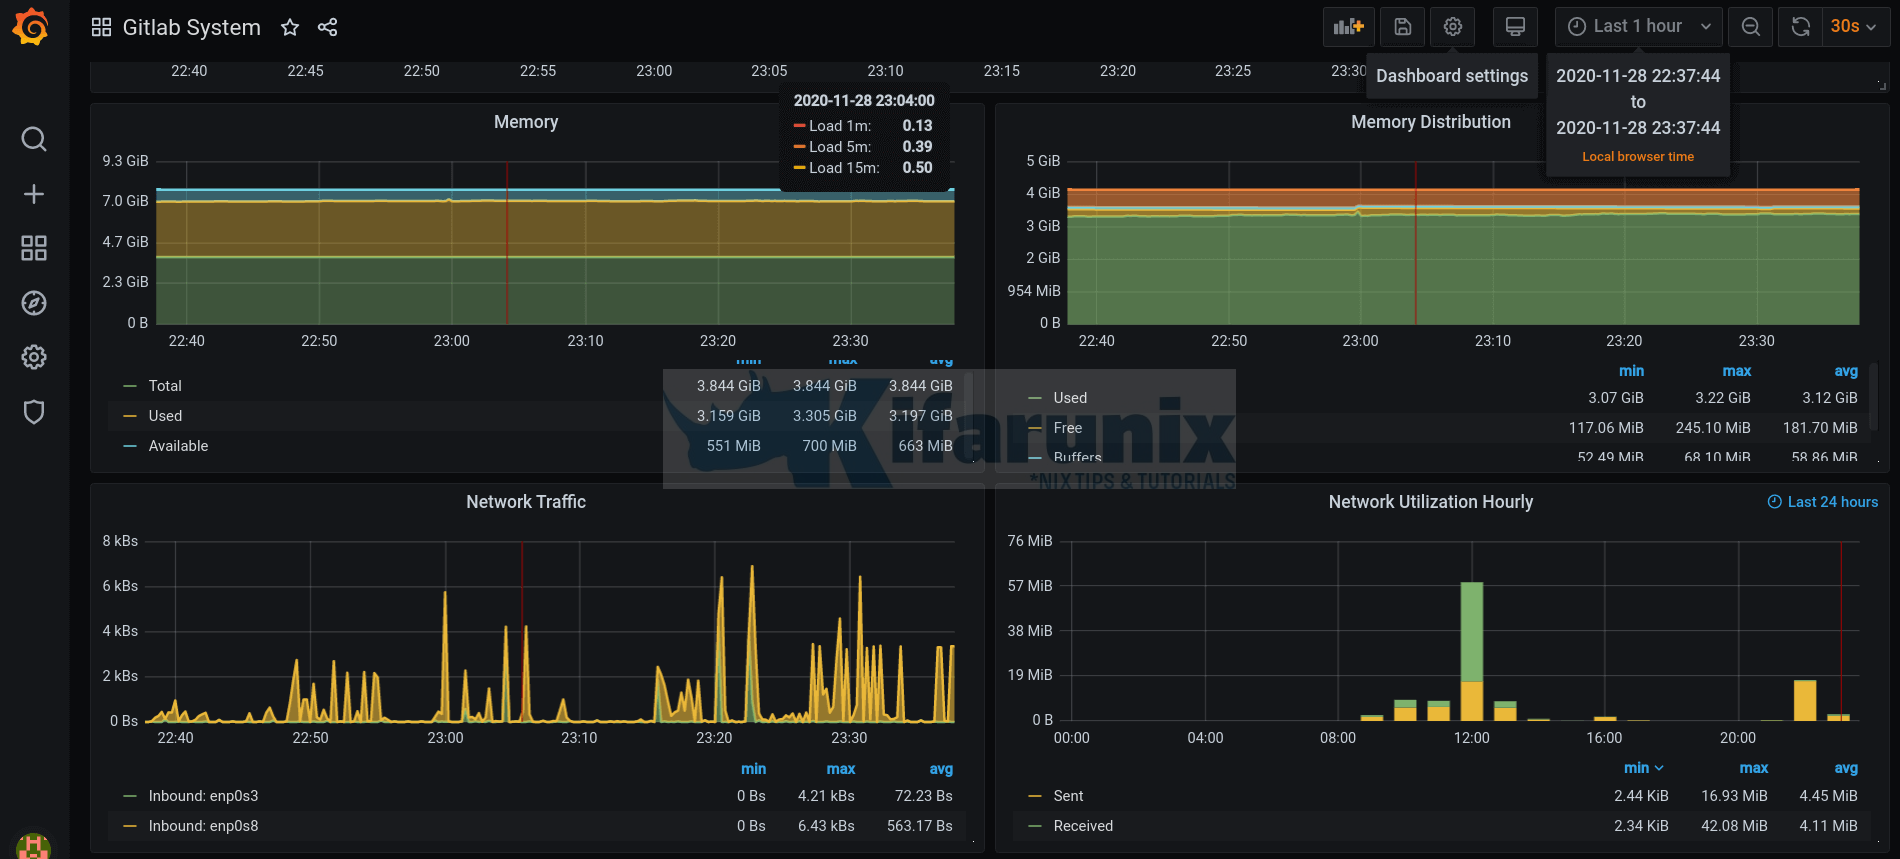
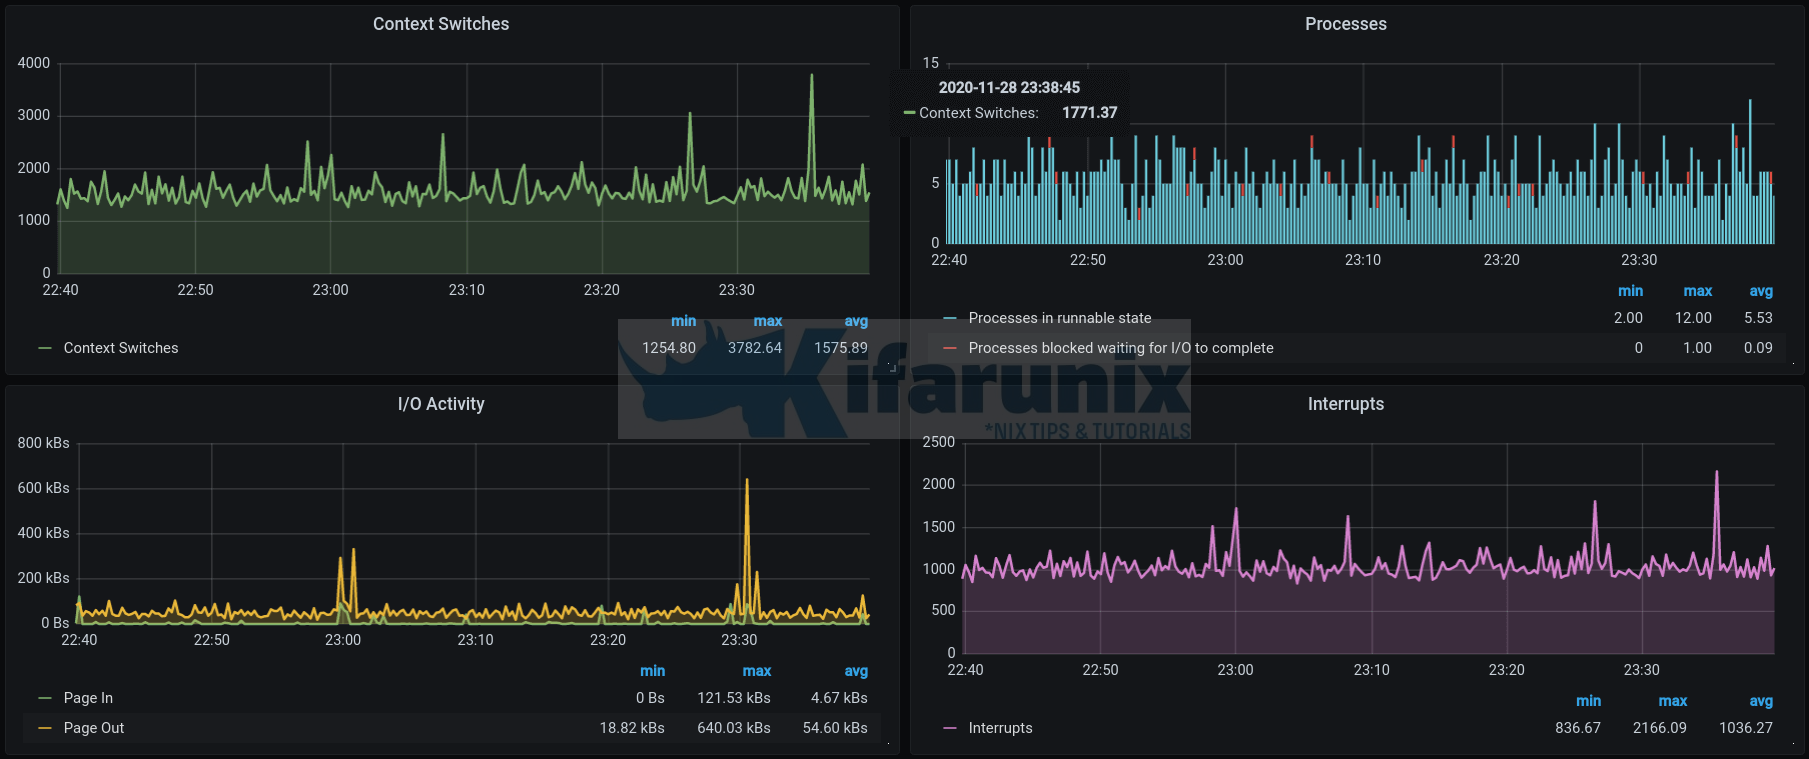
For the above dashboards, below is a modified json configuration file (modified version of Gitlab system dashboard for Grafana).
{
"annotations": {
"list": [
{
"builtIn": 1,
"datasource": "-- Grafana --",
"enable": true,
"hide": true,
"iconColor": "rgba(0, 211, 255, 1)",
"name": "Annotations & Alerts",
"type": "dashboard"
},
{
"datasource": "GitLab Omnibus",
"enable": false,
"expr": "ALERTS{alias=\"$host\", alertstate=\"firing\"}",
"iconColor": "rgb(252, 5, 0)",
"name": "Alert",
"tagKeys": "severity",
"textFormat": "{{ alias }} : {{alertstate}}",
"titleFormat": "{{ alertname }}"
},
{
"datasource": "GitLab Omnibus",
"enable": true,
"expr": "ALERTS{alias=\"$host\",alertstate=\"pending\"}",
"iconColor": "rgb(228, 242, 9)",
"name": "Warning",
"tagKeys": "severity",
"textFormat": "{{ alias }} : {{ alertstate }}",
"titleFormat": "{{ alertname }}"
}
]
},
"description": "GitLab Prometheus for system metrics. \r\nLoad, CPU, RAM, network, process ... ",
"editable": true,
"gnetId": 7697,
"graphTooltip": 1,
"id": 17,
"iteration": 1606596413793,
"links": [],
"panels": [
{
"cacheTimeout": null,
"colorBackground": false,
"colorValue": true,
"colors": [
"rgba(245, 54, 54, 0.9)",
"rgba(237, 129, 40, 0.89)",
"rgba(50, 172, 45, 0.97)"
],
"datasource": "GitLab Omnibus",
"decimals": 1,
"editable": true,
"error": false,
"fieldConfig": {
"defaults": {
"custom": {}
},
"overrides": []
},
"format": "s",
"gauge": {
"maxValue": 100,
"minValue": 0,
"show": false,
"thresholdLabels": false,
"thresholdMarkers": true
},
"height": "50px",
"id": 19,
"interval": null,
"links": [],
"mappingType": 1,
"mappingTypes": [
{
"name": "value to text",
"value": 1
},
{
"name": "range to text",
"value": 2
}
],
"maxDataPoints": 100,
"nullPointMode": "connected",
"nullText": null,
"postfix": "s",
"postfixFontSize": "80%",
"prefix": "",
"prefixFontSize": "80%",
"rangeMaps": [
{
"from": "null",
"text": "N/A",
"to": "null"
}
],
"sparkline": {
"fillColor": "rgba(31, 118, 189, 0.18)",
"full": false,
"lineColor": "rgb(31, 120, 193)",
"show": false
},
"tableColumn": "{instance=\"192.168.57.3:9090\", job=\"prometheus\"}",
"targets": [
{
"calculatedInterval": "10m",
"datasourceErrors": {},
"errors": {},
"expr": "(time() - process_start_time_seconds{job=\"prometheus\"})",
"format": "time_series",
"interval": "5m",
"intervalFactor": 1,
"legendFormat": "",
"metric": "",
"prometheusLink": "/api/datasources/proxy/1/graph#%5B%7B%22expr%22%3A%22node_time%7Balias%3D%5C%22%24host%5C%22%7D%20-%20node_boot_time%7Balias%3D%5C%22%24host%5C%22%7D%22%2C%22range_input%22%3A%2243200s%22%2C%22end_input%22%3A%222015-9-18%2013%3A25%22%2C%22step_input%22%3A%22%22%2C%22tab%22%3A0%7D%5D",
"refId": "A",
"step": 300
}
],
"thresholds": "300,3600",
"title": "System Uptime",
"type": "singlestat",
"valueFontSize": "80%",
"valueMaps": [],
"valueName": "current"
},
{
"cacheTimeout": null,
"colorBackground": false,
"colorValue": false,
"colors": [
"rgba(245, 54, 54, 0.9)",
"rgba(237, 129, 40, 0.89)",
"rgba(50, 172, 45, 0.97)"
],
"datasource": "GitLab Omnibus",
"editable": true,
"error": false,
"fieldConfig": {
"defaults": {
"custom": {}
},
"overrides": []
},
"format": "none",
"gauge": {
"maxValue": 100,
"minValue": 0,
"show": false,
"thresholdLabels": false,
"thresholdMarkers": true
},
"gridPos": {
"h": 3,
"w": 4,
"x": 6,
"y": 0
},
"height": "55px",
"id": 25,
"interval": null,
"links": [],
"mappingType": 1,
"mappingTypes": [
{
"name": "value to text",
"value": 1
},
{
"name": "range to text",
"value": 2
}
],
"maxDataPoints": 100,
"nullPointMode": "connected",
"nullText": null,
"postfix": "",
"postfixFontSize": "50%",
"prefix": "",
"prefixFontSize": "80%",
"rangeMaps": [
{
"from": "null",
"text": "N/A",
"to": "null"
}
],
"sparkline": {
"fillColor": "rgba(31, 118, 189, 0.18)",
"full": false,
"lineColor": "rgb(31, 120, 193)",
"show": false
},
"tableColumn": "instance:node_cpus:count{instance=\"localhost:9100\", job=\"node\"}",
"targets": [
{
"expr": "instance:node_cpus:count{instance=\"localhost:9100\",job=\"node\"}",
"format": "time_series",
"interval": "5m",
"intervalFactor": 1,
"legendFormat": "",
"refId": "A",
"step": 300
}
],
"thresholds": "",
"title": "Virtual CPUs",
"type": "singlestat",
"valueFontSize": "80%",
"valueMaps": [
{
"op": "=",
"text": "N/A",
"value": "null"
}
],
"valueName": "current"
},
{
"cacheTimeout": null,
"colorBackground": false,
"colorValue": true,
"colors": [
"rgba(245, 54, 54, 0.9)",
"rgba(237, 129, 40, 0.89)",
"rgba(50, 172, 45, 0.97)"
],
"datasource": "GitLab Omnibus",
"decimals": 2,
"editable": true,
"error": false,
"fieldConfig": {
"defaults": {
"custom": {}
},
"overrides": []
},
"format": "bytes",
"gauge": {
"maxValue": 100,
"minValue": 0,
"show": false,
"thresholdLabels": false,
"thresholdMarkers": true
},
"gridPos": {
"h": 3,
"w": 4,
"x": 10,
"y": 0
},
"height": "55px",
"id": 26,
"interval": null,
"links": [],
"mappingType": 1,
"mappingTypes": [
{
"name": "value to text",
"value": 1
},
{
"name": "range to text",
"value": 2
}
],
"maxDataPoints": 100,
"nullPointMode": "connected",
"nullText": null,
"postfix": "",
"postfixFontSize": "50%",
"prefix": "",
"prefixFontSize": "80%",
"rangeMaps": [
{
"from": "null",
"text": "N/A",
"to": "null"
}
],
"sparkline": {
"fillColor": "rgba(31, 118, 189, 0.18)",
"full": false,
"lineColor": "rgb(31, 120, 193)",
"show": false
},
"tableColumn": "node_memory_MemAvailable_bytes{instance=\"localhost:9100\", job=\"node\"}",
"targets": [
{
"expr": "node_memory_MemAvailable_bytes{instance=\"localhost:9100\",job=\"node\"}",
"format": "time_series",
"interval": "",
"intervalFactor": 1,
"legendFormat": "",
"metric": "node_memory_MemAvailable",
"refId": "A",
"step": 30
}
],
"thresholds": "",
"title": "RAM available",
"type": "singlestat",
"valueFontSize": "80%",
"valueMaps": [
{
"op": "=",
"text": "N/A",
"value": "null"
}
],
"valueName": "current"
},
{
"cacheTimeout": null,
"colorBackground": false,
"colorValue": true,
"colors": [
"rgba(245, 54, 54, 0.9)",
"rgba(237, 129, 40, 0.89)",
"rgba(50, 172, 45, 0.97)"
],
"datasource": "GitLab Omnibus",
"decimals": 2,
"editable": true,
"error": false,
"fieldConfig": {
"defaults": {
"custom": {}
},
"overrides": []
},
"format": "bytes",
"gauge": {
"maxValue": 100,
"minValue": 0,
"show": false,
"thresholdLabels": false,
"thresholdMarkers": true
},
"gridPos": {
"h": 3,
"w": 4,
"x": 14,
"y": 0
},
"height": "55px",
"id": 34,
"interval": null,
"links": [],
"mappingType": 1,
"mappingTypes": [
{
"name": "value to text",
"value": 1
},
{
"name": "range to text",
"value": 2
}
],
"maxDataPoints": 100,
"nullPointMode": "connected",
"nullText": null,
"postfix": "",
"postfixFontSize": "50%",
"prefix": "",
"prefixFontSize": "80%",
"rangeMaps": [
{
"from": "null",
"text": "N/A",
"to": "null"
}
],
"sparkline": {
"fillColor": "rgba(31, 118, 189, 0.18)",
"full": false,
"lineColor": "rgb(31, 120, 193)",
"show": false
},
"tableColumn": "node_memory_MemFree_bytes{instance=\"localhost:9100\", job=\"node\"}",
"targets": [
{
"expr": "node_memory_MemFree_bytes{instance=\"localhost:9100\",job=\"node\"}",
"format": "time_series",
"interval": "",
"intervalFactor": 1,
"legendFormat": "",
"metric": "node_memory_MemAvailable",
"refId": "A",
"step": 30
}
],
"thresholds": "",
"title": "Free RAM",
"type": "singlestat",
"valueFontSize": "80%",
"valueMaps": [
{
"op": "=",
"text": "N/A",
"value": "null"
}
],
"valueName": "current"
},
{
"cacheTimeout": null,
"colorBackground": false,
"colorValue": true,
"colors": [
"rgba(245, 54, 54, 0.9)",
"rgba(237, 129, 40, 0.89)",
"rgba(50, 172, 45, 0.97)"
],
"datasource": "GitLab Omnibus",
"decimals": 0,
"editable": true,
"error": false,
"fieldConfig": {
"defaults": {
"custom": {}
},
"overrides": []
},
"format": "percent",
"gauge": {
"maxValue": 100,
"minValue": 0,
"show": false,
"thresholdLabels": false,
"thresholdMarkers": true
},
"gridPos": {
"h": 3,
"w": 6,
"x": 18,
"y": 0
},
"height": "50px",
"id": 9,
"interval": null,
"links": [],
"mappingType": 1,
"mappingTypes": [
{
"name": "value to text",
"value": 1
},
{
"name": "range to text",
"value": 2
}
],
"maxDataPoints": 100,
"nullPointMode": "connected",
"nullText": null,
"postfix": "",
"postfixFontSize": "50%",
"prefix": "",
"prefixFontSize": "80%",
"rangeMaps": [
{
"from": "null",
"text": "N/A",
"to": "null"
}
],
"sparkline": {
"fillColor": "rgba(31, 118, 189, 0.18)",
"full": true,
"lineColor": "rgb(31, 120, 193)",
"show": true
},
"tableColumn": "{instance=\"localhost:9100\", job=\"node\"}",
"targets": [
{
"calculatedInterval": "10m",
"datasourceErrors": {},
"errors": {},
"expr": "(node_memory_MemAvailable_bytes{instance=\"localhost:9100\",job=\"node\"} or (node_memory_MemFree_bytes{instance=\"localhost:9100\",job=\"node\"} + node_memory_Buffers_bytes{instance=\"localhost:9100\",job=\"node\"} + node_memory_Cached_bytes{instance=\"localhost:9100\",job=\"node\"})) / node_memory_MemTotal_bytes{instance=\"localhost:9100\",job=\"node\"} * 100",
"format": "time_series",
"interval": "5m",
"intervalFactor": 1,
"legendFormat": "",
"metric": "node_mem",
"prometheusLink": "/api/datasources/proxy/1/graph#%5B%7B%22expr%22%3A%22(node_memory_MemFree%7Balias%3D%5C%22%24host%5C%22%7D%20%2B%20node_memory_Buffers%7Balias%3D%5C%22%24host%5C%22%7D%20%2B%20node_memory_Cached%7Balias%3D%5C%22%24host%5C%22%7D)%20%2F%20node_memory_MemTotal%7Balias%3D%5C%22%24host%5C%22%7D%20*%20100%22%2C%22range_input%22%3A%2243201s%22%2C%22end_input%22%3A%222015-9-15%2013%3A54%22%2C%22step_input%22%3A%22%22%2C%22tab%22%3A0%7D%5D",
"refId": "A",
"step": 300
}
],
"thresholds": "10,50",
"title": "% RAM Available",
"type": "singlestat",
"valueFontSize": "80%",
"valueMaps": [],
"valueName": "current"
},
{
"aliasColors": {},
"bars": false,
"dashLength": 10,
"dashes": false,
"datasource": "GitLab Omnibus",
"decimals": 2,
"editable": true,
"error": false,
"fieldConfig": {
"defaults": {
"custom": {}
},
"overrides": []
},
"fill": 6,
"fillGradient": 0,
"grid": {},
"gridPos": {
"h": 7,
"w": 24,
"x": 0,
"y": 3
},
"height": "260px",
"hiddenSeries": false,
"id": 2,
"legend": {
"alignAsTable": true,
"avg": true,
"current": false,
"hideEmpty": false,
"max": true,
"min": true,
"rightSide": true,
"show": true,
"total": false,
"values": true
},
"lines": true,
"linewidth": 2,
"links": [],
"nullPointMode": "null",
"options": {
"dataLinks": []
},
"percentage": false,
"pointradius": 5,
"points": false,
"renderer": "flot",
"seriesOverrides": [],
"spaceLength": 10,
"stack": true,
"steppedLine": false,
"targets": [
{
"calculatedInterval": "2s",
"datasourceErrors": {},
"errors": {},
"expr": "sum(rate(node_cpu_seconds_total{instance='localhost:9100',job='node'}[$interval])) by (mode) * 100 / count(node_cpu{instance='localhost:9100',job='node'}) by (mode) or sum(irate(node_cpu_seconds_total{instance='localhost:9100',job='node'}[5m])) by (mode) * 100 / count(node_cpu_seconds_total{instance='localhost:9100',job='node'}) by (mode)",
"format": "time_series",
"interval": "",
"intervalFactor": 1,
"legendFormat": "{{ mode }}",
"metric": "",
"prometheusLink": "/api/datasources/proxy/1/graph#%5B%7B%22expr%22%3A%22sum(rate(node_cpu%7Balias%3D%5C%22%24host%5C%22%7D%5B%24interval%5D))%20by%20(mode)%20*%20100%22%2C%22range_input%22%3A%223600s%22%2C%22end_input%22%3A%222015-10-22%2015%3A27%22%2C%22step_input%22%3A%22%22%2C%22stacked%22%3Atrue%2C%22tab%22%3A0%7D%5D",
"refId": "A",
"step": 2
}
],
"thresholds": [],
"timeFrom": null,
"timeRegions": [],
"timeShift": null,
"title": "CPU Usage",
"tooltip": {
"msResolution": false,
"shared": true,
"sort": 0,
"value_type": "individual"
},
"type": "graph",
"xaxis": {
"buckets": null,
"mode": "time",
"name": null,
"show": true,
"values": []
},
"yaxes": [
{
"format": "percent",
"label": "",
"logBase": 1,
"max": 100,
"min": 0,
"show": true
},
{
"format": "short",
"logBase": 1,
"max": null,
"min": 0,
"show": true
}
],
"yaxis": {
"align": false,
"alignLevel": null
}
},
{
"aliasColors": {},
"bars": false,
"dashLength": 10,
"dashes": false,
"datasource": "GitLab Omnibus",
"decimals": 2,
"editable": true,
"error": false,
"fieldConfig": {
"defaults": {
"custom": {}
},
"overrides": []
},
"fill": 2,
"fillGradient": 0,
"grid": {},
"gridPos": {
"h": 7,
"w": 24,
"x": 0,
"y": 10
},
"hiddenSeries": false,
"id": 18,
"legend": {
"alignAsTable": true,
"avg": true,
"current": false,
"hideEmpty": false,
"max": true,
"min": true,
"rightSide": true,
"show": true,
"sortDesc": true,
"total": false,
"values": true
},
"lines": true,
"linewidth": 2,
"links": [],
"nullPointMode": "null",
"options": {
"dataLinks": []
},
"percentage": false,
"pointradius": 5,
"points": false,
"renderer": "flot",
"seriesOverrides": [
{
"alias": "Load 1m",
"color": "#E24D42"
},
{
"alias": "Load 5m",
"color": "#E0752D"
},
{
"alias": "Load 15m",
"color": "#E5AC0E"
}
],
"spaceLength": 10,
"stack": false,
"steppedLine": false,
"targets": [
{
"calculatedInterval": "10s",
"datasourceErrors": {},
"errors": {},
"expr": "node_load1{instance='localhost:9100',job='node'}",
"format": "time_series",
"interval": "",
"intervalFactor": 1,
"legendFormat": "Load 1m",
"metric": "",
"prometheusLink": "/api/datasources/proxy/1/graph#%5B%7B%22expr%22%3A%22node_load1%7Balias%3D%5C%22%24host%5C%22%7D%22%2C%22range_input%22%3A%223601s%22%2C%22end_input%22%3A%222015-10-22%2015%3A27%22%2C%22step_input%22%3A%22%22%2C%22stacked%22%3Afalse%2C%22tab%22%3A0%7D%5D",
"refId": "A",
"step": 2,
"target": ""
},
{
"calculatedInterval": "10s",
"datasourceErrors": {},
"errors": {},
"expr": "node_load5{instance='localhost:9100',job='node'}",
"format": "time_series",
"interval": "",
"intervalFactor": 1,
"legendFormat": "Load 5m",
"metric": "",
"prometheusLink": "/api/datasources/proxy/1/graph#%5B%7B%22expr%22%3A%22node_load5%7Balias%3D%5C%22%24host%5C%22%7D%22%2C%22range_input%22%3A%223600s%22%2C%22end_input%22%3A%222015-10-22%2015%3A27%22%2C%22step_input%22%3A%22%22%2C%22stacked%22%3Afalse%2C%22tab%22%3A0%7D%5D",
"refId": "B",
"step": 2,
"target": ""
},
{
"calculatedInterval": "10s",
"datasourceErrors": {},
"errors": {},
"expr": "node_load15{instance='localhost:9100',job='node'}",
"format": "time_series",
"interval": "",
"intervalFactor": 1,
"legendFormat": "Load 15m",
"metric": "",
"prometheusLink": "/api/datasources/proxy/1/graph#%5B%7B%22expr%22%3A%22node_load15%7Balias%3D%5C%22%24host%5C%22%7D%22%2C%22range_input%22%3A%223600s%22%2C%22end_input%22%3A%222015-10-22%2015%3A27%22%2C%22step_input%22%3A%22%22%2C%22stacked%22%3Afalse%2C%22tab%22%3A0%7D%5D",
"refId": "C",
"step": 2,
"target": ""
}
],
"thresholds": [],
"timeFrom": null,
"timeRegions": [],
"timeShift": null,
"title": "Load Average",
"tooltip": {
"msResolution": false,
"shared": true,
"sort": 0,
"value_type": "individual"
},
"type": "graph",
"xaxis": {
"buckets": null,
"mode": "time",
"name": null,
"show": true,
"values": []
},
"yaxes": [
{
"format": "none",
"label": "",
"logBase": 1,
"max": null,
"min": 0,
"show": true
},
{
"format": "none",
"logBase": 1,
"max": null,
"min": 0,
"show": true
}
],
"yaxis": {
"align": false,
"alignLevel": null
}
},
{
"aliasColors": {},
"bars": false,
"dashLength": 10,
"dashes": false,
"datasource": "GitLab Omnibus",
"fieldConfig": {
"defaults": {
"custom": {}
},
"overrides": []
},
"fill": 4,
"fillGradient": 0,
"gridPos": {
"h": 8,
"w": 12,
"x": 0,
"y": 17
},
"hiddenSeries": false,
"id": 33,
"legend": {
"alignAsTable": true,
"avg": true,
"current": false,
"max": true,
"min": true,
"show": true,
"total": false,
"values": true
},
"lines": true,
"linewidth": 2,
"links": [],
"nullPointMode": "null",
"options": {
"dataLinks": []
},
"percentage": false,
"pointradius": 5,
"points": false,
"renderer": "flot",
"seriesOverrides": [],
"spaceLength": 10,
"stack": true,
"steppedLine": false,
"targets": [
{
"alias": "",
"expr": "node_memory_MemTotal_bytes{job='node',instance='localhost:9100'}",
"format": "time_series",
"intervalFactor": 1,
"legendFormat": "Total",
"rawSql": "SELECT\n UNIX_TIMESTAMP() as time_sec,\n as value,\n as metric\nFROM \nWHERE $__timeFilter(time_column)\nORDER BY ASC\n",
"refId": "A"
},
{
"expr": "node_memory_MemTotal_bytes{job='node',instance='localhost:9100'} - (node_memory_MemAvailable_bytes{job='node',instance='localhost:9100'} or (node_memory_MemFree_bytes{job='node',instance='localhost:9100'} + node_memory_Buffers_bytes{job='node',instance='localhost:9100'} + node_memory_Cached_bytes{job='node',instance='localhost:9100'}))",
"format": "time_series",
"intervalFactor": 1,
"legendFormat": "Used",
"refId": "B"
},
{
"expr": "node_memory_MemAvailable_bytes{job='node',instance='localhost:9100'} or (node_memory_MemFree_bytes{job='node',instance='localhost:9100'} + node_memory_Buffers_bytes{job='node',instance='localhost:9100'} + node_memory_Cached_bytes{job='node',instance='localhost:9100'})",
"format": "time_series",
"intervalFactor": 1,
"legendFormat": "Available",
"refId": "C"
}
],
"thresholds": [],
"timeFrom": null,
"timeRegions": [],
"timeShift": null,
"title": "Memory",
"tooltip": {
"shared": true,
"sort": 0,
"value_type": "individual"
},
"type": "graph",
"xaxis": {
"buckets": null,
"mode": "time",
"name": null,
"show": true,
"values": []
},
"yaxes": [
{
"format": "bytes",
"label": null,
"logBase": 1,
"max": null,
"min": "0",
"show": true
},
{
"format": "bytes",
"label": null,
"logBase": 1,
"max": null,
"min": "0",
"show": true
}
],
"yaxis": {
"align": false,
"alignLevel": null
}
},
{
"aliasColors": {},
"bars": false,
"dashLength": 10,
"dashes": false,
"datasource": "GitLab Omnibus",
"decimals": 2,
"editable": true,
"error": false,
"fieldConfig": {
"defaults": {
"custom": {}
},
"overrides": []
},
"fill": 6,
"fillGradient": 0,
"grid": {},
"gridPos": {
"h": 8,
"w": 12,
"x": 12,
"y": 17
},
"height": "",
"hiddenSeries": false,
"id": 29,
"legend": {
"alignAsTable": true,
"avg": true,
"current": false,
"hideEmpty": false,
"max": true,
"min": true,
"rightSide": false,
"show": true,
"total": false,
"values": true
},
"lines": true,
"linewidth": 2,
"links": [],
"nullPointMode": "null",
"options": {
"dataLinks": []
},
"percentage": false,
"pointradius": 5,
"points": false,
"renderer": "flot",
"seriesOverrides": [],
"spaceLength": 10,
"stack": true,
"steppedLine": false,
"targets": [
{
"calculatedInterval": "2s",
"datasourceErrors": {},
"errors": {},
"expr": "node_memory_MemTotal_bytes{job='node',instance='localhost:9100'} - (node_memory_MemFree_bytes{job='node',instance='localhost:9100'} + node_memory_Buffers_bytes{job='node',instance='localhost:9100'} + node_memory_Cached_bytes{job='node',instance='localhost:9100'})",
"format": "time_series",
"intervalFactor": 1,
"legendFormat": "Used",
"metric": "",
"prometheusLink": "/api/datasources/proxy/1/graph#%5B%7B%22expr%22%3A%22node_memory_MemTotal%7Balias%3D%5C%22%24host%5C%22%7D%20-%20(node_memory_MemFree%7Balias%3D%5C%22%24host%5C%22%7D%20%2B%20node_memory_Buffers%7Balias%3D%5C%22%24host%5C%22%7D%20%2B%20node_memory_Cached%7Balias%3D%5C%22%24host%5C%22%7D)%22%2C%22range_input%22%3A%22900s%22%2C%22end_input%22%3A%222015-10-22%2015%3A25%22%2C%22step_input%22%3A%22%22%2C%22stacked%22%3Atrue%2C%22tab%22%3A0%7D%5D",
"refId": "A",
"step": 5,
"target": ""
},
{
"calculatedInterval": "2s",
"datasourceErrors": {},
"errors": {},
"expr": "node_memory_MemFree_bytes{job='node',instance='localhost:9100'}",
"format": "time_series",
"intervalFactor": 1,
"legendFormat": "Free",
"metric": "",
"prometheusLink": "/api/datasources/proxy/1/graph#%5B%7B%22expr%22%3A%22node_memory_MemFree%7Balias%3D%5C%22%24host%5C%22%7D%20%2B%20node_memory_Buffers%7Balias%3D%5C%22%24host%5C%22%7D%20%2B%20node_memory_Cached%7Balias%3D%5C%22%24host%5C%22%7D%22%2C%22range_input%22%3A%22900s%22%2C%22end_input%22%3A%222015-10-22%2015%3A25%22%2C%22step_input%22%3A%22%22%2C%22stacked%22%3Atrue%2C%22tab%22%3A0%7D%5D",
"refId": "B",
"step": 5,
"target": ""
},
{
"calculatedInterval": "2s",
"datasourceErrors": {},
"errors": {},
"expr": "node_memory_Buffers_bytes{job='node',instance='localhost:9100'}",
"format": "time_series",
"intervalFactor": 1,
"legendFormat": "Buffers",
"metric": "",
"prometheusLink": "/api/datasources/proxy/1/graph#%5B%7B%22expr%22%3A%22node_memory_MemFree%7Balias%3D%5C%22%24host%5C%22%7D%20%2B%20node_memory_Buffers%7Balias%3D%5C%22%24host%5C%22%7D%20%2B%20node_memory_Cached%7Balias%3D%5C%22%24host%5C%22%7D%22%2C%22range_input%22%3A%22900s%22%2C%22end_input%22%3A%222015-10-22%2015%3A25%22%2C%22step_input%22%3A%22%22%2C%22stacked%22%3Atrue%2C%22tab%22%3A0%7D%5D",
"refId": "D",
"step": 5,
"target": ""
},
{
"calculatedInterval": "2s",
"datasourceErrors": {},
"errors": {},
"expr": "node_memory_Cached_bytes{job='node',instance='localhost:9100'}",
"format": "time_series",
"intervalFactor": 1,
"legendFormat": "Cached",
"metric": "",
"prometheusLink": "/api/datasources/proxy/1/graph#%5B%7B%22expr%22%3A%22node_memory_MemFree%7Balias%3D%5C%22%24host%5C%22%7D%20%2B%20node_memory_Buffers%7Balias%3D%5C%22%24host%5C%22%7D%20%2B%20node_memory_Cached%7Balias%3D%5C%22%24host%5C%22%7D%22%2C%22range_input%22%3A%22900s%22%2C%22end_input%22%3A%222015-10-22%2015%3A25%22%2C%22step_input%22%3A%22%22%2C%22stacked%22%3Atrue%2C%22tab%22%3A0%7D%5D",
"refId": "E",
"step": 5,
"target": ""
}
],
"thresholds": [],
"timeFrom": null,
"timeRegions": [],
"timeShift": null,
"title": "Memory Distribution",
"tooltip": {
"msResolution": false,
"shared": true,
"sort": 0,
"value_type": "individual"
},
"type": "graph",
"xaxis": {
"buckets": null,
"mode": "time",
"name": null,
"show": true,
"values": []
},
"yaxes": [
{
"format": "bytes",
"label": "",
"logBase": 1,
"max": null,
"min": 0,
"show": true
},
{
"format": "bytes",
"logBase": 1,
"max": null,
"min": 0,
"show": true
}
],
"yaxis": {
"align": false,
"alignLevel": null
}
},
{
"aliasColors": {},
"bars": false,
"dashLength": 10,
"dashes": false,
"datasource": "GitLab Omnibus",
"decimals": 2,
"editable": true,
"error": false,
"fieldConfig": {
"defaults": {
"custom": {}
},
"overrides": []
},
"fill": 6,
"fillGradient": 0,
"grid": {},
"gridPos": {
"h": 8,
"w": 12,
"x": 0,
"y": 25
},
"hiddenSeries": false,
"id": 21,
"legend": {
"alignAsTable": true,
"avg": true,
"current": false,
"hideEmpty": false,
"max": true,
"min": true,
"rightSide": false,
"show": true,
"total": false,
"values": true
},
"lines": true,
"linewidth": 2,
"links": [],
"nullPointMode": "null",
"options": {
"dataLinks": []
},
"percentage": false,
"pointradius": 5,
"points": false,
"renderer": "flot",
"seriesOverrides": [],
"spaceLength": 10,
"stack": true,
"steppedLine": false,
"targets": [
{
"calculatedInterval": "2s",
"datasourceErrors": {},
"errors": {},
"expr": "rate(node_network_receive_bytes_total{job='node',instance='localhost:9100', device!=\"lo\"}[$interval]) or irate(node_network_receive_bytes_total{job='node',instance='localhost:9100', device!=\"lo\"}[5m])",
"format": "time_series",
"interval": "",
"intervalFactor": 1,
"legendFormat": "Inbound: {{ device }}",
"metric": "",
"prometheusLink": "/api/datasources/proxy/1/graph#%5B%7B%22expr%22%3A%22node_memory_MemFree%7Balias%3D%5C%22%24host%5C%22%7D%20%2B%20node_memory_Buffers%7Balias%3D%5C%22%24host%5C%22%7D%20%2B%20node_memory_Cached%7Balias%3D%5C%22%24host%5C%22%7D%22%2C%22range_input%22%3A%22900s%22%2C%22end_input%22%3A%222015-10-22%2015%3A25%22%2C%22step_input%22%3A%22%22%2C%22stacked%22%3Atrue%2C%22tab%22%3A0%7D%5D",
"refId": "B",
"step": 5,
"target": ""
},
{
"calculatedInterval": "2s",
"datasourceErrors": {},
"errors": {},
"expr": "rate(node_network_transmit_bytes_total{job='node',instance='localhost:9100', device!=\"lo\"}[$interval]) or irate(node_network_transmit_bytes_total{alias=\"$host\", device!=\"lo\"}[5m])",
"format": "time_series",
"intervalFactor": 1,
"legendFormat": "Outbound: {{ device }}",
"metric": "",
"prometheusLink": "/api/datasources/proxy/1/graph#%5B%7B%22expr%22%3A%22node_memory_MemTotal%7Balias%3D%5C%22%24host%5C%22%7D%20-%20(node_memory_MemFree%7Balias%3D%5C%22%24host%5C%22%7D%20%2B%20node_memory_Buffers%7Balias%3D%5C%22%24host%5C%22%7D%20%2B%20node_memory_Cached%7Balias%3D%5C%22%24host%5C%22%7D)%22%2C%22range_input%22%3A%22900s%22%2C%22end_input%22%3A%222015-10-22%2015%3A25%22%2C%22step_input%22%3A%22%22%2C%22stacked%22%3Atrue%2C%22tab%22%3A0%7D%5D",
"refId": "A",
"step": 5,
"target": ""
}
],
"thresholds": [],
"timeFrom": null,
"timeRegions": [],
"timeShift": null,
"title": "Network Traffic",
"tooltip": {
"msResolution": false,
"shared": true,
"sort": 0,
"value_type": "individual"
},
"type": "graph",
"xaxis": {
"buckets": null,
"mode": "time",
"name": null,
"show": true,
"values": []
},
"yaxes": [
{
"format": "Bps",
"label": "",
"logBase": 1,
"max": null,
"min": 0,
"show": true
},
{
"format": "bytes",
"logBase": 1,
"max": null,
"min": 0,
"show": true
}
],
"yaxis": {
"align": false,
"alignLevel": null
}
},
{
"aliasColors": {},
"bars": true,
"dashLength": 10,
"dashes": false,
"datasource": "GitLab Omnibus",
"decimals": 2,
"editable": true,
"error": false,
"fieldConfig": {
"defaults": {
"custom": {}
},
"overrides": []
},
"fill": 6,
"fillGradient": 0,
"grid": {},
"gridPos": {
"h": 8,
"w": 12,
"x": 12,
"y": 25
},
"hiddenSeries": false,
"id": 22,
"legend": {
"alignAsTable": true,
"avg": true,
"current": false,
"hideEmpty": false,
"max": true,
"min": true,
"rightSide": false,
"show": true,
"sort": "min",
"sortDesc": true,
"total": false,
"values": true
},
"lines": false,
"linewidth": 2,
"links": [],
"nullPointMode": "null",
"options": {
"dataLinks": []
},
"percentage": false,
"pointradius": 5,
"points": false,
"renderer": "flot",
"seriesOverrides": [],
"spaceLength": 10,
"stack": true,
"steppedLine": false,
"targets": [
{
"calculatedInterval": "2s",
"datasourceErrors": {},
"errors": {},
"expr": "sum(increase(node_network_receive_bytes_total{job='node',instance='localhost:9100', device!=\"lo\"}[1h]))",
"format": "time_series",
"interval": "1h",
"intervalFactor": 1,
"legendFormat": "Received",
"metric": "",
"prometheusLink": "/api/datasources/proxy/1/graph#%5B%7B%22expr%22%3A%22node_memory_MemTotal%7Balias%3D%5C%22%24host%5C%22%7D%20-%20(node_memory_MemFree%7Balias%3D%5C%22%24host%5C%22%7D%20%2B%20node_memory_Buffers%7Balias%3D%5C%22%24host%5C%22%7D%20%2B%20node_memory_Cached%7Balias%3D%5C%22%24host%5C%22%7D)%22%2C%22range_input%22%3A%22900s%22%2C%22end_input%22%3A%222015-10-22%2015%3A25%22%2C%22step_input%22%3A%22%22%2C%22stacked%22%3Atrue%2C%22tab%22%3A0%7D%5D",
"refId": "A",
"step": 3600,
"target": ""
},
{
"calculatedInterval": "2s",
"datasourceErrors": {},
"errors": {},
"expr": "sum(increase(node_network_transmit_bytes_total{job='node',instance='localhost:9100', device!=\"lo\"}[1h]))",
"format": "time_series",
"hide": false,
"interval": "1h",
"intervalFactor": 1,
"legendFormat": "Sent",
"metric": "",
"prometheusLink": "/api/datasources/proxy/1/graph#%5B%7B%22expr%22%3A%22node_memory_MemTotal%7Balias%3D%5C%22%24host%5C%22%7D%20-%20(node_memory_MemFree%7Balias%3D%5C%22%24host%5C%22%7D%20%2B%20node_memory_Buffers%7Balias%3D%5C%22%24host%5C%22%7D%20%2B%20node_memory_Cached%7Balias%3D%5C%22%24host%5C%22%7D)%22%2C%22range_input%22%3A%22900s%22%2C%22end_input%22%3A%222015-10-22%2015%3A25%22%2C%22step_input%22%3A%22%22%2C%22stacked%22%3Atrue%2C%22tab%22%3A0%7D%5D",
"refId": "B",
"step": 3600,
"target": ""
}
],
"thresholds": [],
"timeFrom": "24h",
"timeRegions": [],
"timeShift": null,
"title": "Network Utilization Hourly",
"tooltip": {
"msResolution": false,
"shared": true,
"sort": 0,
"value_type": "individual"
},
"type": "graph",
"xaxis": {
"buckets": null,
"mode": "time",
"name": null,
"show": true,
"values": []
},
"yaxes": [
{
"format": "bytes",
"label": "",
"logBase": 1,
"max": null,
"min": 0,
"show": true
},
{
"format": "bytes",
"logBase": 1,
"max": null,
"min": 0,
"show": true
}
],
"yaxis": {
"align": false,
"alignLevel": null
}
},
{
"aliasColors": {},
"bars": false,
"dashLength": 10,
"dashes": false,
"datasource": "GitLab Omnibus",
"decimals": 2,
"editable": true,
"error": false,
"fieldConfig": {
"defaults": {
"custom": {}
},
"overrides": []
},
"fill": 2,
"fillGradient": 0,
"grid": {},
"gridPos": {
"h": 8,
"w": 12,
"x": 0,
"y": 33
},
"hiddenSeries": false,
"id": 27,
"legend": {
"alignAsTable": true,
"avg": true,
"current": false,
"hideEmpty": false,
"max": true,
"min": true,
"rightSide": false,
"show": true,
"total": false,
"values": true
},
"lines": true,
"linewidth": 2,
"links": [],
"nullPointMode": "null",
"options": {
"dataLinks": []
},
"percentage": false,
"pointradius": 5,
"points": false,
"renderer": "flot",
"seriesOverrides": [],
"spaceLength": 10,
"stack": false,
"steppedLine": false,
"targets": [
{
"calculatedInterval": "2m",
"datasourceErrors": {},
"errors": {},
"expr": "rate(node_context_switches_total{job='node',instance='localhost:9100'}[$interval]) or irate(node_context_switches_total{job='node',instance='localhost:9100'}[5m])",
"format": "time_series",
"intervalFactor": 1,
"legendFormat": "Context Switches",
"metric": "",
"prometheusLink": "/api/datasources/proxy/1/graph#%5B%7B%22expr%22%3A%22node_procs_running%7Balias%3D%5C%22%24host%5C%22%7D%22%2C%22range_input%22%3A%2243200s%22%2C%22end_input%22%3A%222015-9-18%2013%3A46%22%2C%22step_input%22%3A%22%22%2C%22stacked%22%3Atrue%2C%22tab%22%3A0%7D%5D",
"refId": "A",
"step": 5,
"target": ""
}
],
"thresholds": [],
"timeFrom": null,
"timeRegions": [],
"timeShift": null,
"title": "Context Switches",
"tooltip": {
"msResolution": false,
"shared": true,
"sort": 0,
"value_type": "individual"
},
"type": "graph",
"xaxis": {
"buckets": null,
"mode": "time",
"name": null,
"show": true,
"values": []
},
"yaxes": [
{
"format": "none",
"label": "",
"logBase": 1,
"max": null,
"min": 0,
"show": true
},
{
"format": "none",
"logBase": 1,
"max": null,
"min": 0,
"show": true
}
],
"yaxis": {
"align": false,
"alignLevel": null
}
},
{
"aliasColors": {},
"bars": true,
"dashLength": 10,
"dashes": false,
"datasource": "GitLab Omnibus",
"decimals": 2,
"editable": true,
"error": false,
"fieldConfig": {
"defaults": {
"custom": {}
},
"overrides": []
},
"fill": 2,
"fillGradient": 0,
"grid": {},
"gridPos": {
"h": 8,
"w": 12,
"x": 12,
"y": 33
},
"hiddenSeries": false,
"id": 20,
"legend": {
"alignAsTable": true,
"avg": true,
"current": false,
"hideEmpty": false,
"max": true,
"min": true,
"rightSide": false,
"show": true,
"total": false,
"values": true
},
"lines": false,
"linewidth": 2,
"links": [],
"nullPointMode": "null",
"options": {
"dataLinks": []
},
"percentage": false,
"pointradius": 5,
"points": false,
"renderer": "flot",
"seriesOverrides": [
{
"alias": "Processes blocked waiting for I/O to complete",
"color": "#E24D42"
},
{
"alias": "Processes in runnable state",
"color": "#6ED0E0"
}
],
"spaceLength": 10,
"stack": true,
"steppedLine": false,
"targets": [
{
"calculatedInterval": "2m",
"datasourceErrors": {},
"errors": {},
"expr": "node_procs_running{job='node',instance='localhost:9100'}",
"format": "time_series",
"intervalFactor": 1,
"legendFormat": "Processes in runnable state",
"metric": "",
"prometheusLink": "/api/datasources/proxy/1/graph#%5B%7B%22expr%22%3A%22node_procs_running%7Balias%3D%5C%22%24host%5C%22%7D%22%2C%22range_input%22%3A%2243200s%22%2C%22end_input%22%3A%222015-9-18%2013%3A46%22%2C%22step_input%22%3A%22%22%2C%22stacked%22%3Atrue%2C%22tab%22%3A0%7D%5D",
"refId": "A",
"step": 5,
"target": ""
},
{
"calculatedInterval": "2m",
"datasourceErrors": {},
"errors": {},
"expr": "node_procs_blocked{job='node',instance='localhost:9100'}",
"format": "time_series",
"intervalFactor": 1,
"legendFormat": "Processes blocked waiting for I/O to complete",
"metric": "",
"prometheusLink": "/api/datasources/proxy/1/graph#%5B%7B%22expr%22%3A%22node_procs_blocked%7Balias%3D%5C%22%24host%5C%22%7D%22%2C%22range_input%22%3A%2243200s%22%2C%22end_input%22%3A%222015-9-18%2013%3A46%22%2C%22step_input%22%3A%22%22%2C%22stacked%22%3Atrue%2C%22tab%22%3A0%7D%5D",
"refId": "B",
"step": 5,
"target": ""
}
],
"thresholds": [],
"timeFrom": null,
"timeRegions": [],
"timeShift": null,
"title": "Processes",
"tooltip": {
"msResolution": false,
"shared": true,
"sort": 0,
"value_type": "individual"
},
"type": "graph",
"xaxis": {
"buckets": null,
"mode": "time",
"name": null,
"show": true,
"values": []
},
"yaxes": [
{
"format": "none",
"label": "",
"logBase": 1,
"max": null,
"min": 0,
"show": true
},
{
"format": "none",
"logBase": 1,
"max": null,
"min": 0,
"show": true
}
],
"yaxis": {
"align": false,
"alignLevel": null
}
},
{
"aliasColors": {},
"bars": false,
"dashLength": 10,
"dashes": false,
"datasource": "GitLab Omnibus",
"decimals": 2,
"editable": true,
"error": false,
"fieldConfig": {
"defaults": {
"custom": {}
},
"overrides": []
},
"fill": 2,
"fillGradient": 0,
"grid": {},
"gridPos": {
"h": 8,
"w": 12,
"x": 0,
"y": 41
},
"hiddenSeries": false,
"id": 31,
"legend": {
"alignAsTable": true,
"avg": true,
"current": false,
"hideEmpty": false,
"max": true,
"min": true,
"rightSide": false,
"show": true,
"total": false,
"values": true
},
"lines": true,
"linewidth": 2,
"links": [],
"nullPointMode": "null",
"options": {
"dataLinks": []
},
"percentage": false,
"pointradius": 5,
"points": false,
"renderer": "flot",
"seriesOverrides": [],
"spaceLength": 10,
"stack": false,
"steppedLine": false,
"targets": [
{
"calculatedInterval": "2s",
"datasourceErrors": {},
"errors": {},
"expr": "rate(node_vmstat_pgpgin{job='node'}[$interval]) * 1024 or irate(node_vmstat_pgpgin{job='node'}[5m]) * 1024",
"format": "time_series",
"hide": false,
"intervalFactor": 1,
"legendFormat": "Page In",
"metric": "",
"prometheusLink": "/api/datasources/proxy/1/graph#%5B%7B%22expr%22%3A%22node_memory_MemTotal%7Balias%3D%5C%22%24host%5C%22%7D%20-%20(node_memory_MemFree%7Balias%3D%5C%22%24host%5C%22%7D%20%2B%20node_memory_Buffers%7Balias%3D%5C%22%24host%5C%22%7D%20%2B%20node_memory_Cached%7Balias%3D%5C%22%24host%5C%22%7D)%22%2C%22range_input%22%3A%22900s%22%2C%22end_input%22%3A%222015-10-22%2015%3A25%22%2C%22step_input%22%3A%22%22%2C%22stacked%22%3Atrue%2C%22tab%22%3A0%7D%5D",
"refId": "A",
"step": 5,
"target": ""
},
{
"calculatedInterval": "2s",
"datasourceErrors": {},
"errors": {},
"expr": "rate(node_vmstat_pgpgout{job='node'}[$interval]) * 1024 or irate(node_vmstat_pgpgout{job='node'}[5m]) * 1024",
"format": "time_series",
"hide": false,
"intervalFactor": 1,
"legendFormat": "Page Out",
"metric": "",
"prometheusLink": "/api/datasources/proxy/1/graph#%5B%7B%22expr%22%3A%22node_memory_MemFree%7Balias%3D%5C%22%24host%5C%22%7D%20%2B%20node_memory_Buffers%7Balias%3D%5C%22%24host%5C%22%7D%20%2B%20node_memory_Cached%7Balias%3D%5C%22%24host%5C%22%7D%22%2C%22range_input%22%3A%22900s%22%2C%22end_input%22%3A%222015-10-22%2015%3A25%22%2C%22step_input%22%3A%22%22%2C%22stacked%22%3Atrue%2C%22tab%22%3A0%7D%5D",
"refId": "B",
"step": 5,
"target": ""
}
],
"thresholds": [],
"timeFrom": null,
"timeRegions": [],
"timeShift": null,
"title": "I/O Activity",
"tooltip": {
"msResolution": false,
"shared": true,
"sort": 0,
"value_type": "individual"
},
"type": "graph",
"xaxis": {
"buckets": null,
"mode": "time",
"name": null,
"show": true,
"values": []
},
"yaxes": [
{
"format": "Bps",
"label": "",
"logBase": 1,
"max": null,
"min": 0,
"show": true
},
{
"format": "bytes",
"logBase": 1,
"max": null,
"min": 0,
"show": true
}
],
"yaxis": {
"align": false,
"alignLevel": null
}
},
{
"aliasColors": {},
"bars": false,
"dashLength": 10,
"dashes": false,
"datasource": "GitLab Omnibus",
"decimals": 2,
"editable": true,
"error": false,
"fieldConfig": {
"defaults": {
"custom": {}
},
"overrides": []
},
"fill": 2,
"fillGradient": 0,
"grid": {},
"gridPos": {
"h": 8,
"w": 12,
"x": 12,
"y": 41
},
"hiddenSeries": false,
"id": 28,
"legend": {
"alignAsTable": true,
"avg": true,
"current": false,
"hideEmpty": false,
"max": true,
"min": true,
"rightSide": false,
"show": true,
"total": false,
"values": true
},
"lines": true,
"linewidth": 2,
"links": [],
"nullPointMode": "null",
"options": {
"dataLinks": []
},
"percentage": false,
"pointradius": 5,
"points": false,
"renderer": "flot",
"seriesOverrides": [
{
"alias": "Interrupts",
"color": "#D683CE"
}
],
"spaceLength": 10,
"stack": false,
"steppedLine": false,
"targets": [
{
"calculatedInterval": "2m",
"datasourceErrors": {},
"errors": {},
"expr": "rate(node_intr_total{instance=\":9100\",job=\"node\"}[$interval]) or irate(node_intr_total{job=\"node\"}[5m])",
"format": "time_series",
"intervalFactor": 1,
"legendFormat": "Interrupts",
"metric": "",
"prometheusLink": "/api/datasources/proxy/1/graph#%5B%7B%22expr%22%3A%22node_procs_running%7Balias%3D%5C%22%24host%5C%22%7D%22%2C%22range_input%22%3A%2243200s%22%2C%22end_input%22%3A%222015-9-18%2013%3A46%22%2C%22step_input%22%3A%22%22%2C%22stacked%22%3Atrue%2C%22tab%22%3A0%7D%5D",
"refId": "A",
"step": 5,
"target": ""
}
],
"thresholds": [],
"timeFrom": null,
"timeRegions": [],
"timeShift": null,
"title": "Interrupts",
"tooltip": {
"msResolution": true,
"shared": true,
"sort": 0,
"value_type": "individual"
},
"type": "graph",
"xaxis": {
"buckets": null,
"mode": "time",
"name": null,
"show": true,
"values": []
},
"yaxes": [
{
"format": "none",
"label": "",
"logBase": 1,
"max": null,
"min": 0,
"show": true
},
{
"format": "none",
"logBase": 1,
"max": null,
"min": 0,
"show": true
}
],
"yaxis": {
"align": false,
"alignLevel": null
}
},
{
"aliasColors": {},
"bars": false,
"dashLength": 10,
"dashes": false,
"datasource": "GitLab Omnibus",
"decimals": 2,
"editable": true,
"error": false,
"fieldConfig": {
"defaults": {
"custom": {}
},
"overrides": []
},
"fill": 6,
"fillGradient": 0,
"grid": {},
"gridPos": {
"h": 8,
"w": 12,
"x": 0,
"y": 49
},
"hiddenSeries": false,
"id": 23,
"legend": {
"alignAsTable": true,
"avg": true,
"current": false,
"hideEmpty": false,
"max": true,
"min": true,
"rightSide": false,
"show": true,
"total": false,
"values": true
},
"lines": true,
"linewidth": 2,
"links": [],
"nullPointMode": "null",
"options": {
"dataLinks": []
},
"percentage": false,
"pointradius": 5,
"points": false,
"renderer": "flot",
"seriesOverrides": [
{
"alias": "Used",
"color": "#584477"
},
{
"alias": "Free",
"color": "#AEA2E0"
}
],
"spaceLength": 10,
"stack": true,
"steppedLine": false,
"targets": [
{
"calculatedInterval": "2s",
"datasourceErrors": {},
"errors": {},
"expr": "node_memory_SwapTotal_bytes{job='node',instance='localhost:9100'} - node_memory_SwapFree_bytes{job='node',instance='localhost:9100'}",
"format": "time_series",
"intervalFactor": 1,
"legendFormat": "Used",
"metric": "",
"prometheusLink": "/api/datasources/proxy/1/graph#%5B%7B%22expr%22%3A%22node_memory_MemTotal%7Balias%3D%5C%22%24host%5C%22%7D%20-%20(node_memory_MemFree%7Balias%3D%5C%22%24host%5C%22%7D%20%2B%20node_memory_Buffers%7Balias%3D%5C%22%24host%5C%22%7D%20%2B%20node_memory_Cached%7Balias%3D%5C%22%24host%5C%22%7D)%22%2C%22range_input%22%3A%22900s%22%2C%22end_input%22%3A%222015-10-22%2015%3A25%22%2C%22step_input%22%3A%22%22%2C%22stacked%22%3Atrue%2C%22tab%22%3A0%7D%5D",
"refId": "A",
"step": 5,
"target": ""
},
{
"calculatedInterval": "2s",
"datasourceErrors": {},
"errors": {},
"expr": "node_memory_SwapFree_bytes{job='node',instance='localhost:9100'}",
"format": "time_series",
"hide": false,
"intervalFactor": 1,
"legendFormat": "Free",
"metric": "",
"prometheusLink": "/api/datasources/proxy/1/graph#%5B%7B%22expr%22%3A%22node_memory_MemFree%7Balias%3D%5C%22%24host%5C%22%7D%20%2B%20node_memory_Buffers%7Balias%3D%5C%22%24host%5C%22%7D%20%2B%20node_memory_Cached%7Balias%3D%5C%22%24host%5C%22%7D%22%2C%22range_input%22%3A%22900s%22%2C%22end_input%22%3A%222015-10-22%2015%3A25%22%2C%22step_input%22%3A%22%22%2C%22stacked%22%3Atrue%2C%22tab%22%3A0%7D%5D",
"refId": "B",
"step": 5,
"target": ""
}
],
"thresholds": [],
"timeFrom": null,
"timeRegions": [],
"timeShift": null,
"title": "Swap",
"tooltip": {
"msResolution": false,
"shared": true,
"sort": 0,
"value_type": "individual"
},
"type": "graph",
"xaxis": {
"buckets": null,
"mode": "time",
"name": null,
"show": true,
"values": []
},
"yaxes": [
{
"format": "bytes",
"label": "",
"logBase": 1,
"max": null,
"min": 0,
"show": true
},
{
"format": "bytes",
"logBase": 1,
"max": null,
"min": 0,
"show": true
}
],
"yaxis": {
"align": false,
"alignLevel": null
}
},
{
"aliasColors": {},
"bars": false,
"dashLength": 10,
"dashes": false,
"datasource": "GitLab Omnibus",
"decimals": 2,
"editable": true,
"error": false,
"fieldConfig": {
"defaults": {
"custom": {}
},
"overrides": []
},
"fill": 2,
"fillGradient": 0,
"grid": {},
"gridPos": {
"h": 8,
"w": 12,
"x": 12,
"y": 49
},
"hiddenSeries": false,
"id": 30,
"legend": {
"alignAsTable": true,
"avg": true,
"current": false,
"hideEmpty": false,
"max": true,
"min": true,
"rightSide": false,
"show": true,
"total": false,
"values": true
},
"lines": true,
"linewidth": 2,
"links": [],
"nullPointMode": "null",
"options": {
"dataLinks": []
},
"percentage": false,
"pointradius": 5,
"points": false,
"renderer": "flot",
"seriesOverrides": [],
"spaceLength": 10,
"stack": false,
"steppedLine": false,
"targets": [
{
"calculatedInterval": "2s",
"datasourceErrors": {},
"errors": {},
"expr": "rate(node_vmstat_pswpin{job='node',instance='localhost:9100'}[$interval]) * 4096 or irate(node_vmstat_pswpin{job='node',instance='localhost:9100'}[5m]) * 4096",
"format": "time_series",
"intervalFactor": 1,
"legendFormat": "Swap In",
"metric": "",
"prometheusLink": "/api/datasources/proxy/1/graph#%5B%7B%22expr%22%3A%22node_memory_MemTotal%7Balias%3D%5C%22%24host%5C%22%7D%20-%20(node_memory_MemFree%7Balias%3D%5C%22%24host%5C%22%7D%20%2B%20node_memory_Buffers%7Balias%3D%5C%22%24host%5C%22%7D%20%2B%20node_memory_Cached%7Balias%3D%5C%22%24host%5C%22%7D)%22%2C%22range_input%22%3A%22900s%22%2C%22end_input%22%3A%222015-10-22%2015%3A25%22%2C%22step_input%22%3A%22%22%2C%22stacked%22%3Atrue%2C%22tab%22%3A0%7D%5D",
"refId": "A",
"step": 5,
"target": ""
},
{
"calculatedInterval": "2s",
"datasourceErrors": {},
"errors": {},
"expr": "rate(node_vmstat_pswpout{job='node',instance='localhost:9100'}[$interval]) * 4096 or irate(node_vmstat_pswpout{job='node',instance='localhost:9100'}[5m]) * 4096",
"format": "time_series",
"intervalFactor": 1,
"legendFormat": "Swap Out",
"metric": "",
"prometheusLink": "/api/datasources/proxy/1/graph#%5B%7B%22expr%22%3A%22node_memory_MemFree%7Balias%3D%5C%22%24host%5C%22%7D%20%2B%20node_memory_Buffers%7Balias%3D%5C%22%24host%5C%22%7D%20%2B%20node_memory_Cached%7Balias%3D%5C%22%24host%5C%22%7D%22%2C%22range_input%22%3A%22900s%22%2C%22end_input%22%3A%222015-10-22%2015%3A25%22%2C%22step_input%22%3A%22%22%2C%22stacked%22%3Atrue%2C%22tab%22%3A0%7D%5D",
"refId": "B",
"step": 5,
"target": ""
}
],
"thresholds": [],
"timeFrom": null,
"timeRegions": [],
"timeShift": null,
"title": "Swap Activity",
"tooltip": {
"msResolution": false,
"shared": true,
"sort": 0,
"value_type": "individual"
},
"type": "graph",
"xaxis": {
"buckets": null,
"mode": "time",
"name": null,
"show": true,
"values": []
},
"yaxes": [
{
"format": "Bps",
"label": "",
"logBase": 1,
"max": null,
"min": 0,
"show": true
},
{
"format": "bytes",
"logBase": 1,
"max": null,
"min": 0,
"show": true
}
],
"yaxis": {
"align": false,
"alignLevel": null
}
}
],
"refresh": "30s",
"schemaVersion": 25,
"style": "dark",
"tags": [
"system",
"prometheus",
"online",
"GetLab"
],
"templating": {
"list": [
{
"allFormat": "glob",
"auto": true,
"auto_count": 200,
"auto_min": "1s",
"current": {
"selected": false,
"text": "5s",
"value": "5s"
},
"datasource": "GitLab Omnibus",
"hide": 0,
"includeAll": false,
"label": "Interval",
"multi": false,
"multiFormat": "glob",
"name": "interval",
"options": [
{
"selected": false,
"text": "auto",
"value": "$__auto_interval_interval"
},
{
"selected": false,
"text": "1s",
"value": "1s"
},
{
"selected": true,
"text": "5s",
"value": "5s"
},
{
"selected": false,
"text": "1m",
"value": "1m"
},
{
"selected": false,
"text": "5m",
"value": "5m"
},
{
"selected": false,
"text": "1h",
"value": "1h"
},
{
"selected": false,
"text": "6h",
"value": "6h"
},
{
"selected": false,
"text": "1d",
"value": "1d"
}
],
"query": "1s,5s,1m,5m,1h,6h,1d",
"refresh": 2,
"skipUrlSync": false,
"type": "interval"
}
]
},
"time": {
"from": "now-1h",
"to": "now"
},
"timepicker": {
"collapse": false,
"enable": true,
"notice": false,
"now": true,
"refresh_intervals": [
"5s",
"10s",
"30s",
"1m",
"5m",
"15m",
"30m",
"1h",
"2h",
"1d"
],
"status": "Stable",
"time_options": [
"5m",
"15m",
"1h",
"6h",
"12h",
"24h",
"2d",
"7d",
"30d"
],
"type": "timepicker"
},
"timezone": "",
"title": "Gitlab System",
"uid": "4W5aRFAGz",
"version": 2
}
And there you go. You can further enable and collect various Gitlab metric data and visualize them on Grafana.
Reference
Monitoring Gitlab with Prometheus
Other Tutorials
Monitor OpenVPN Connections with Prometheus and Grafana
Install Latest Grafana on CentOS 8

