Welcome to our tutorial on how to monitor OpenVPN connections with Prometheus and Grafana. Grafana is a data visualization and monitoring tool and supports time series datastores such as Graphite, InfluxDB, Prometheus, Elasticsearch. Prometheus on the other hand is an open-source systems and service monitoring tool. It collects metrics from configured targets via HTTP calls at given intervals, evaluates rule expressions, displays the results, and can trigger alerts if some conditions are met. Grafana can be used to achieve better visualization of the metrics collected by the Prometheus. In this setup, however, we will learn how to collect OpenVPN connection metrics using Prometheus and visualize then on Grafana.
Table of Contents
Monitoring OpenVPN Connections with Prometheus and Grafana
In this tutorial, we are using an Ubuntu 20.04 systems for demo labs. Feel free to use other OSes.
Install Prometheus on Linux
We have covered the installation of Prometheus on various Linux distros. Check the link below;
How to install Prometheus on Linux
Install Grafana on Linux
Follow the link below to install Grafana on Ubuntu 20.04;
Integrating Grafana with Prometheus
Once both Grafana and Prometheus are in place, you can then configure Grafana to fetch the metrics from Prometheus.
systemctl status grafana-server
● grafana-server.service - Grafana instance
     Loaded: loaded (/lib/systemd/system/grafana-server.service; enabled; preset: enabled)
     Active: active (running) since Wed 2023-10-04 12:49:42 EDT; 1h 32min ago
       Docs: http://docs.grafana.org
   Main PID: 7738 (grafana)
      Tasks: 13 (limit: 2304)
     Memory: 104.7M
        CPU: 12.320s
     CGroup: /system.slice/grafana-server.service
             └─7738 /usr/share/grafana/bin/grafana server --config=/etc/grafana/grafana.ini --pidfile=/run/grafana/grafana-server.pid --packaging=deb cfg:default.paths.logs=/var/log/grafana cfg:default.paths.da>

Oct 04 13:53:38 debian grafana[7738]: logger=infra.usagestats t=2023-10-04T13:53:38.916154214-04:00 level=info msg="Usage stats are ready to report"
Oct 04 14:02:04 debian grafana[7738]: logger=cleanup t=2023-10-04T14:02:04.896372831-04:00 level=info msg="Completed cleanup jobs" duration=4.398529ms
Oct 04 14:02:05 debian grafana[7738]: logger=plugins.update.checker t=2023-10-04T14:02:05.88565459-04:00 level=info msg="Update check succeeded" duration=50.850455ms
Oct 04 14:02:05 debian grafana[7738]: logger=grafana.update.checker t=2023-10-04T14:02:05.902361256-04:00 level=info msg="Update check succeeded" duration=85.026378ms
Oct 04 14:12:04 debian grafana[7738]: logger=cleanup t=2023-10-04T14:12:04.896987922-04:00 level=info msg="Completed cleanup jobs" duration=5.046391ms
Oct 04 14:12:05 debian grafana[7738]: logger=plugins.update.checker t=2023-10-04T14:12:05.875549982-04:00 level=info msg="Update check succeeded" duration=40.340424ms
Oct 04 14:12:05 debian grafana[7738]: logger=grafana.update.checker t=2023-10-04T14:12:05.944168833-04:00 level=info msg="Update check succeeded" duration=127.7065ms
Oct 04 14:22:04 debian grafana[7738]: logger=cleanup t=2023-10-04T14:22:04.897011702-04:00 level=info msg="Completed cleanup jobs" duration=5.058188ms
Oct 04 14:22:05 debian grafana[7738]: logger=plugins.update.checker t=2023-10-04T14:22:05.890626668-04:00 level=info msg="Update check succeeded" duration=54.886718ms
Oct 04 14:22:06 debian grafana[7738]: logger=grafana.update.checker t=2023-10-04T14:22:06.056406747-04:00 level=info msg="Update check succeeded" duration=239.460727ms
systemctl status prometheus
● prometheus.service - Prometheus Time Series Collection and Processing Server
     Loaded: loaded (/etc/systemd/system/prometheus.service; enabled; preset: enabled)
     Active: active (running) since Wed 2023-10-04 01:00:45 EDT; 13h ago
   Main PID: 3799 (prometheus)
      Tasks: 8 (limit: 2304)
     Memory: 40.3M
        CPU: 35.758s
     CGroup: /system.slice/prometheus.service
             └─3799 /usr/local/bin/prometheus --config.file /etc/prometheus/prometheus.yml --storage.tsdb.path /var/lib/prometheus/ --web.console.templates=/etc/prometheus/consoles --web.console.libraries=/etc/>

Oct 04 11:00:31 debian prometheus[3799]: ts=2023-10-04T15:00:31.446Z caller=compact.go:523 level=info component=tsdb msg="write block" mint=1696420814817 maxt=1696428000000 ulid=01HBXK8SG0E5S4VY6QQB9HDCE2 durat>
Oct 04 11:00:31 debian prometheus[3799]: ts=2023-10-04T15:00:31.455Z caller=head.go:1298 level=info component=tsdb msg="Head GC completed" caller=truncateMemory duration=6.076588ms
Oct 04 13:00:31 debian prometheus[3799]: ts=2023-10-04T17:00:31.537Z caller=compact.go:523 level=info component=tsdb msg="write block" mint=1696428014817 maxt=1696435200000 ulid=01HBXT4GR22C4686R8A29QMEB2 durat>
Oct 04 13:00:31 debian prometheus[3799]: ts=2023-10-04T17:00:31.546Z caller=head.go:1298 level=info component=tsdb msg="Head GC completed" caller=truncateMemory duration=5.807451ms
Oct 04 13:00:31 debian prometheus[3799]: ts=2023-10-04T17:00:31.546Z caller=checkpoint.go:100 level=info component=tsdb msg="Creating checkpoint" from_segment=2 to_segment=3 mint=1696435200000
Oct 04 13:00:31 debian prometheus[3799]: ts=2023-10-04T17:00:31.948Z caller=head.go:1266 level=info component=tsdb msg="WAL checkpoint complete" first=2 last=3 duration=401.376996ms
Oct 04 13:00:33 debian prometheus[3799]: ts=2023-10-04T17:00:33.528Z caller=compact.go:464 level=info component=tsdb msg="compact blocks" count=3 mint=1696399214817 maxt=1696420800000 ulid=01HBXT4JTDAED396N41PR>
Oct 04 13:00:33 debian prometheus[3799]: ts=2023-10-04T17:00:33.645Z caller=db.go:1619 level=info component=tsdb msg="Deleting obsolete block" block=01HBXCD285ARQGJY48DC3GZNSY
Oct 04 13:00:33 debian prometheus[3799]: ts=2023-10-04T17:00:33.779Z caller=db.go:1619 level=info component=tsdb msg="Deleting obsolete block" block=01HBWYNKR37MXZNMD2H2CM402X
Oct 04 13:00:33 debian prometheus[3799]: ts=2023-10-04T17:00:33.915Z caller=db.go:1619 level=info component=tsdb msg="Deleting obsolete block" block=01HBX5HB00BYDWY4CV9Y38ESB1
ss -altnp | grep -E ":3000|:9090"
LISTEN 0      4096               *:3000            *:*    users:(("grafana",pid=7738,fd=11))
LISTEN 0      4096               *:9090            *:*    users:(("prometheus",pid=3799,fd=7))
To integrate Grafana with Prometheus, you need to add Prometheus data source to Grafana.
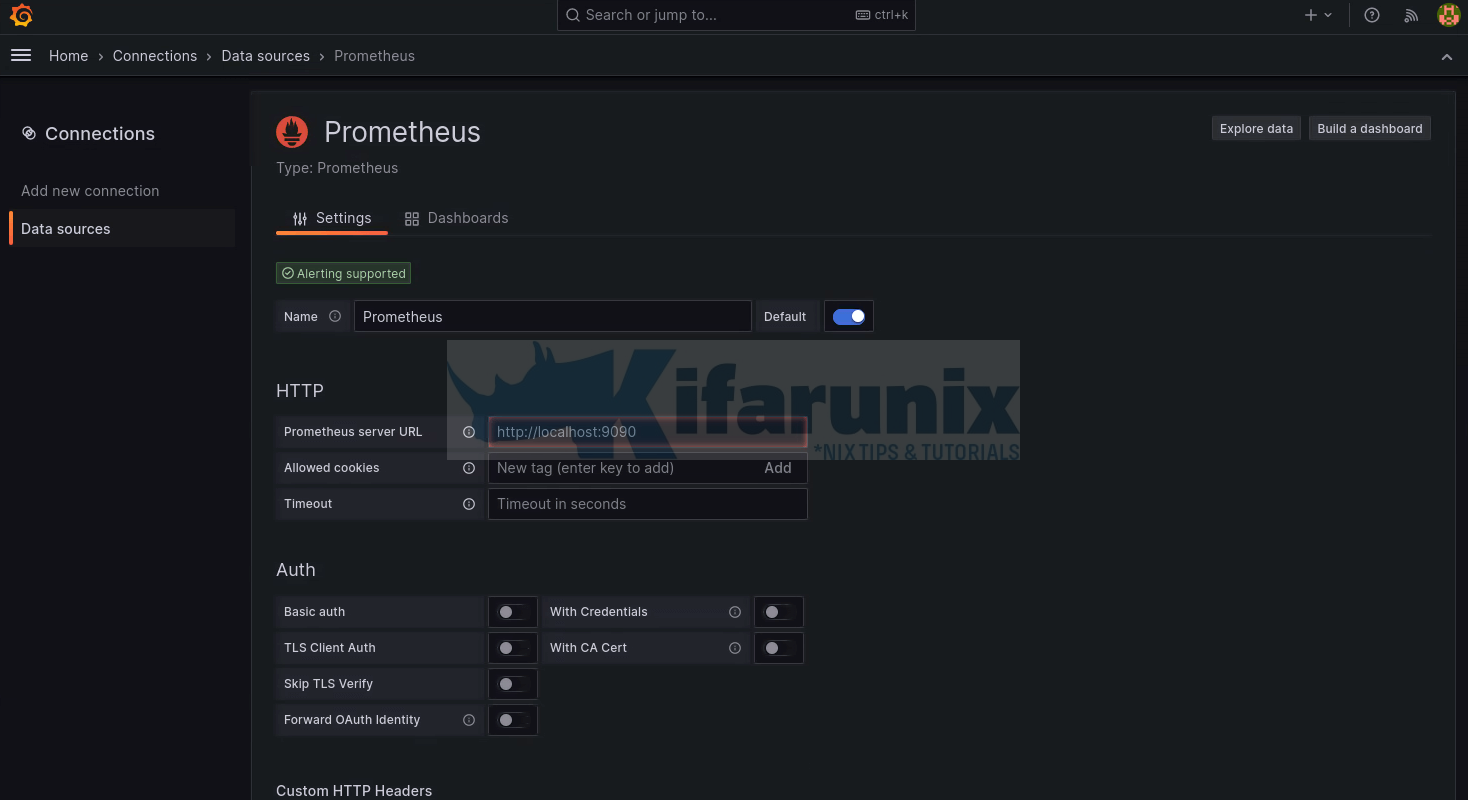
This can be done by logging into Grafana web interface and navigating to Connections (under the menu) > Datasources;

Click Add data source
You can as well click Add new connection and select your data source.
From the data source types, select Prometheus.
This opens up Prometheus datasource configuration page.
Enter the Prometheus server URL. If you are running Grafana and Prometheus on the same server, use the address http://localhost:9090 otherwise, use the address http://<prometheus-server-IP>:9090.

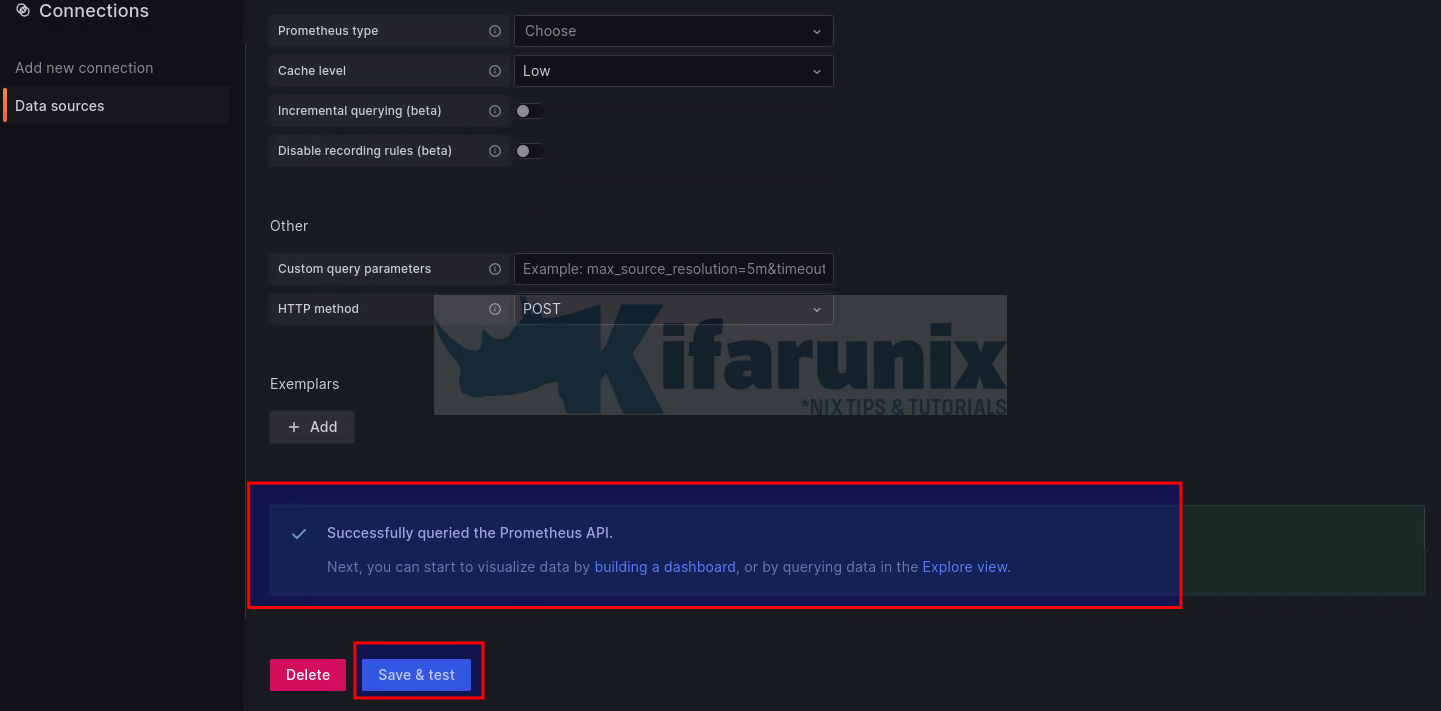
Scroll down the page and click Save & Test.

The integration is now done!
Install and Setup OpenVPN Server
We have already covered how to install and configure OpenVPN and OpenVPN clients;
Install and Setup OpenVPN Server on Linux
Install OpenVPN Prometheus Node Exporter on the OpenVPN Server
Next, you need to install OpenVPN node exporter on the OpenVPN Server.
OpenVPN Exporter for Prometheus is an open source project hosted on Github (currently archived) Kumina’s openvpn-exporter project. All credit goes back to the creators of this exporter.
You can run the exporter as a standalone executable binary.
In this setup, we run it as standalone executable binary on a server hosting a OpenVPN server.
Install Go
This exporter is a go-based. Hence, you need to install go on the OpenVPN server.
Download Go tarball for installation from Go download’s page.
Update the value of VER with the current Go version number.
VER=1.21.1wget https://golang.org/dl/go${VER}.linux-amd64.tar.gz
Extract it into /usr/local, creating a Go tree in /usr/local/go.
tar -C /usr/local -xzf go${VER}.linux-amd64.tar.gz
Add /usr/local/go/bin to the PATH environment variable.
vim /etc/environment
Add or update the PATH line to look like;
PATH="$PATH:/usr/local/go/bin"
Source the file to effect the changes.
source /etc/environment
Go should now be on your PATH.
which go/usr/local/go/bin/goDownload OpenVPN Exporter
Download the current OpenVPN node exporter from the Github releases page.
wget https://github.com/kumina/openvpn_exporter/archive/v0.3.0.tar.gz
Install OpenVPN Exporter
Extract the exporter to binary path.
tar xzf v0.3.0.tar.gzNext, build the OpenVPN node exporter;
cd openvpn_exporter-0.3.0/Set the path to OpenVPN server status log file;
vim main.goUpdate the path to OpenVPN status log file, openvpnStatusPaths.
...

func main() {
        var (
                listenAddress      = flag.String("web.listen-address", ":9176", "Address to listen on for web interface and telemetry.")
                metricsPath        = flag.String("web.telemetry-path", "/metrics", "Path under which to expose metrics.")
                // openvpnStatusPaths = flag.String("openvpn.status_paths", "examples/client.status,examples/server2.status,examples/server3.status", "Paths at which OpenVPN places its status files.")
                openvpnStatusPaths = flag.String("openvpn.status_paths", "/var/log/openvpn/openvpn-status.log", "Paths at which OpenVPN places its status files.")
...
Save and exit the file.
Build the exporter now;
go build -o /usr/local/bin/openvpn_exporter main.goRun OpenVPN Exporter in Standalone mode
You can run OpenVPN exporter in standalone mode;
openvpn_exporter --help -ignore.individuals
If ignoring metrics for individuals
-openvpn.status_paths string
Paths at which OpenVPN places its status files. (default "/var/log/openvpn/openvpn-status.log")
-web.listen-address string
Address to listen on for web interface and telemetry. (default ":9176")
-web.telemetry-path string
Path under which to expose metrics. (default "/metrics")
You can run in standalone mode as follows;
openvpn_exporterSample output;
2023/10/04 15:42:48 Starting OpenVPN Exporter
2023/10/04 15:42:48 Listen address: :9176
2023/10/04 15:42:48 Metrics path: /metrics
2023/10/04 15:42:48 openvpn.status_path: /var/log/openvpn/openvpn-status.log
2023/10/04 15:42:48 Ignore Individuals: false
By default, the exporter listens on TCP port 9176, hence you need to open this port on firewall to allow external connections. Refer to your respective system firewall program documentation on how to open a port for external connections.
You can press CTRL+C to stop the exporter/.
Running OpenVPN Exporter as a Service
Create a systemd service for the OpenVPN Prometheus node exporter.
cat > /etc/systemd/system/openvpn_exporter.service << 'EOF'
[Unit]
Description=Prometheus OpenVPN Node Exporter
Wants=network-online.target
After=network-online.target

[Service]
Type=simple
ExecStart=/usr/local/bin/openvpn_exporter

[Install]
WantedBy=multi-user.target
EOF
Reload the systemd manager configuration.
systemctl daemon-reload
Start and enable Node Exporter to run on system boot.
systemctl enable --now openvpn_exporter.service
Check the status;
systemctl status openvpn_exporter
● openvpn_exporter.service - Prometheus OpenVPN Node Exporter
     Loaded: loaded (/etc/systemd/system/openvpn_exporter.service; enabled; preset: enabled)
     Active: active (running) since Wed 2023-10-04 15:43:42 EDT; 6s ago
   Main PID: 9415 (openvpn_exporte)
      Tasks: 4 (limit: 2304)
     Memory: 4.9M
        CPU: 7ms
     CGroup: /system.slice/openvpn_exporter.service
             └─9415 /usr/local/bin/openvpn_exporter

Oct 04 15:43:42 debian openvpn_exporter[9415]: 2023/10/04 15:43:42 Listen address: :9176
Oct 04 15:43:42 debian openvpn_exporter[9415]: 2023/10/04 15:43:42 Metrics path: /metrics
Oct 04 15:43:42 debian openvpn_exporter[9415]: 2023/10/04 15:43:42 openvpn.status_path: /var/log/openvpn/openvpn-status.log
Oct 04 15:43:42 debian openvpn_exporter[9415]: 2023/10/04 15:43:42 Ignore Individuals: false
Oct 04 15:43:42 debian systemd[1]: Started openvpn_exporter.service - Prometheus OpenVPN Node Exporter.
Your OpenVPN connection status should be scrapped automatically.
Configure Prometheus to Scrape OpenVPN metrics;
Configure Prometheus to scrape OpenVPN Node exporter metrics;
vim /etc/prometheus/prometheus.yml
Update the config appropriately. See we added Prometheus scrape job for the OpenVPN exporter.
...
  # The job name is added as a label `job=` to any timeseries scraped from this config.
  - job_name: 'prometheus'

    # metrics_path defaults to '/metrics'
    # scheme defaults to 'http'.

    static_configs:
    - targets: ['localhost:9090']
  ## Add OpenVPNAS Exporter
  - job_name: 'openvpn-metrics'
    scrape_interval: 5s
    static_configs:
      - targets: ['192.168.56.125:9176']
Save and exit the file.
Restart Prometheus;
systemctl restart prometheus
Verify Prometheus OpenVPN Exporter Target
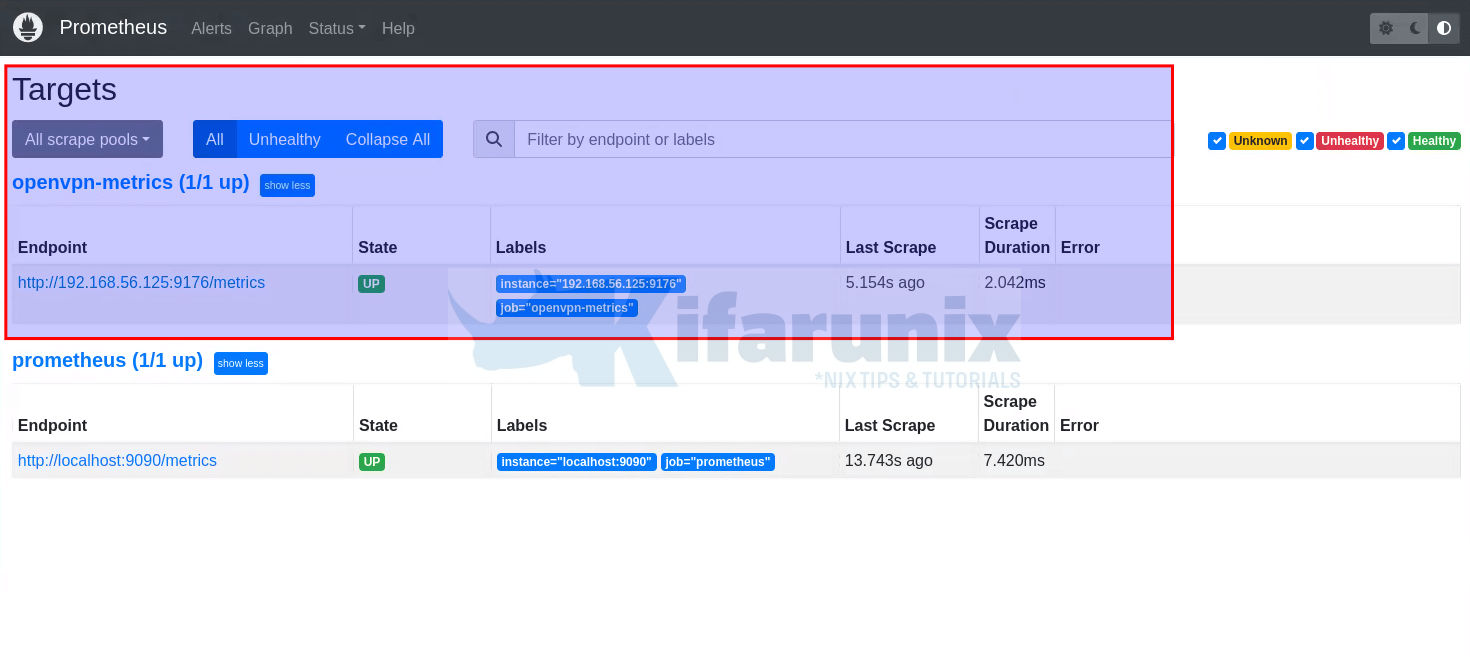
Check the Prometheus Target, http://server-IP:9090/targets.

You can click metrics path to view the metrics.
Monitoring OpenVPN Connections
Assuming you have already integrated Grafana with Prometheus data source, proceed as follows.
Create OpenVPN Node Exporter Visualization on Grafana
You can create your own visualization dashboards or utilize the community created dashboards.
For example, we use Grafana OpenVPN node exporter visualization dashboard from the Grafana community.
To import this dashboard, navigate to http://grafana-server-IP:3000/dashboard/import.
Paste the dashboard ID or JSON file, load and import it.
Ensure you also choose Prometheus as data source.
For instance, we took the the community dashboard from https://grafana.com/grafana/dashboards/10562 and modified it to fit our needs.
The dashboard requires pie-chart plugin.
Install Grafana Pie Chart Plugin by executing the command below;
grafana-cli plugins install grafana-piechart-panel
Restart Grafana;
systemctl restart grafana-server.serviceAfter modifying the above dashboard, this is how our simple OpenVPN connections dashboard looks like;

The JSON file for the above dashboard is provided below (modified version of dashboard 10562, all credit goes back to original author).
You can as well modify it to suit your needs.
Other Related Tutorials
Install and Configure Prometheus on CentOS 8
Install and Configure Prometheus on Fedora 29/Fedora 28
Install and Configure Prometheus on Debian 9


Hi
Thanks for sharing this tutorial, I would like to know how is the init of openvpn @ server on your server?
I configured the openvpn exporter, but it doesn’t export any metrics, could you tell me if you have to change anything at the server start?
Thanks a lot, that works perfect. love u
Hello,
thanks for sharing this tutorial. Currently iam facing one issue, can someone tell me what I did wrong ?
this is my error launching the exporter 2021/08/20 12:03:31 Failed to scrape showq socket: unexpected file contents: “OpenVPN CLIENT LIS”
Hi, did you try this guide already?
root@ip-172-27-184-101:~# systemctl status openvpn_exporter
● openvpn_exporter.service – Prometheus OpenVPN Node Exporter
Loaded: loaded (/etc/systemd/system/openvpn_exporter.service; enabled; vendor preset: enabled)
Active: failed (Result: exit-code) since Mon 2022-11-07 11:36:41 UTC; 1min 39s ago
Main PID: 21044 (code=exited, status=203/EXEC)
Nov 07 11:36:41 ip-172-27-184-101 systemd[1]: Started Prometheus OpenVPN Node Exporter.
Nov 07 11:36:41 ip-172-27-184-101 systemd[21044]: openvpn_exporter.service: Failed to execute command: No such file or directory
Nov 07 11:36:41 ip-172-27-184-101 systemd[21044]: openvpn_exporter.service: Failed at step EXEC spawning /usr/local/bin/openvpn_exporter: No suc
Nov 07 11:36:41 ip-172-27-184-101 systemd[1]: openvpn_exporter.service: Main process exited, code=exited, status=203/EXEC
Nov 07 11:36:41 ip-172-27-184-101 systemd[1]: openvpn_exporter.service: Failed with result ‘exit-code’.
Does this work on OpenVPN Access Server?
Didn’t try that. Maybe give a shot and see?
I did everything and everything went fine on debian 12, but on the Dashboard, the angular plugin is deprecated. Any way to replace this plugin?
Thanks a lot.
I did everything and everything went fine on debian 12, but on the Dashboard, the angular plugin is deprecated. Any way to replace this plugin?