Learn how to install Zabbix Agent on FreeBSD 12 for Zabbix monitoring.
Install and configure Zabbix server on Debian 10 Buster.
Install Zabbix 4.x from Sources on Debian 10 Buster
Install Zabbix Server from APT on Debian 10 Buster
Installing Zabbix Agent on FreeBSD 12
In order to monitor Linux hosts with Zabbix, you need to install Zabbix agents on them. In this guide, we are use FreeBSD 12 as our host for monitoring.
Run system update
pkg update
pkg upgrade
Install Zabbix Agent
Zabbix is available on the default FreeBSD 12 repositories. To check whether the latest stable version of Zabbix agent is available.
pkg search zabbix | grep agent
zabbix22-agent-2.2.23_1        Enterprise-class open source distributed monitoring (agent) LTS
zabbix22-libzbxpgsql-1.1.0_2   Zabbix agent module for comprehensive monitoring of PostgreSQL servers
zabbix3-agent-3.0.28_1         Enterprise-class open source distributed monitoring (agent) LTS
zabbix3-libzbxpgsql-1.1.0_2    Zabbix agent module for comprehensive monitoring of PostgreSQL servers
zabbix4-agent-4.0.10           Enterprise-class open source distributed monitoring (agent) LTS
zabbix42-agent-4.2.4           Enterprise-class open source distributed monitoring (agent)
As you can see, Zabbix 4.2 agent which is the current stable release is available. Hence, install it by running the command below;
pkg install zabbix42-agent-4.2.4Configure Zabbix Agent
Once the installation is done, proceed to configure Zabbix agent in order for it to communicate with Zabbix server for monitoring.
FreeBSD installs a sample Zabbix Agent configuration file as /usr/local/etc/zabbix42/zabbix_agentd.conf.sample.
Copy the sample configuration and rename it in place as;
cp /usr/local/etc/zabbix42/zabbix_agentd.conf{.sample,}Next, edit the configuration file and set the Zabbix server IP for both the passive and active checks and Zabbix agent hostname.
vim /usr/local/etc/zabbix42/zabbix_agentd.conf...
Server=192.168.43.62 ## IP for Zabbix Server
...
ServerActive=192.168.43.62
...
Hostname=freebsd12.example.comRunning Zabbix Agent
After the configuration, enable and start Zabbix agent to run on system boot.
echo 'zabbix_agentd_enable="yes"' >> /etc/rc.confservice zabbix_agentd startTo check the status;
service zabbix_agentd statuszabbix_agentd is running as pid 2996.Add FreeBSD 12 Host to Zabbix Server
The Zabbix agent is installed and running on FreeBSD 12 host server. The step is to add it to Zabbix server for monitoring.
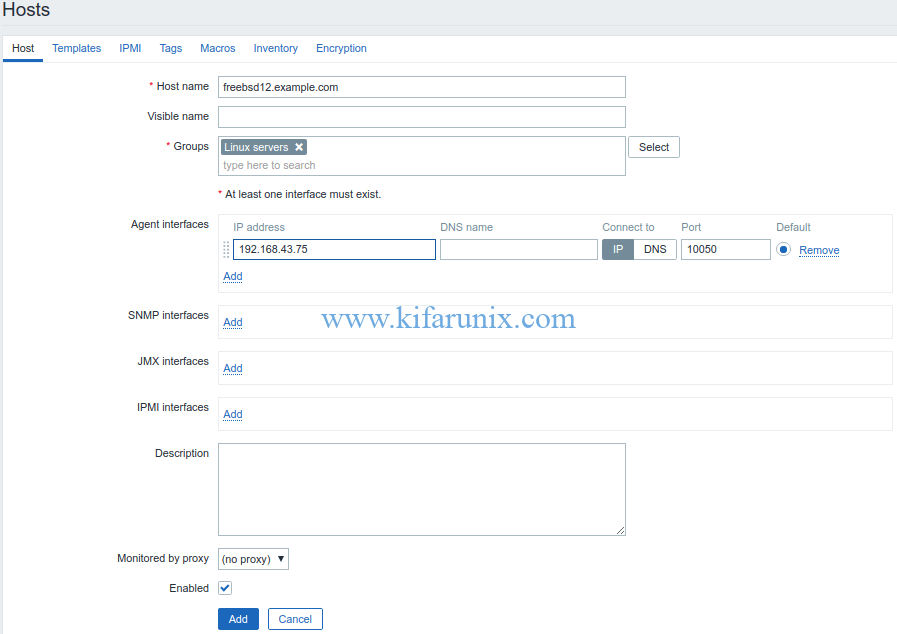
Login to Zabbix server and navigate to Configuration > Hosts > Create host to add your host.
Configure the Host details like the hostname, visible (if you want), Groups (Linux Servers for example), IP address. Other details are optional.
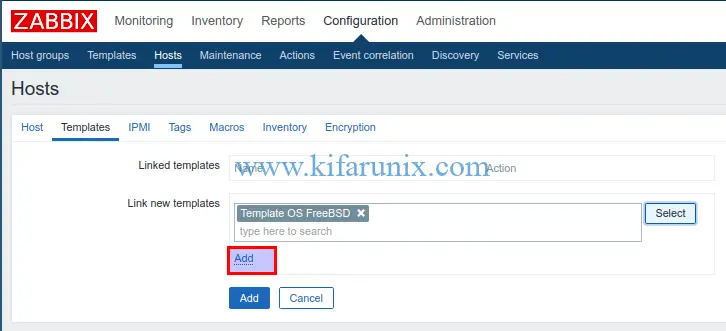
Next, you need to configure host template. Click on Templates > Link new templates. Click select button and choose Template OS FreeBSD. Once selected, click the add button to add the template.
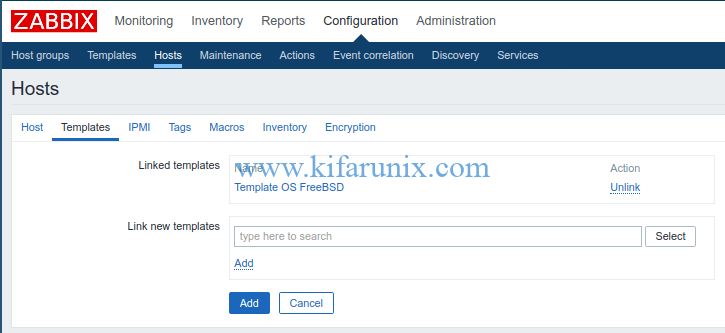
When templated is added and linked to your host, it should look like;
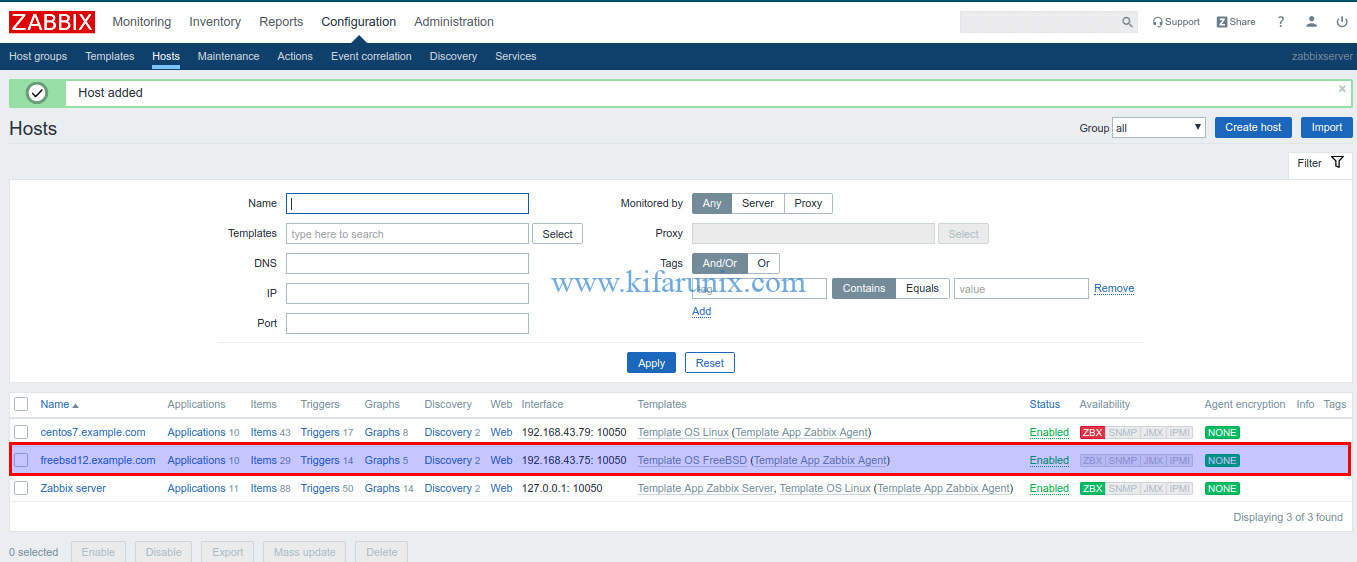
Next, click Add to add the host to Zabbix server. The list of hosts is then displayed. You can learn more about Zabbix templates on Zabbix Documentation page.
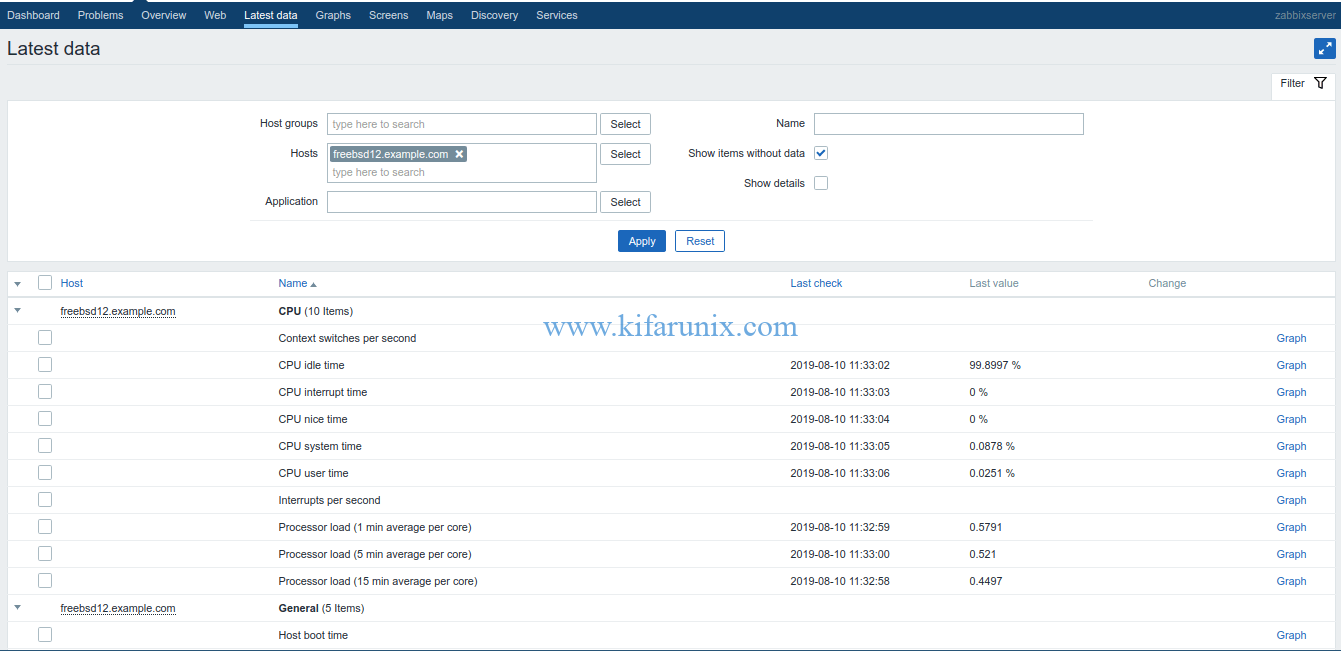
FreeBSD 12 is now added to Zabbix server for monitoring. To check for the data collected from the host, click Monitoring > Latest data. Select the host and click Apply.
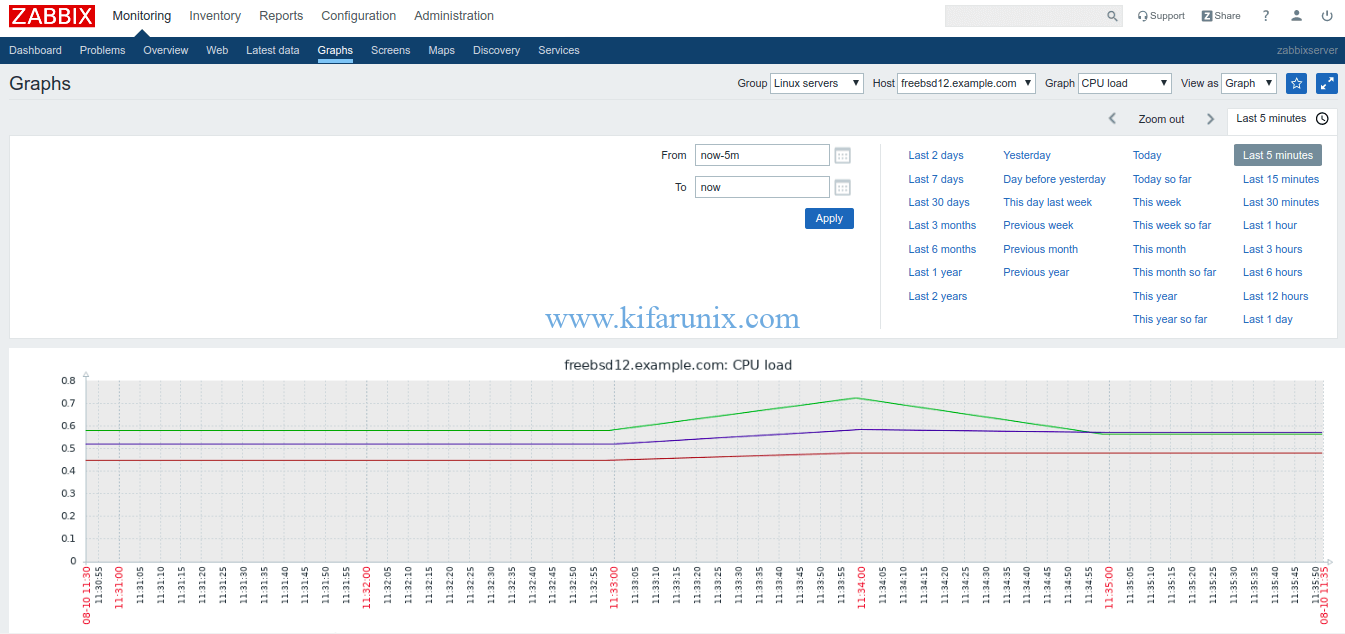
You can also check the data graphs. Click Monitoring > Graphs > Group (Linux Servers) > Graph (say, CPU Load) > Host (freebsd12.example.com) > View as (Graph). Select the time range, last 1 hour
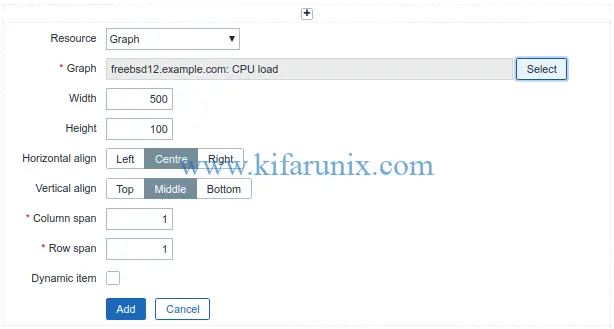
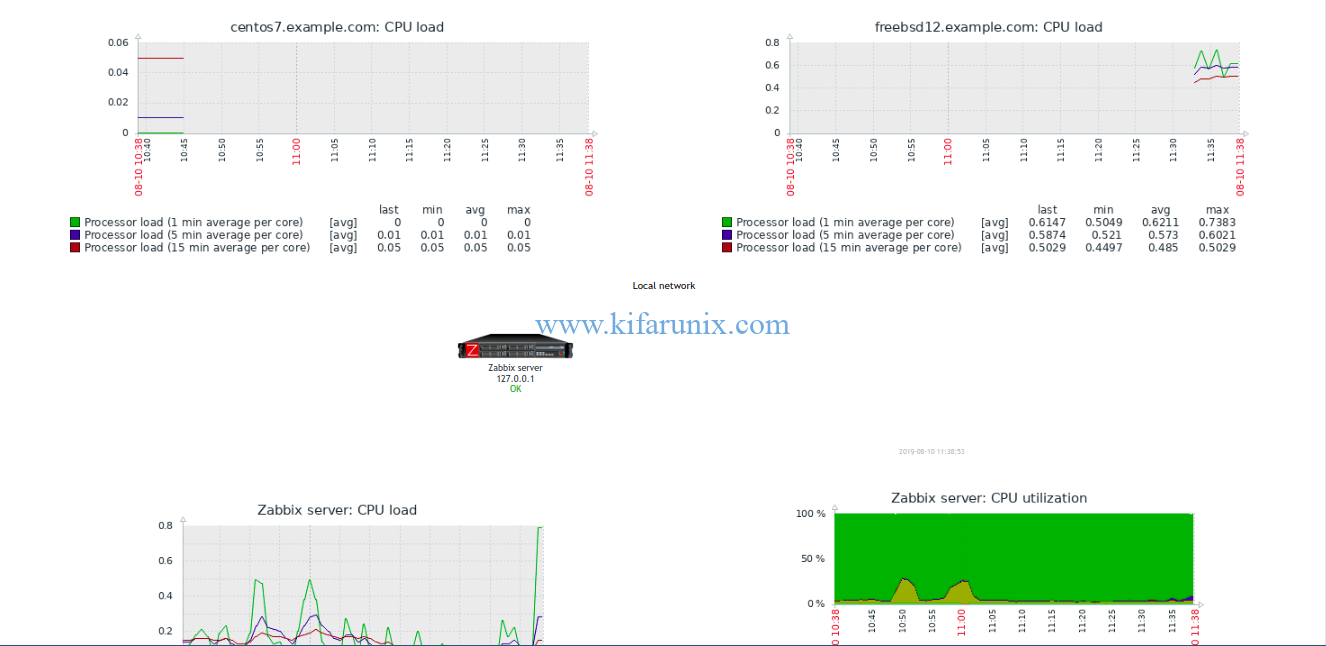
You can also add the graphs to Zabbix Screens. Click on Screens > Edit Screens. Click the plus (+) on wherever you want to add your graph and click change. Screen configuration wizard opens up. Choose the graph to add to your screen, for example, CPU Load.
You can leave other settings as default and click Add to create the graph. You can add as many resources to your screen as possible.
Related Tutorials;
Install Zabbix Agent on Debian 10 Buster
Install Zabbix Agent on CentOS 7 for Zabbix Monitoring
How to Install Nagios Plugins and NRPE agents on CentOS 7/RHEL 7/Fedora 29
How to Install Nagios Plugins From Source RHEL/CentOS/Oracle Linux


Thanks for this information. I found it very helpful installing the Zabbix agent on my my XigmasNAS server (FreeBSD v.11). My Zabbix server runs the prebuilt VHD appliance on Win Server 2012R2.