In this guide, we are going to learn how to install Zabbix Agent on Debian 10 Buster for Zabbix monitoring. Before you can continue, you need to setup Zabbix server first. Follow the links below to install and configure Zabbix server on Debian 10 Buster.
Install Zabbix 4.x from Sources on Debian 10 Buster
Install Zabbix Server from APT on Debian 10 Buster
Installing Zabbix Agent on Debian 10 Buster
Update and upgrade your system packages.
apt updateDownload and Install Zabbix Repository
wget https://repo.zabbix.com/zabbix/4.2/debian/pool/main/z/zabbix-release/zabbix-release_4.2-1+buster_all.deb
apt install ./zabbix-release_4.2-1+buster_all.deb
Resynchronize system packages;
apt updateInstall Zabbix Agent
apt install zabbix-agentConfigure Zabbix Agent
Once the installation is done, proceed to configure Zabbix agent in order for it to communicate with Zabbix server for monitoring.
The default zabbix agent configuration file is /etc/zabbix/zabbix_agentd.conf.
Edit the configuration file and set the Zabbix server IP for both the passive and active checks and Zabbix agent hostname.
vim /etc/zabbix/zabbix_agentd.conf...
Server=192.168.43.62 ## IP for Zabbix Server
...
ServerActive=192.168.43.62
...
Hostname=debian10.example.comIf UFW is installed and running, allow Zabbix ports for passive checks.
ufw allow 10050/tcpRunning Zabbix Agent
After the installation, Zabbix agent is started and enabled to run on system boot. Hence, you can restart it by running the command below;
systemctl restart zabbix-agentTo check the status;
systemctl status zabbix-agent
● zabbix-agent.service - Zabbix Agent
   Loaded: loaded (/lib/systemd/system/zabbix-agent.service; disabled; vendor preset: enabled)
   Active: active (running) since Sat 2019-08-10 05:05:32 EDT; 2s ago
  Process: 3024 ExecStart=/usr/sbin/zabbix_agentd -c $CONFFILE (code=exited, status=0/SUCCESS)
 Main PID: 3026 (zabbix_agentd)
    Tasks: 6 (limit: 2348)
   Memory: 4.1M
   CGroup: /system.slice/zabbix-agent.service
           ├─3026 /usr/sbin/zabbix_agentd -c /etc/zabbix/zabbix_agentd.conf
           ├─3027 /usr/sbin/zabbix_agentd: collector [idle 1 sec]
           ├─3028 /usr/sbin/zabbix_agentd: listener #1 [waiting for connection]
           ├─3029 /usr/sbin/zabbix_agentd: listener #2 [waiting for connection]
           ├─3030 /usr/sbin/zabbix_agentd: listener #3 [waiting for connection]
           └─3031 /usr/sbin/zabbix_agentd: active checks #1 [idle 1 sec]
Add Debian 10 Host to Zabbix Server
The Zabbix agent is installed and running on Debian 10 Buster host. Next add it agent to the Zabbix server for monitoring.
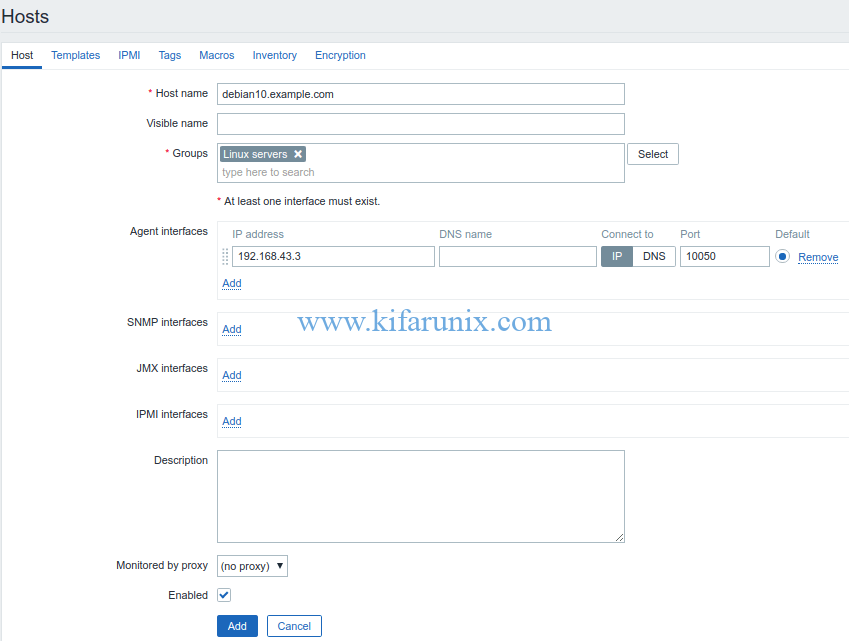
Login to Zabbix server and navigate to Configuration > Hosts > Create host to add your host.
Configure the Host details like the hostname, visible (if you want), Groups (Linux Servers for example), IP address. Other details are optional.
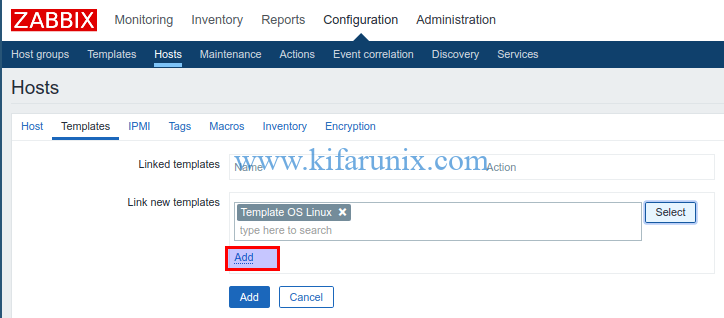
Next, you need to configure host template. Click on Templates > Link new templates. Click select button and choose Template OS Linux. Once selected, click the add button to add the template.
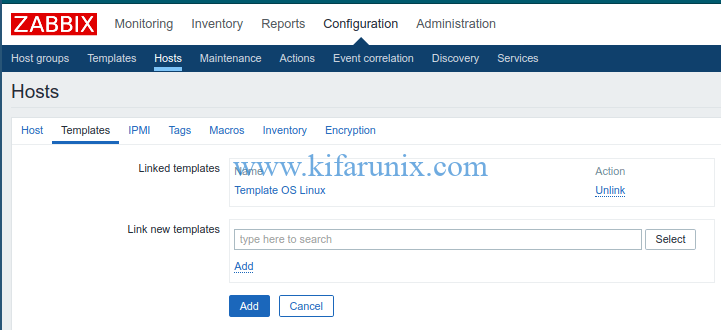
When templated is added and linked to your host, it should look like;
You can learn more about Zabbix templates on Zabbix Documentation page.
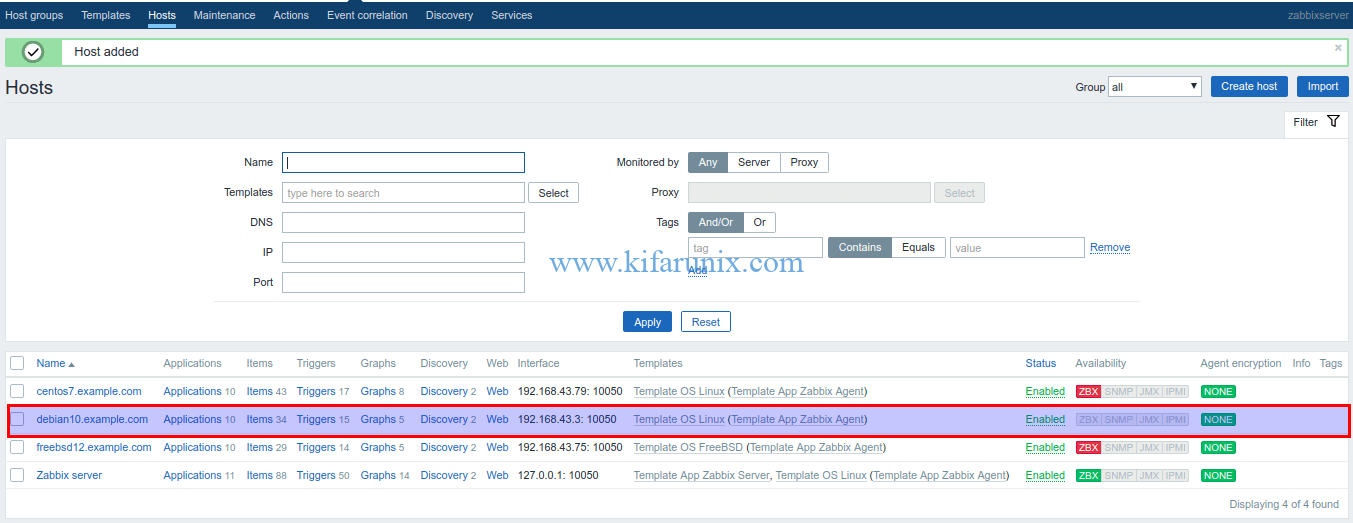
Next, click Add to add the host to Zabbix server. The list of hosts is then displayed.
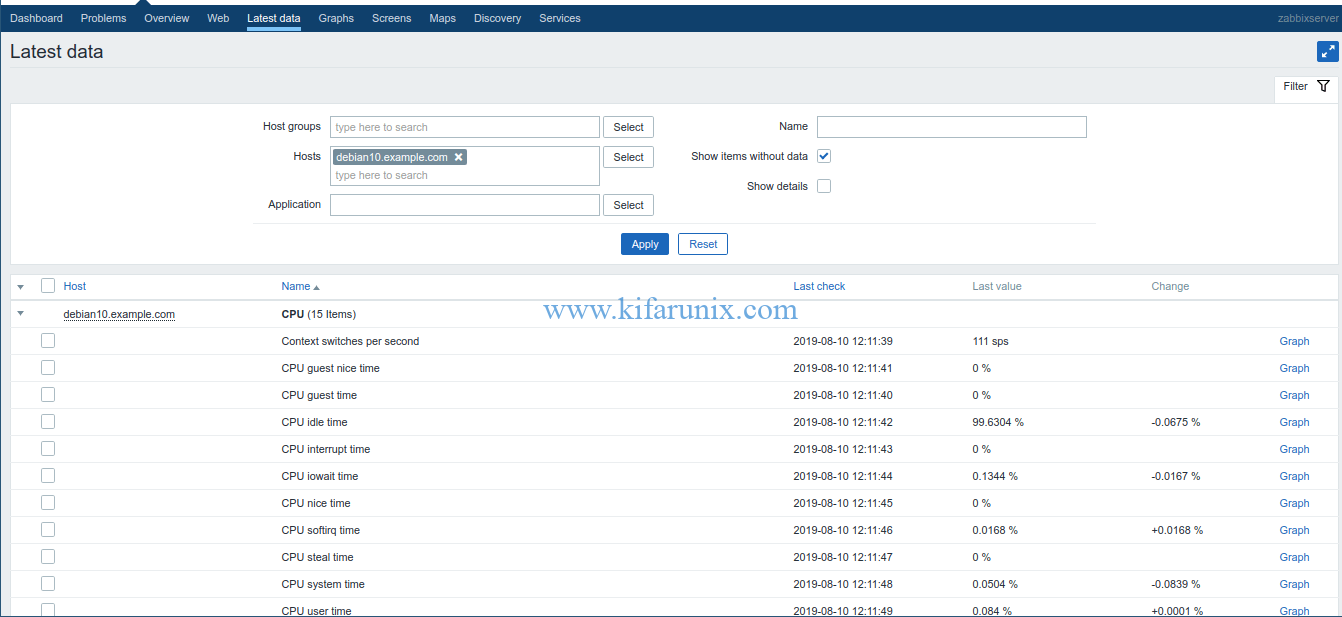
Your Debian 10 Buster is now added to Zabbix server for monitoring. To check for the data collected from the host, click Monitoring > Latest data. Select the host and click Apply.
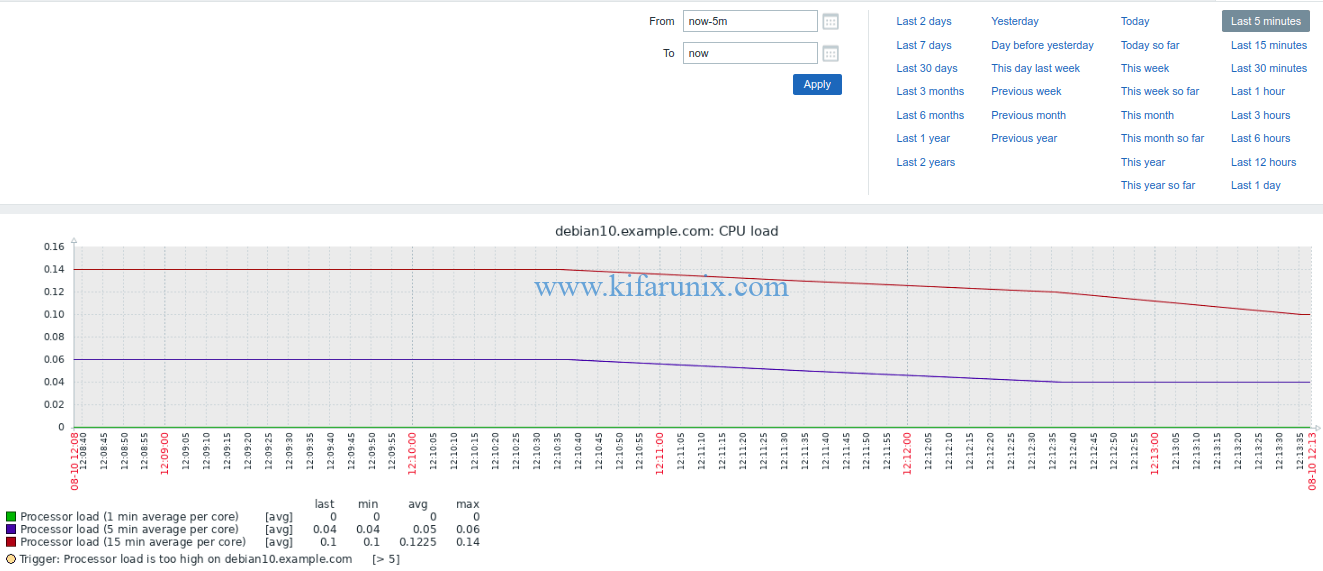
You can also check the data graphs. Click Monitoring > Graphs > Group (Linux Servers) > Graph (say, CPU Load) > Host (centos7.example.com) > View as (Graph). Select the time range, last 1 hour
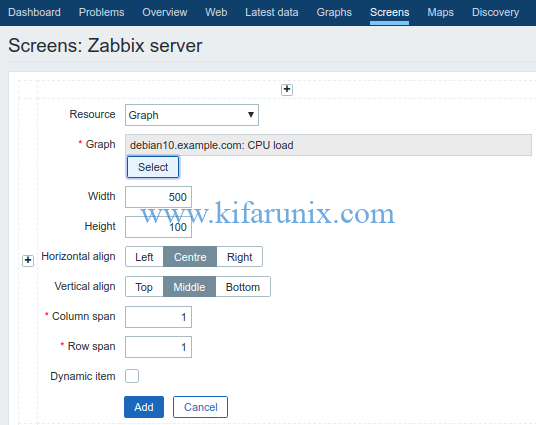
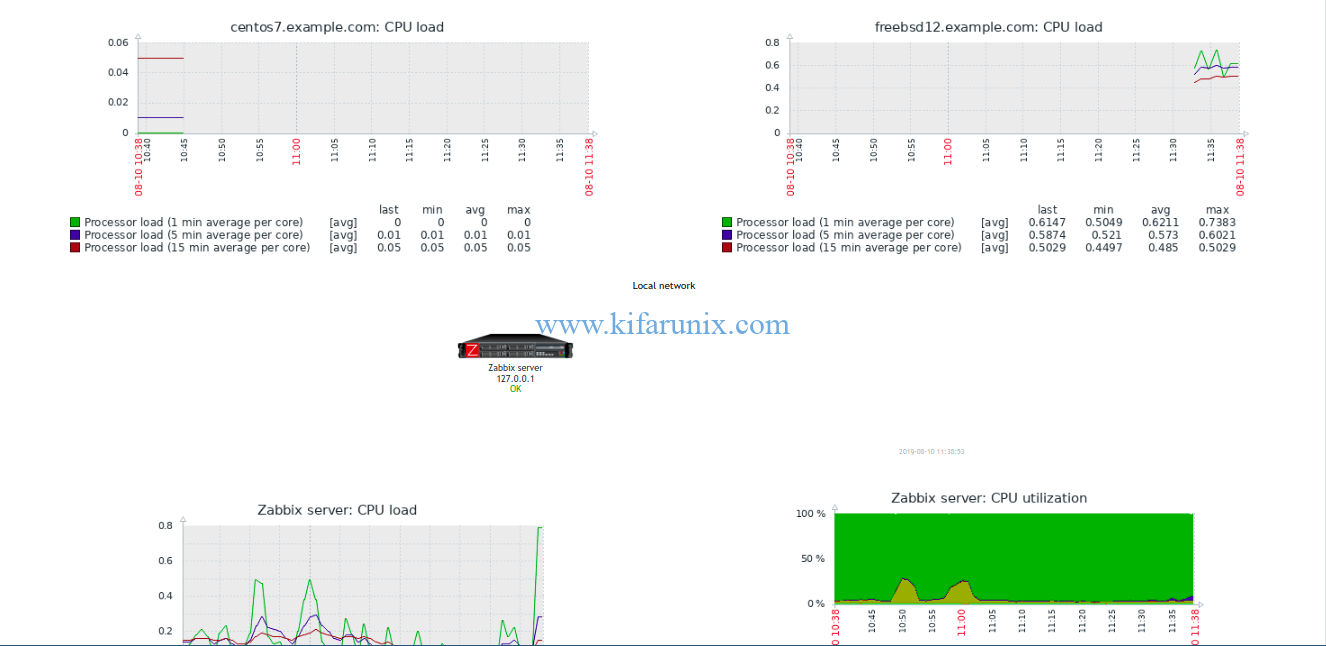
You can also add the graphs to Zabbix Screens. Click on Screens > Edit Screens. Click the plus (+) on wherever you want to add your graph and click change. Screen configuration wizard opens up. Choose the graph to add to your screen, for example, CPU Load.
You can leave other settings as default and click Add to create the graph. You can add as many resources to your screen as possible.
Well, that is just it on installing Zabbix Agent on Debian 10 Buster for Zabbix monitoring.
Related Tutorials;
Install Zabbix Agent on CentOS 7 for Zabbix Monitoring
Install Zabbix Agent on FreeBSD 12
How to Install Nagios Plugins and NRPE agents on CentOS 7/RHEL 7/Fedora 29
How to Install Nagios Plugins From Source RHEL/CentOS/Oracle Linux


Hi koromicha,
How do I configure the Zabbix-Agent in Active-Mode?
Hi Remo,
Well, When you install zabbix agent on an endpoint to be monitored, then that is zabbix active monitoring.
Ok,
thanks, but inside /etc/zabbix/zabbix_agentd.conf What should I write? Nothing?
At the very least, the Zabbix server IP and maybe the hostname of the endpoint being monitored.