In this guide, we are going to learn how to install and setup TIG stack on Fedora 30 for monitoring system metrics such as memory, disk, logged in users, system load, swap usage, system uptime, system processes. TIG stack is a group of powerful open-source monitoring tools, Telegraf, InfluxDB and Grafana where;
- Telegraf is an open-source server agent for collecting and sending metrics and events from databases, systems, and IoT sensors.
- InfluxDB is an open-source time series database and provides datastore for metrics, events, and real-time analytics.
- Grafana is a data visualization and monitoring tool and supports time series datastores such as Graphite, InfluxDB, Prometheus, Elasticsearch.
Install and Setup TIG Stack on Fedora 30
In order to setup TIG stack on Fedora 30, you need to install and configure each component of the stack. We have already covered the installation of Telegraf and InfluxDB on Fedora 30 in our previous guides. See the links below for the installation procedure.
Install Telegraf on Fedora 30/Fedora 29
Install InfluxDB on Fedora 30/Fedora 29
Install Grafana on Fedora 30
Grafana can be installed on Fedora 30 using the RPM binary package or directly via Grafana repository using DNF package manager. To install using an RPM binary package,
dnf install https://dl.grafana.com/oss/release/grafana-5.4.2-1.x86_64.rpmTo install Grafana from Grafana repository, you need to create the repository as shown below;
cat > /etc/yum.repos.d/grafana.repo << EOF
[grafana]
name=grafana
baseurl=https://packages.grafana.com/oss/rpm
repo_gpgcheck=1
enabled=1
gpgcheck=1
gpgkey=https://packages.grafana.com/gpg.key
sslverify=1
sslcacert=/etc/pki/tls/certs/ca-bundle.crt
EOF
Then install Grafana via the dnf command.
dnf install grafanaStart the Grafana server and enable it to run on boot.
systemctl status grafana-server
systemctl enable grafana-server
Open Grafana port on firewalld to allow external access.
firewall-cmd --add-port=3000/tcp --permanent
firewall-cmd --reload
You can now access Grafana via the address http://server-IP:3000. The default credentials for username and password are admin. Reset the password when prompted and proceed to Grafana dashboard.
Learn how to Install Grafana on Fedora 29, Debian 9, Ubuntu 18.04 by following the links below;
- Install Grafana Monitoring Tool on Fedora 29
- Install Grafana Metrics Monitoring Tool on Debian 9
- Install Grafana Data Visualization Tool on Ubuntu 18.04
Configure TIG Stack on Fedora 30
Create InfluxDB Database and User
Once you have installed InfluxDB, you need to create a database that will used to store the time series metrics collected by the Telegraf agent. Hence, connect to InfluxDB and create a database and databaseas shown below;
influxConnected to http://localhost:8086 version 1.7.6
InfluxDB shell version: 1.7.6
Enter an InfluxQL query
> create database telegraf
> use telegraf
Using database telegraf
> create user telegraf with password 'StrongP@SS'You can verify this by running the commands below;
> show databases
name: databases
name
----
_internal
telegraf
> show users
user     admin
----     -----
telegraf false
>
Test connection to the database using the username and password created.
influx -username 'telegraf' -password 'StrongP@SS' -database telegrafConnected to http://localhost:8086 version 1.7.6
InfluxDB shell version: 1.7.6
Enter an InfluxQL query
> Configuring Telegraf
Once the installation of Telegraf is done, proceed with configuration. Telegraf is plugin-driven with 4 distinct plugin types:
- Input Plugins collect metrics from the system, services
- Processor Plugins transform, decorate, and/or filter metrics
- Aggregator Plugins create aggregate metrics (e.g. mean, min, max, quantiles, etc.)
- Output Plugins write metrics to various destinations such as InfluxDB for our case.
Well, in this guide, we are going to configure TIG stack to monitor system memory usage, system processes, disk usage, system load, system uptime and logged in users.
The default configuration file for Telegraf is /etc/telegraf/telegraf.conf. Before we can continue, we will make a backup of the default configuration.
mv /etc/telegraf/telegraf.conf /etc/telegraf/telegraf.conf.bakNext, create a new configuration with your specific metrics. To generate a configuration file, Telegraf provides a command line tool, telegraf, that can be used to define specific input plugins, output plugins.
For example to to generate a configuration file with input plugins such as system memory usage, cpu, swap, load, logged in users, processes and define output as InfluxDB, run the command below;
telegraf config -input-filter cpu:mem:swap:system:processes -output-filter influxdb > /etc/telegraf/telegraf.confNext, edit the configuration file to define the URL for InfluxDB, the metrics database, the user and password to connect to metrics database such that your Telegraf configuration file looks like below without comment lines.
[global_tags]
[agent]
  interval = "10s"
  round_interval = true
  metric_batch_size = 1000
  metric_buffer_limit = 10000
  collection_jitter = "0s"
  flush_interval = "10s"
  flush_jitter = "0s"
  precision = ""
  debug = false
  quiet = false
  logfile = ""
  hostname = ""
  omit_hostname = false
[[outputs.influxdb]]
  urls = ["http://127.0.0.1:8086"]
  database = "telegraf"
  username = "telegraf"
  password = "StrongP@SS"
[[inputs.cpu]]
  percpu = true
  totalcpu = true
  collect_cpu_time = false
  report_active = false
[[inputs.disk]]
  ignore_fs = ["tmpfs", "devtmpfs", "devfs", "overlay", "aufs", "squashfs"]
[[inputs.diskio]]
[[inputs.kernel]]
[[inputs.mem]]
[[inputs.processes]]
[[inputs.swap]]
[[inputs.system]]
To learn more options used, check Telegraf administration configuration page.
Once you are done with Telegraf configuration, restart it.
systemctl restart telegrafTelegraf configuration tests
Telegraf enables you to run configuration tests outputing metrics to stdout. To run a general test for all metrics defined;
telegraf --config telegraf.conf --testTo run configuration test for a specific metric for example, system input plugin;
telegraf -test -config /etc/telegraf/telegraf.conf --input-filter system2019-05-08T03:01:29Z I! Starting Telegraf 1.10.3
> system,host=fedora30.example.com load1=0,load15=0,load5=0,n_cpus=1i,n_users=2i 1557284489000000000
> system,host=fedora30.example.com uptime=33495i 1557284489000000000
> system,host=fedora30.example.com uptime_format=" 9:18" 1557284489000000000Configure Grafana
Add Data source
Login to Grafana dashboard as admin with your new password.
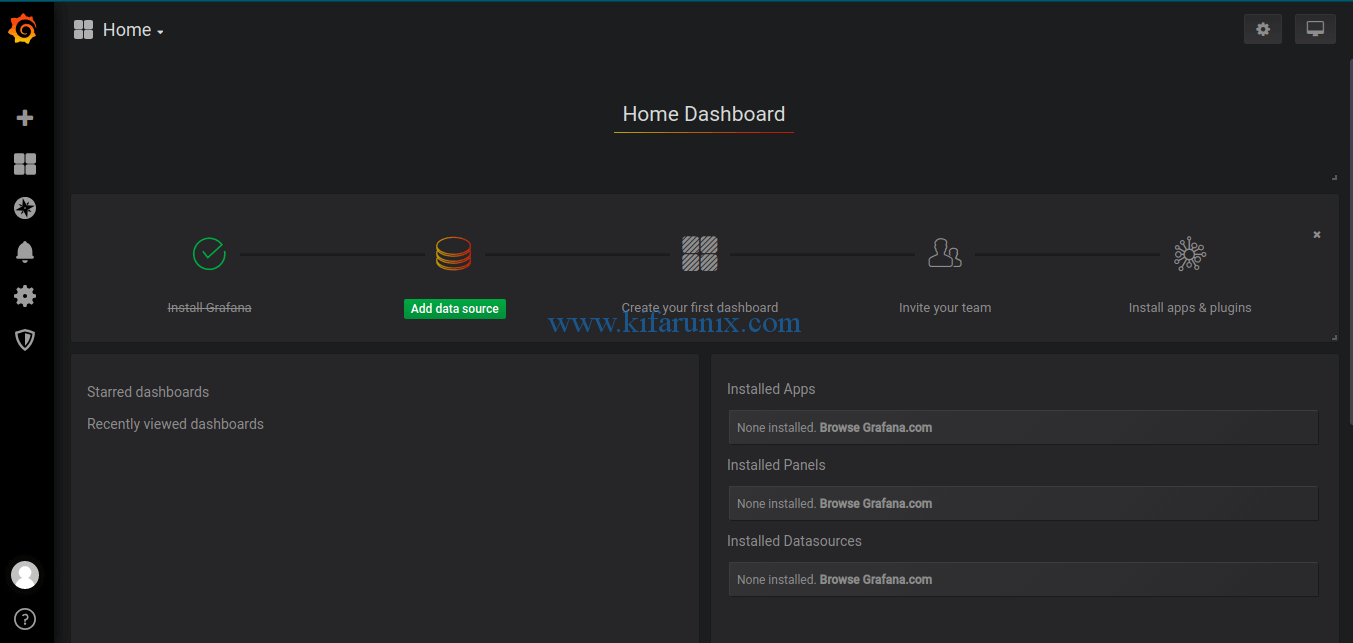
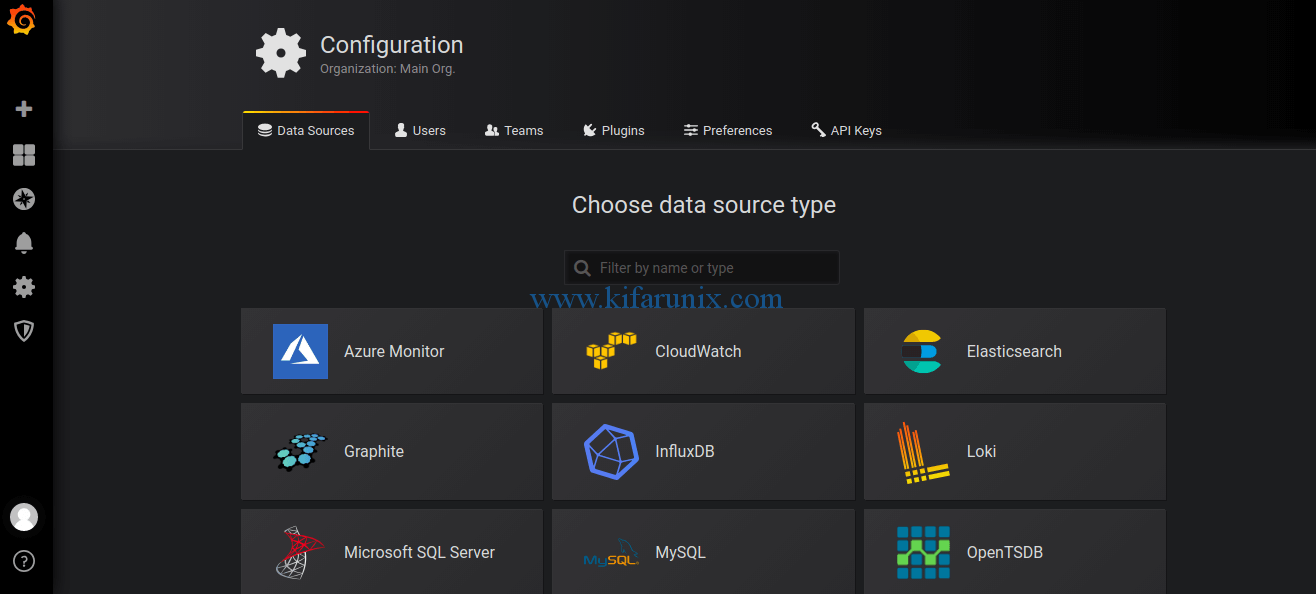
Next, you need to add the data source. In this case, our data source is InfluxDB, hence click on Add data source and select InfluxDB.
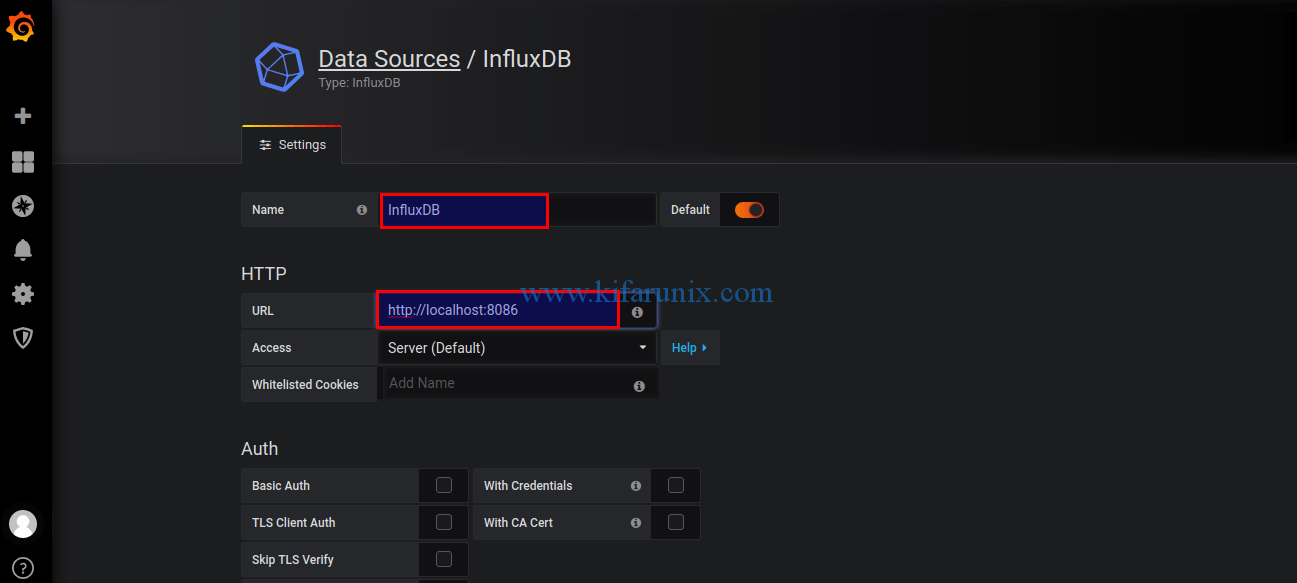
Set the Name and URL of the InfuxDB data source (Leave it as http://localhost:8086 for local connection).
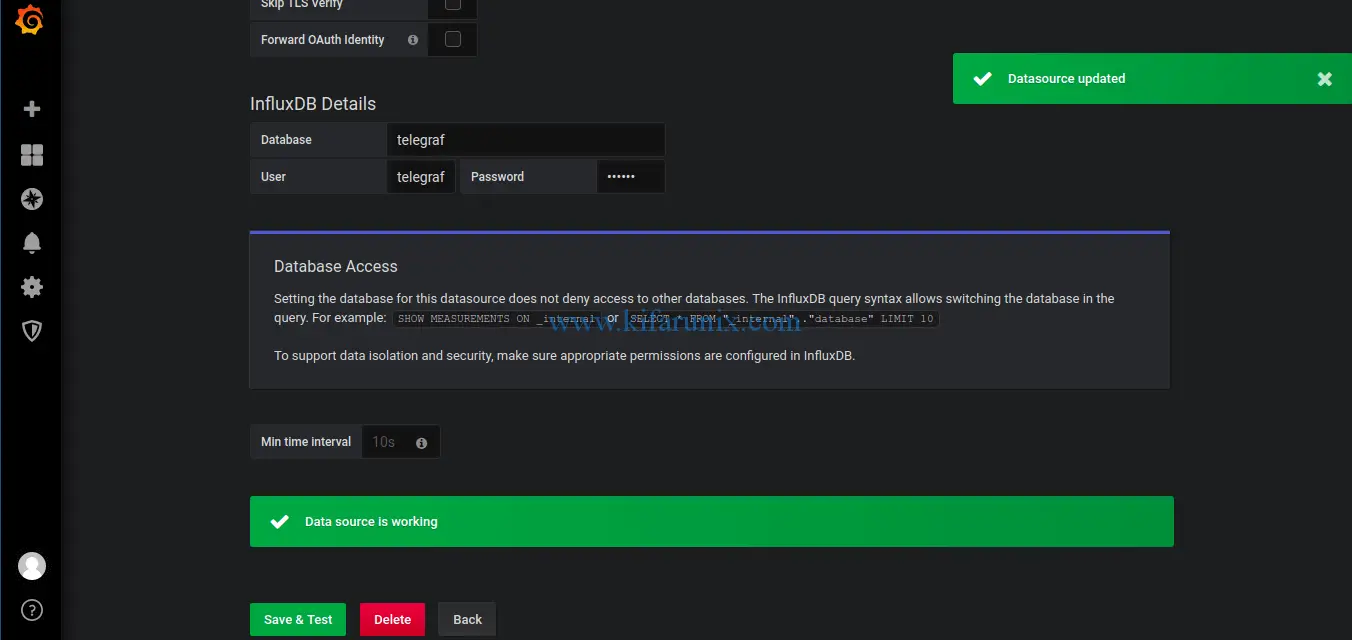
Scroll down and set the InfluxDB database connection details defined above.
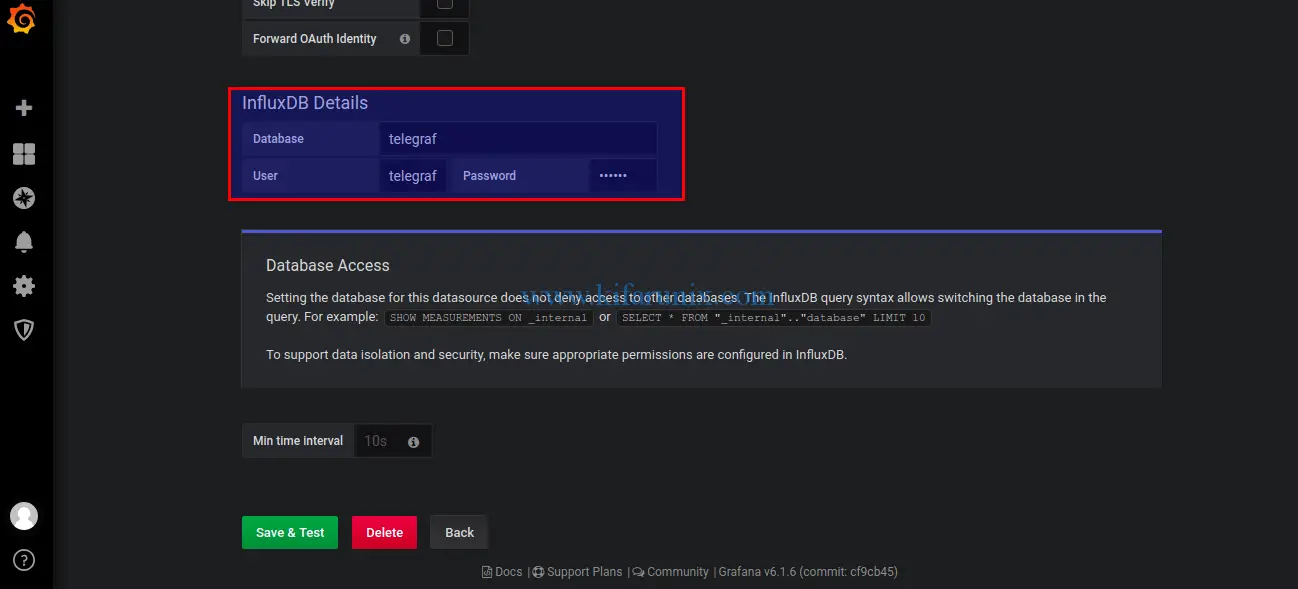
Next, click on Save & Test to test the connection to the InfluxDB database.
Setup Grafana Dashboard
You can either create your own dashboards or import an already customized dashboard from Grafana community. In this guide, we are going to download a dashboard that a user jmutai has customized. All credit goes back to him.
Hence, click the plus (+) on the left panel and select import. After that, copy the ID of the dashboard and paste it as shown in the screenshot below.
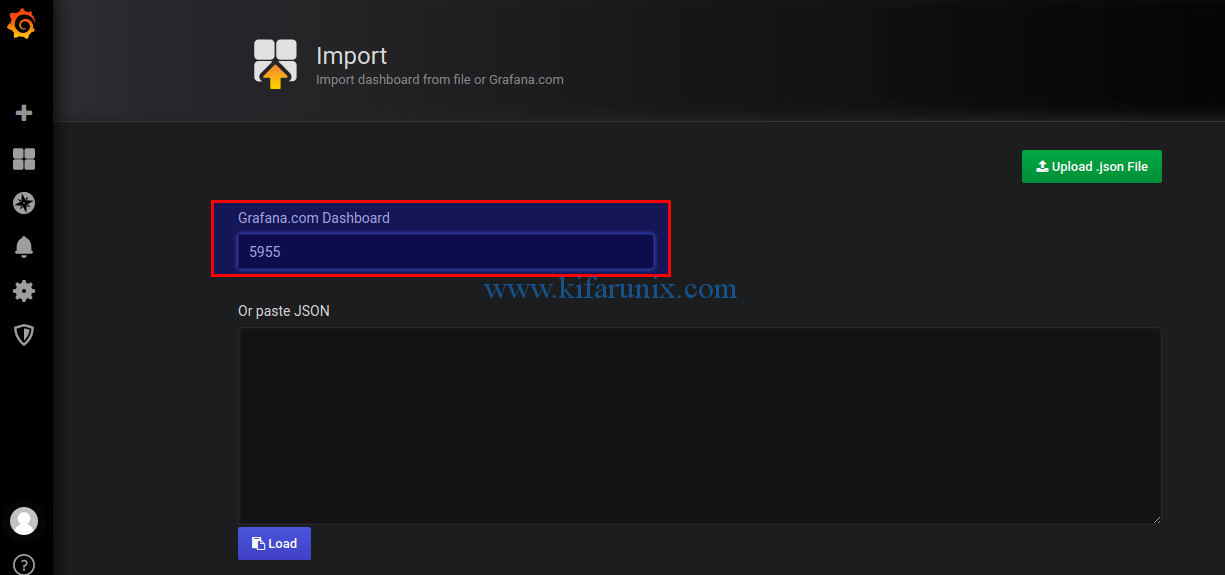
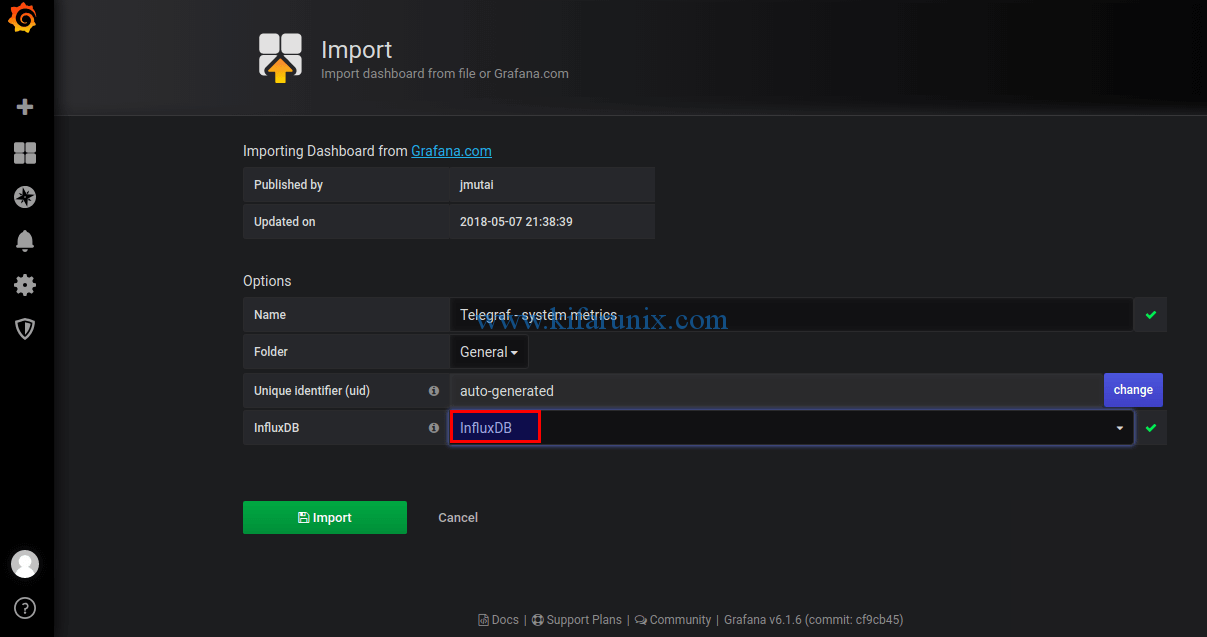
After a few, location of the Grafana dashboard to import is updated. Next, select the InfluxDB data source and import the dashboard.
Immediately your dashboard is imported, you should be able to see your dashboards.
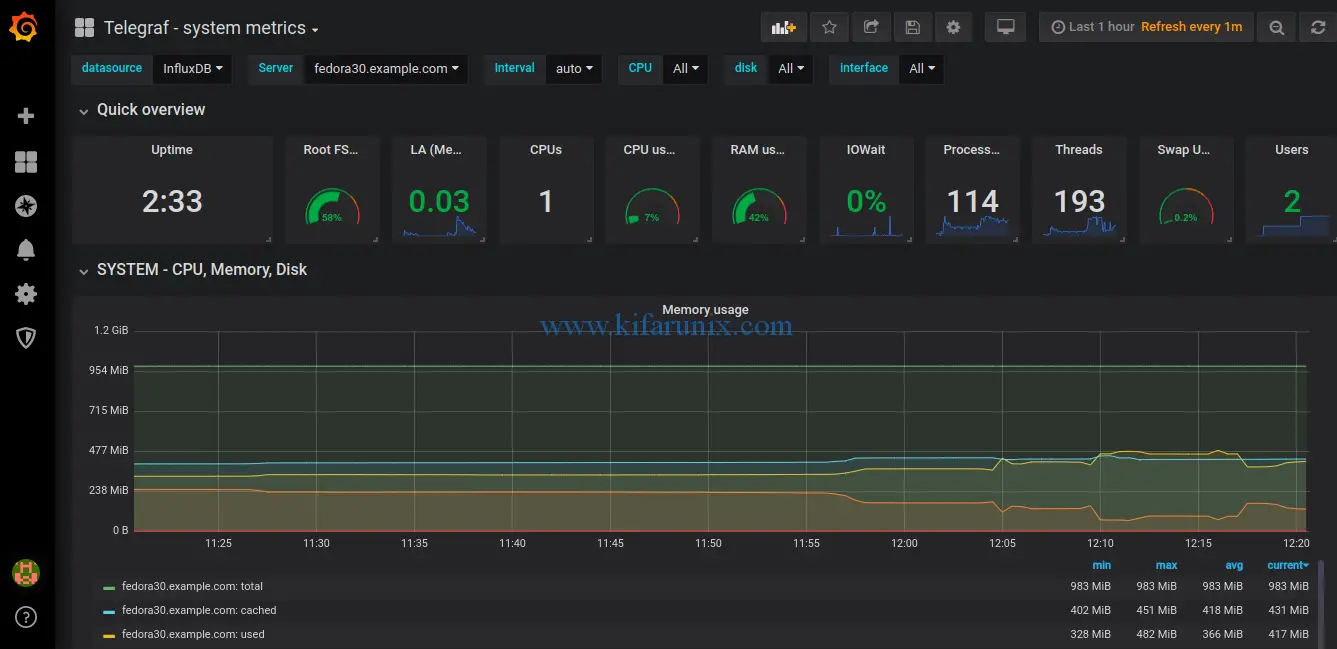
You have successfully installed and setup TIG Stack on Fedora 30 for collecting and monitoring system metrics. Feel free to explore this awesome monitoring tools.
You can also check how to install and setup TIG stack on Ubuntu 20.04 by following the link below;
Install and Setup TIG Stack on Ubuntu 20.04
Want to also try Elastic stack on Ubuntu 18.04? See our guide by following the link below.

