In this guide, we are going to learn how to install Grafana Data Visualization Tool on Ubuntu 18.04. Grafana is the open source analytics & monitoring solution for every database.
Table of Contents
Installing Grafana on Ubuntu 18.04
There exist Grafana Enterprise and Grafana opensource (OSS).
We will be installing Grafana OSS version in this guide.
Grafana can be installed using the DEB binary or directly from the APT repository.
Run System Update
Before you can proceed to install Grafana on Ubuntu 18.04, ensure that your system packages are up-to-date.
sudo apt updateInstalling Grafana using DEB Package
To install Grafana on Ubuntu 18.04 using DEB binary package;
- Navigate to Grafana downloads page;
- Select the current release version of Grafana
- Select the edition, Enterprise or OSS (this guide installs OSS)
- Copy the Grafana download and execute it on the system you are installing Grafana on;
wget https://dl.grafana.com/oss/release/grafana_9.4.7_amd64.debOnce the download is done, verify the integrity of the downloaded package by calculating its checksum and comparing it to the one provided on the downloads page;
Update the version according to the current releases.
VER=9.4.7sha256sum grafana_${VER}_amd64.deb Compare the resulting hash value with the value on the download’s page.
If all is well, proceed to install Grafana on Ubuntu 18.04 as shown below;
sudo apt install ./grafana_${VER}_amd64.debReading package lists... Done
Building dependency tree... Done
Reading state information... Done
Note, selecting 'grafana' instead of './grafana_9.4.7_amd64.deb'
The following additional packages will be installed:
fontconfig-config fonts-dejavu-core libfontconfig1
The following NEW packages will be installed:
fontconfig-config fonts-dejavu-core grafana libfontconfig1
0 upgraded, 4 newly installed, 0 to remove and 79 not upgraded.
Need to get 1,202 kB/85.2 MB of archives.
After this operation, 312 MB of additional disk space will be used.
Do you want to continue? [Y/n] y
Installing Grafana from APT Repository
To install Grafana from APT repository;
- Install Grafana OSS APT repository by running the command below;
sudo apt install software-properties-common curl gnupg2 -yecho "deb https://packages.grafana.com/oss/deb stable main" | sudo tee /etc/apt/sources.list.d/grafana.list- Install Grafana OSS APT repo GPG signing key.
curl -s https://packages.grafana.com/gpg.key | sudo gpg --dearmor > /etc/apt/trusted.gpg.d/grafana.gpg- After that, re-synchronize your system packages to the latest versions and install Grafana.
sudo apt update
sudo apt install grafana- Verify the installed version of Grafana.
apt show grafanaPackage: grafana
Version: 9.4.7
Priority: optional
Section: default
Maintainer: [email protected]
Installed-Size: 309 MB
Depends: adduser, libfontconfig1
Homepage: https://grafana.com
License: AGPLv3
Vendor: Grafana
Download-Size: 84.0 MB
APT-Manual-Installed: yes
APT-Sources: https://packages.grafana.com/oss/deb stable/main amd64 Packages
Description: Grafana
Running Grafana on Ubuntu 18.04
Once the installation is done, reload systemd unit configuration files and start and enable Grafana to run on system boot.
sudo systemctl daemon-reloadsudo systemctl enable grafana-server --now
You can check the status;
systemctl status grafana-server● grafana-server.service - Grafana instance
Loaded: loaded (/usr/lib/systemd/system/grafana-server.service; enabled; vendor preset: enabled)
Active: active (running) since Sun 2023-03-26 10:55:54 UTC; 11s ago
Docs: http://docs.grafana.org
Main PID: 5148 (grafana)
Tasks: 5 (limit: 2314)
CGroup: /system.slice/grafana-server.service
└─5148 /usr/share/grafana/bin/grafana server --config=/etc/grafana/grafana.ini --pidfile=/run/grafana/grafana-server.pid --packaging=deb cfg:default.paths.logs=/
Mar 26 10:56:04 osboxes grafana[5148]: logger=migrator t=2023-03-26T10:56:04.694526782Z level=info msg="Executing migration" id="Add index for dashboard_id in dashboard_tag
Mar 26 10:56:04 osboxes grafana[5148]: logger=migrator t=2023-03-26T10:56:04.814790312Z level=info msg="Executing migration" id="Update dashboard table charset"
Mar 26 10:56:04 osboxes grafana[5148]: logger=migrator t=2023-03-26T10:56:04.969435137Z level=info msg="Executing migration" id="Update dashboard_tag table charset"
Mar 26 10:56:05 osboxes grafana[5148]: logger=migrator t=2023-03-26T10:56:05.101265042Z level=info msg="Executing migration" id="Add column folder_id in dashboard"
Mar 26 10:56:05 osboxes grafana[5148]: logger=migrator t=2023-03-26T10:56:05.244748848Z level=info msg="Executing migration" id="Add column isFolder in dashboard"
Mar 26 10:56:05 osboxes grafana[5148]: logger=migrator t=2023-03-26T10:56:05.387277739Z level=info msg="Executing migration" id="Add column has_acl in dashboard"
Mar 26 10:56:05 osboxes grafana[5148]: logger=migrator t=2023-03-26T10:56:05.530016602Z level=info msg="Executing migration" id="Add column uid in dashboard"
Mar 26 10:56:05 osboxes grafana[5148]: logger=migrator t=2023-03-26T10:56:05.672765618Z level=info msg="Executing migration" id="Update uid column values in dashboard"
Mar 26 10:56:05 osboxes grafana[5148]: logger=migrator t=2023-03-26T10:56:05.805234882Z level=info msg="Executing migration" id="Add unique index dashboard_org_id_uid"
Mar 26 10:56:05 osboxes grafana[5148]: logger=migrator t=2023-03-26T10:56:05.936297751Z level=info msg="Executing migration" id="Remove unique index org_id_slug"
You can check the logs on;
tail -f /var/log/grafana/grafana.logAccess Grafana UI
Grafana listens on TCP port 3000 by default;
ss -altnp | grep grafanaLISTEN 0 128 *:3000 *:* users:(("grafana",pid=5148,fd=9))To access Grafana UI, navigate to the browser and enter the address, http://localhost:3000.
To access Grafana from an externally, use the address, http://grafana-server-IP:3000.
However, for external access, you need to open TCP port 3000 on UFW if it is running.
sudo ufw allow 3000/tcpIf using iptables;
sudo iptables -p tcp -m tcp --dport 3000 -j ACCEPTLogin as admin for both username and password.

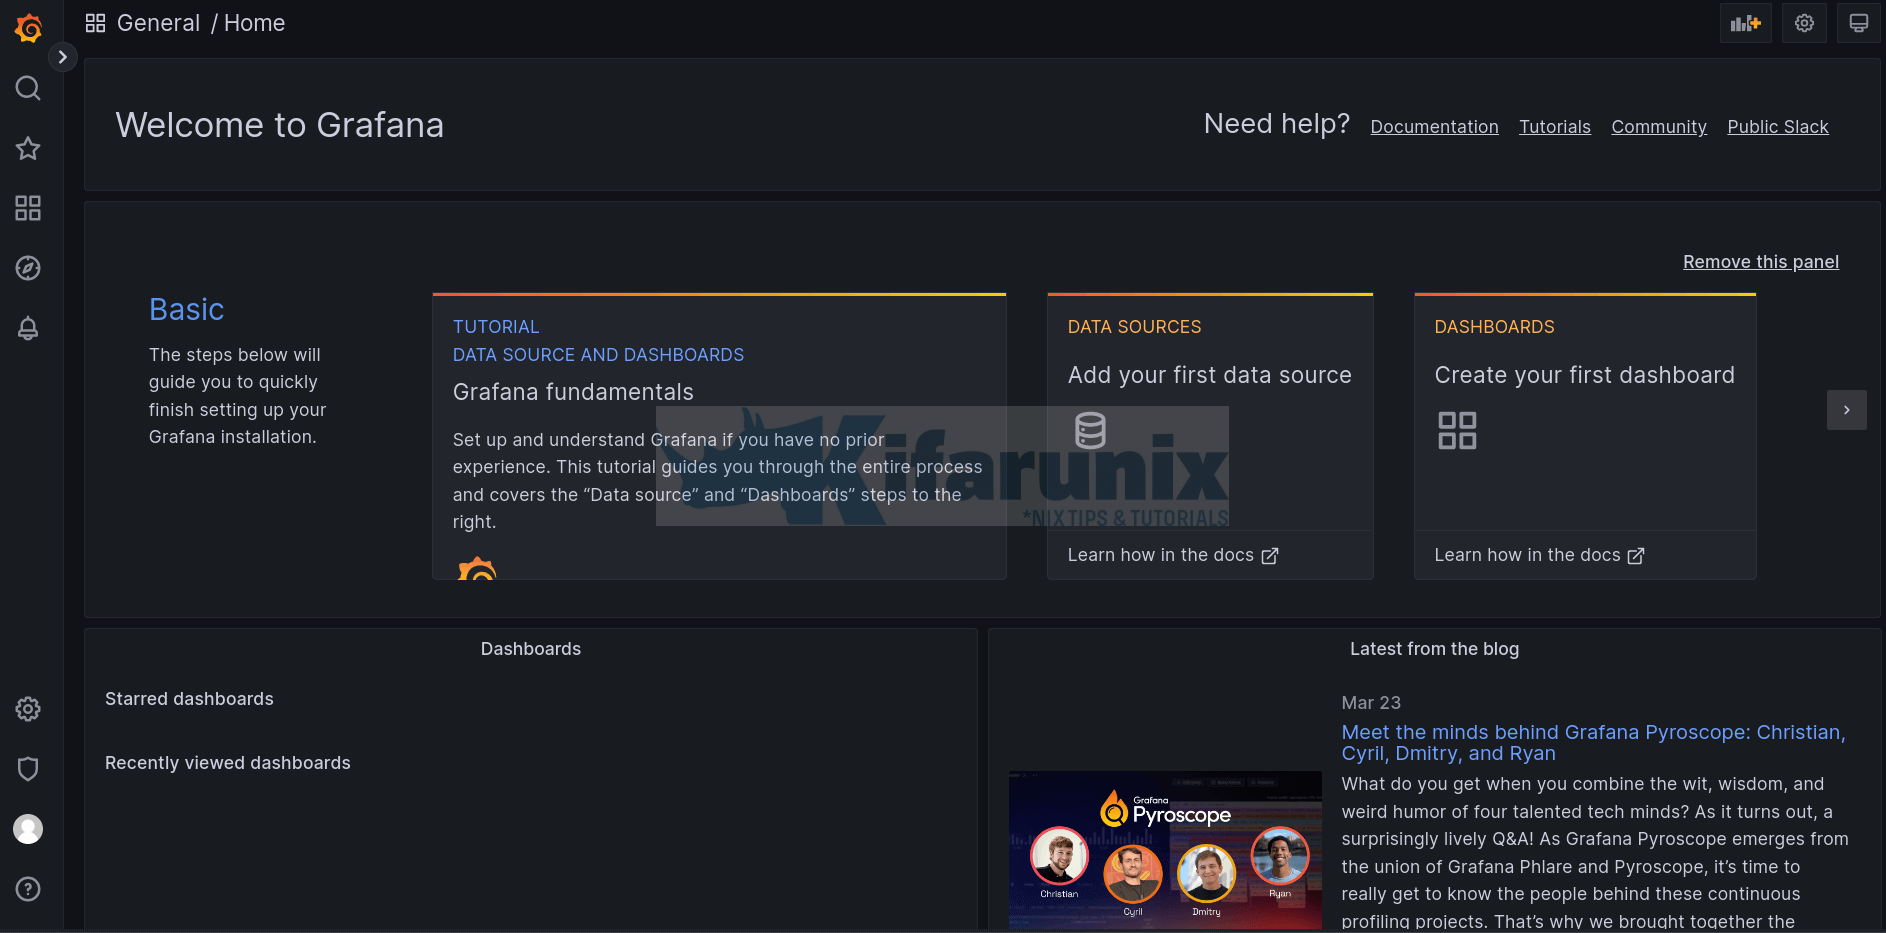
Once you login, you will be prompted to change the password.
You can choose to keep the default credentials and compromise the security of your Grafana or do change the password and proceed to Grafana dashboard.

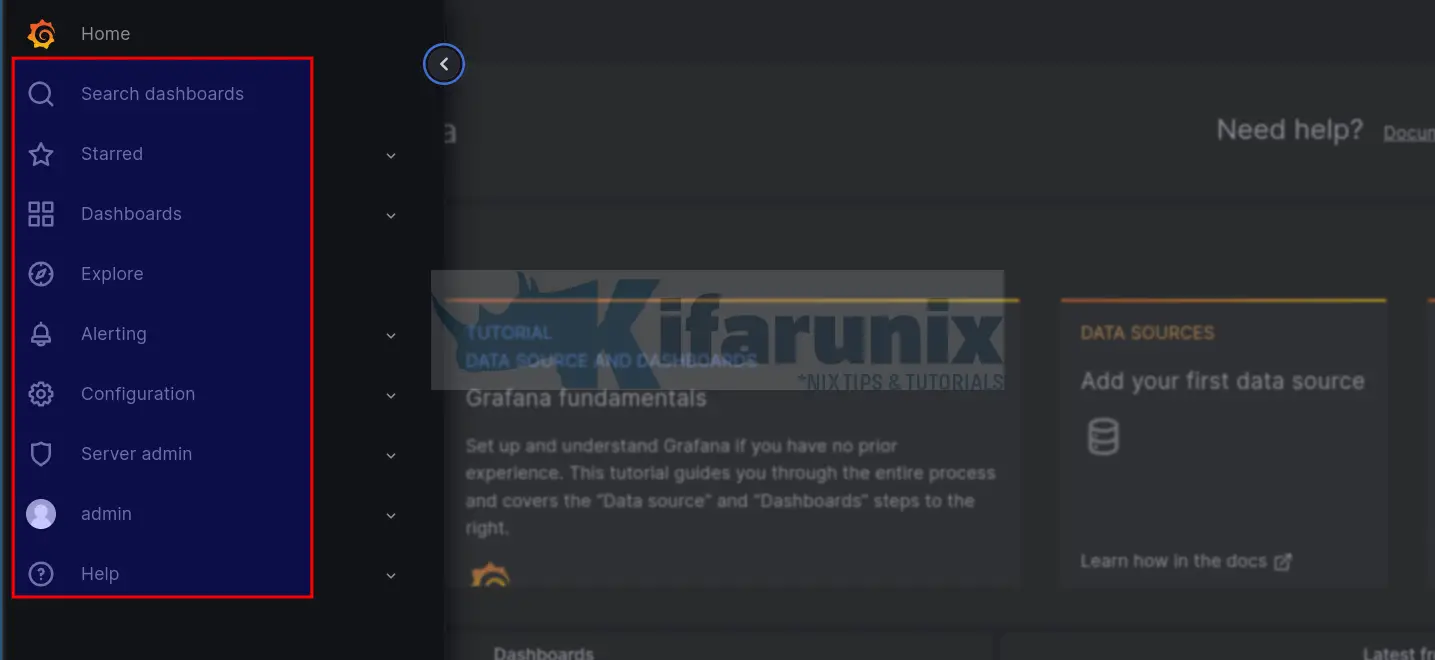
Naviagate through Grafana Menu
On the left menu, you can explore more about Grafana.

There you go. You have successfully installed Grafana on Ubuntu 18.04 server. Enjoy
Other Tutorials
See our other related guides by following the links below;
Install and Setup TIG Stack on Fedora 30

