In this guide, we are going to learn how to install and configure Elastic Auditbeat on Ubuntu 18.04. Auditbeat is a lightweight data shipper that is used to collect audit events for users and system processes. It can also be used to detect changes to critical files, like binaries and configuration files, and identify potential security policy violations.
Auditbeat is an Elastic Beat and hence, in order to use it, you need to install Elastic stack. See our guide on how to install Elastic Stack 7 on Ubuntu 18.04 below;
Install Elastic Stack 7 on Ubuntu 18.04/Debian 9.8
Install and Configure Elastic Auditbeat on Ubuntu 18.04
Install Auditbeat on Ubuntu 18.04
Auditbeat can be install from Elastic Repos or directly using the DEB binary.
To install from Elastic repos;
- Import the PGP repo signing key
wget -qO - https://artifacts.elastic.co/GPG-KEY-elasticsearch | sudo apt-key add -- Create the Elastic repo.
apt install apt-transport-https
echo "deb https://artifacts.elastic.co/packages/7.x/apt stable main" | sudo tee -a /etc/apt/sources.list.d/elastic-7.x.list- Run system update
apt update- Install Auditbeat on Ubuntu 18.04
apt install auditbeatTo install Auditbeat using DEB Binary;
- Download the binary installer
apt install curl
curl -L -O https://artifacts.elastic.co/downloads/beats/auditbeat/auditbeat-7.2.0-amd64.deb- Install Auditbeat
apt install ./auditbeat-7.2.0-amd64.debConfigure Auditbeat on Ubuntu 18.04
Configure Auditbeat Modules
Auditbeat supports different modules including;
- System modules which collects various security related information about a system.
- Audit module which collect system audit events.
- File integrity module which collects system file changes that contain metadata and hashes.
The default configuration file for Auditbeat is /etc/auditbeat/auditbeat.yml.
In this example, we are going to run Auditbeat with the default module configurations.
...
auditbeat.modules:
- module: auditd
  audit_rule_files: [ '${path.config}/audit.rules.d/*.conf' ]
  audit_rules: |
- module: file_integrity
  paths:
  - /bin
  - /usr/bin
  - /sbin
  - /usr/sbin
  - /etc
- module: system
  datasets:
    - host    # General host information, e.g. uptime, IPs
    - login   # User logins, logouts, and system boots.
    - package # Installed, updated, and removed packages
    - process # Started and stopped processes
    - socket  # Opened and closed sockets
    - user    # User information
  state.period: 12h
  user.detect_password_changes: true
  login.wtmp_file_pattern: /var/log/wtmp*
  login.btmp_file_pattern: /var/log/btmp*
...
Configure Auditbeat Output
In this guide, we are going to use Logstash data processing engine as the output for Audibeat collected events.
Hence, open the configuration file and under the Outputs section, define your output. Comment Elasticsearch output and enable Logstash. Ensure that there is a connection to Logstash.
vim /etc/auditbeat/auditbeat.yml...
#================================ Outputs =====================================
# Configure what output to use when sending the data collected by the beat.
#-------------------------- Elasticsearch output ------------------------------
#output.elasticsearch:
# Array of hosts to connect to.
#hosts: ["localhost:9200"]
# Optional protocol and basic auth credentials.
#protocol: "https"
#username: "elastic"
#password: "changeme"
#----------------------------- Logstash output --------------------------------
output.logstash:
# The Logstash hosts
hosts: ["192.168.0.106:5044"]
...Configure Logstash beats input for receiving event data from Elastic beats.
input {
  beats {
    port => 5044
  }
}
You can also define the Auditbeat index on Logstash Elasticsearch output configuration. The default is audibeat. You can however use %{[@metadata][beat]}-%{[@metadata][version]}-%{+YYYY.MM }” to autodetect the Beat used.
# Logstash Elasticsearch Output
output {
  elasticsearch {
    hosts => ["http://192.168.0.106:9200"]
    index => "%{[@metadata][beat]}-%{[@metadata][version]}-%{+YYYY.MM.dd}"
  }
}
Load Elasticsearch Index Template
If you are using Logstash or any other processing engines instead of using Elasticsearch as output, you need to load the index template manually into Elasticsearch.
This requires a direct connection to Elasticsearch. The command below is used to load the index template manually to Elasticsearch (It temporarily disables Logstash Output).
auditbeat setup --index-management -E output.logstash.enabled=false -E 'output.elasticsearch.hosts=["192.168.0.106:9200"]'If, however, there is no direct connection to Elasticsearch, you can generate the template and install on Elasticsearch server.
auditbeat export template > auditbeat.template.jsonNext, copy the Auditbeat Index template, auditbeat.template.json, to Elasticsearch and install it as follows.
curl -XPUT -H 'Content-Type: application/json' http://192.168.0.106:9200/_template/auditbeat-7.2.0 [email protected]Verify that Auditbeat index template has been loaded to Elasticsearch.
curl -XGET 192.168.0.106:9200/_cat/indices?v
health status index                             uuid                   pri rep docs.count docs.deleted store.size pri.store.size
green  open   .kibana_task_manager              xQztoO5CRoygONVw6ujEVg   1   0          2            9     25.4kb         25.4kb
yellow open   auditbeat-7.2.0-2019.07.04-000001 7jNXrH_pTlaSyMF99ITgPw   1   1          0            0       230b           230b
Running Auditbeat
To run Auditbeat in the foreground,
auditbeat -eTo run Auditbeat as service;
systemctl start auditbeatEnable it to run on system boot.
systemctl enable auditbeatOnce Auditbeat is running, you can perform some events like login, change some files, add users.
Next, login to Elasticsearch verify if Auditbeat index has any data.
curl -XGET 192.168.0.106:9200/auditbeat-*/_search?pretty...
"user" : {
"audit" : {
"name" : "jay",
"id" : "1002"
},
"name" : "root",
"id" : "0"
},
"service" : {
"type" : "auditd"
},
"agent" : {
"type" : "auditbeat",
"ephemeral_id" : "72fd62cf-50fd-4c3a-89d1-65ee17565ca4",
"hostname" : "ubuntu18",
"id" : "ab7dab68-7709-4161-933b-670d253e52b8",
"version" : "7.2.0"
},
"event" : {
"module" : "auditd",
"category" : "user-login",
"action" : "disposed-credentials",
"outcome" : "success"
},
"tags" : [
"beats_input_raw_event",
"_grokparsefailure"
]
}
},
{
"_index" : "auditbeat-7.2.0-2019.07.04",
"_type" : "_doc",
"_id" : "kesivWsB-ERNbH9db86a",
"_score" : 1.0,
"_source" : {
"socket" : {
"entity_id" : "yVPVX7j2LLIaTWEE"
},
"ecs" : {
"version" : "1.0.0"
},
"process" : {
"name" : "sshd",
"pid" : 2092
},
"message" : "Listening socket (:::22) OPEN by process sshd (PID: 2092) and user root (UID: 0)",
"network" : {
"transport" : "tcp",
"type" : "ipv6",
"direction" : "listening"
},
...If all is well, go ahead and create Kibana Auditbeat index.
Create Kibana Auditbeat Index
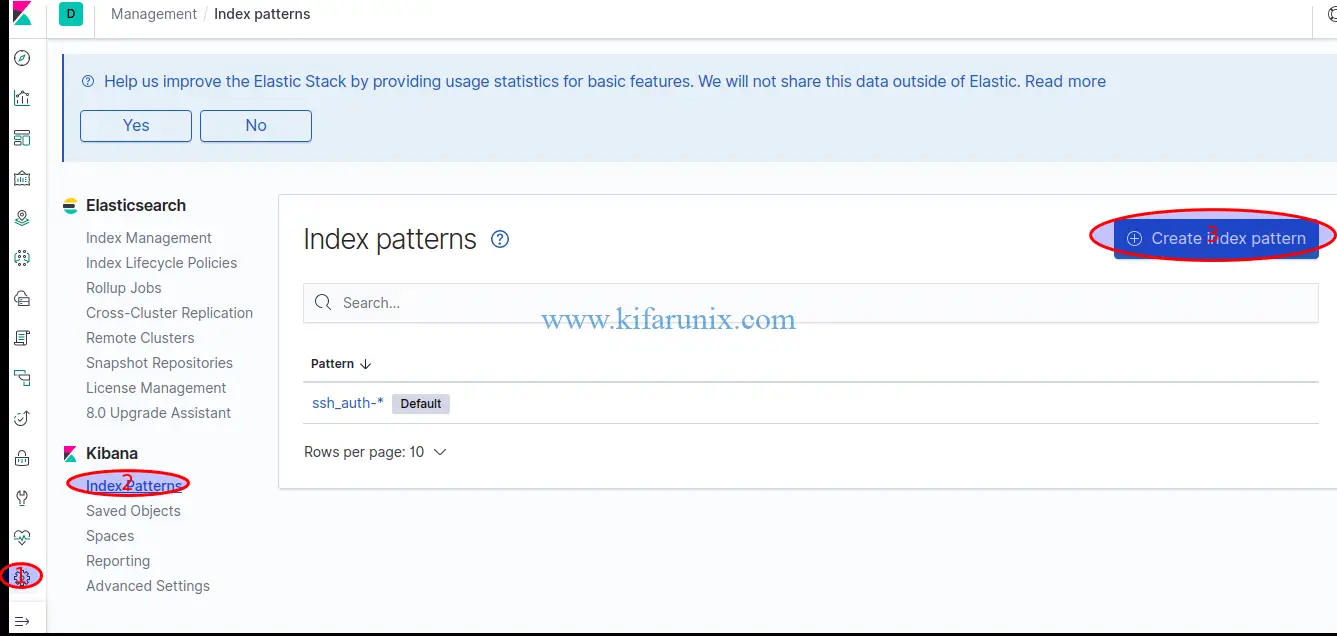
Login to Kibana and click on the settings (gear icon) on the left pane > Kibana > Index Patterns > Create Index Pattern.
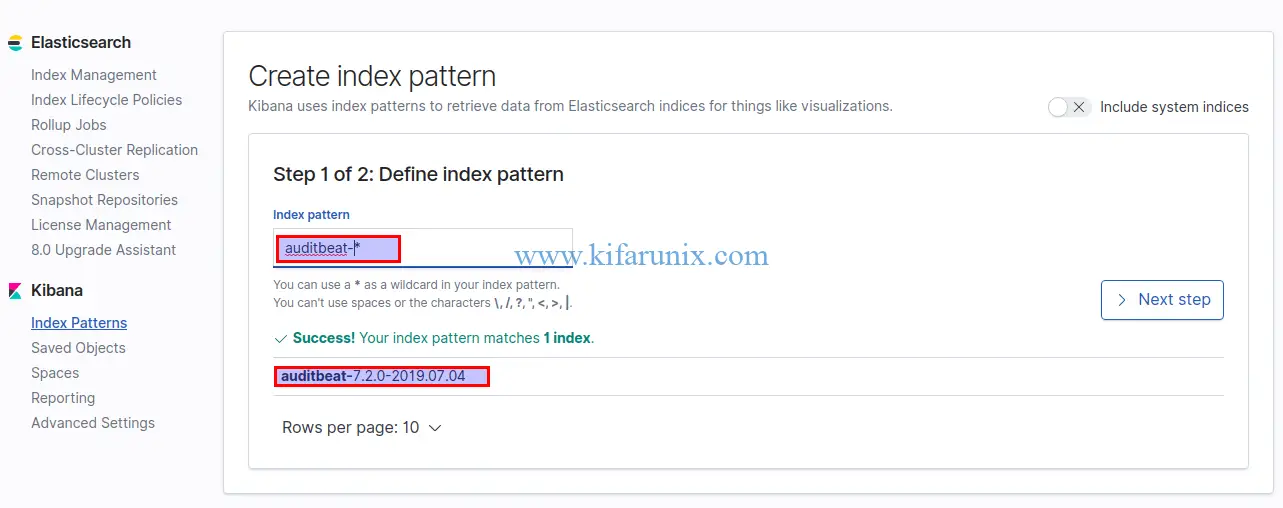
Select Auditbeat Index and click Next.
Select the Time Filter field name from the dropdown and click Create Index Pattern. After that, you should be able to see the index pattern data fields.
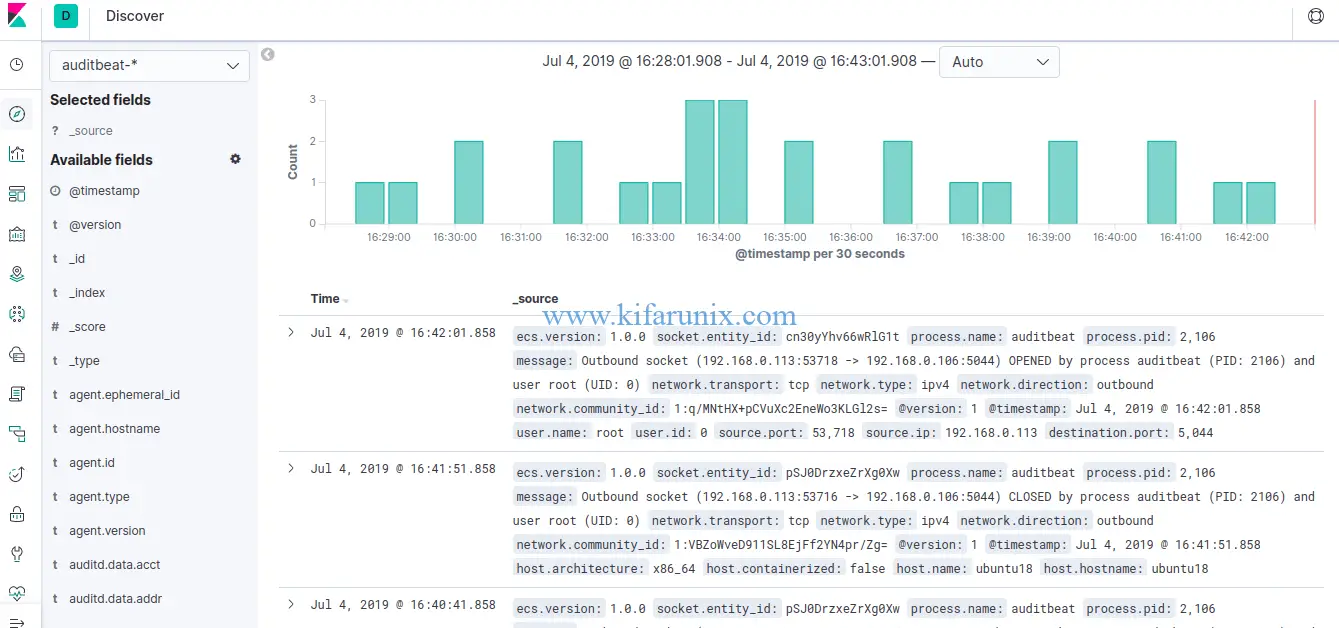
Click on Discover and select auditbeat-* index pattern to see the Auditbeat data.
Setup Kibana Dashboards
Auditbeat comes pre-packaged with sample Kibana dashboards, visualizations, and searches for visualizing Auditbeat data.
Since we have configured Logstash output in this demo, you need to temporarily disable the Logstash output and enable Elasticsearch to load the dashboards. Note that Kibana should be listening on a non-loopback interface.
auditbeat setup -e -E output.logstash.enabled=false -E output.elasticsearch.hosts=['192.168.0.106:9200'] -E setup.kibana.host=192.168.0.106:5601...
2019-07-04T15:58:37.731+0300 INFO instance/beat.go:776 Kibana dashboards successfully loaded.
Loaded dashboardsViewing Kibana Auditbeat Dashboards
Now that the configuration is done and sample Kibana Auditbeat dashboards have been loaded to Kibana, you can now login to Kibana UI and view your Auditbeat data.
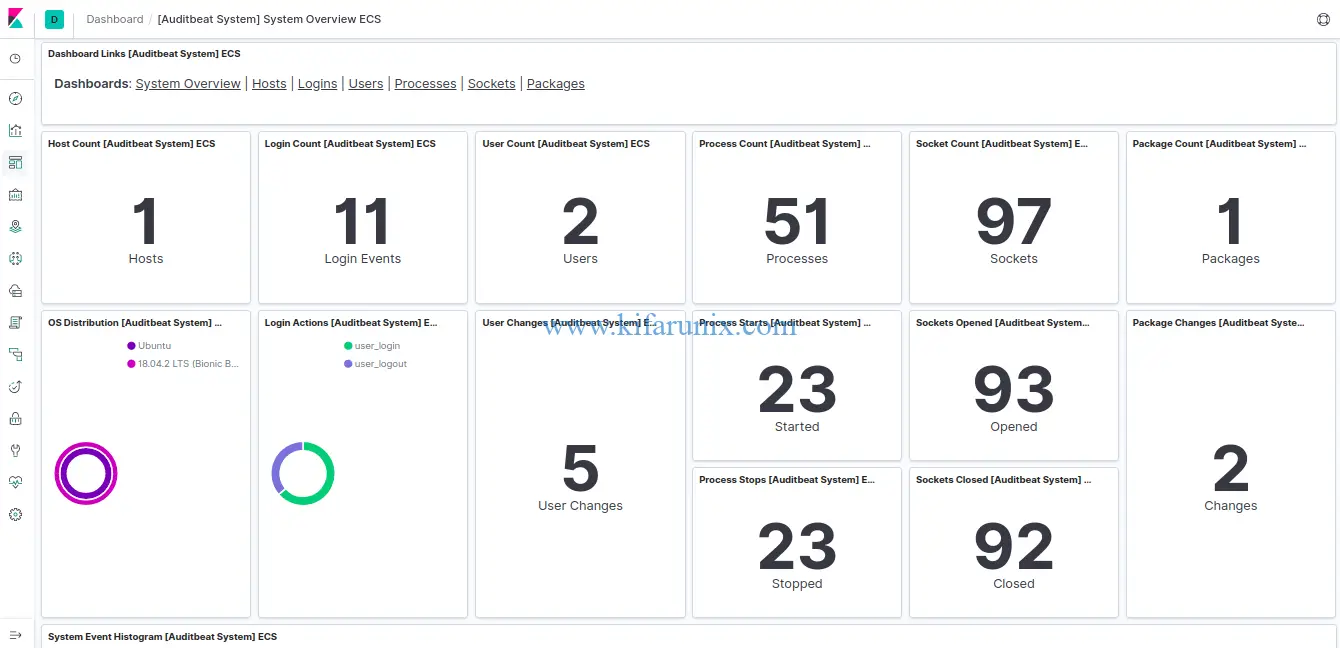
Once you login to Kibana, click Dashboard from the left panel and select one of the Dashboards from the available samples. For example, the default Logins dashboard.
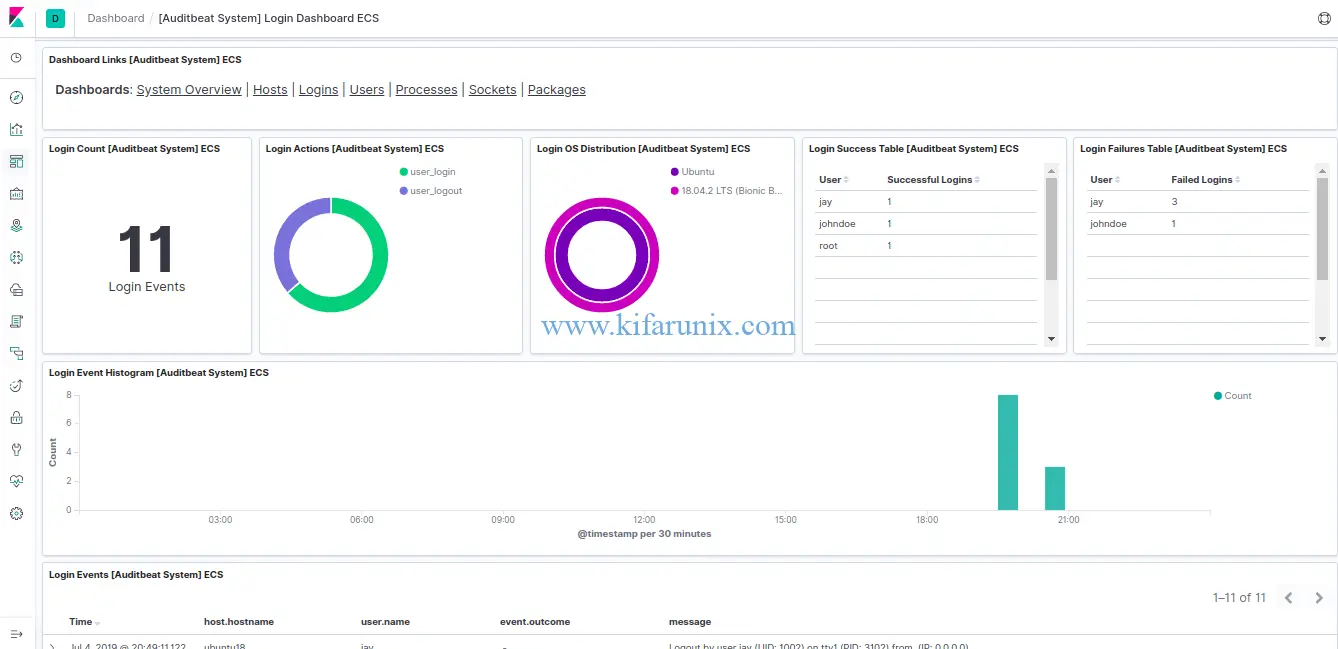
Click on System overview tab to see various system statistics.
To see User statistics, click on Users tab.
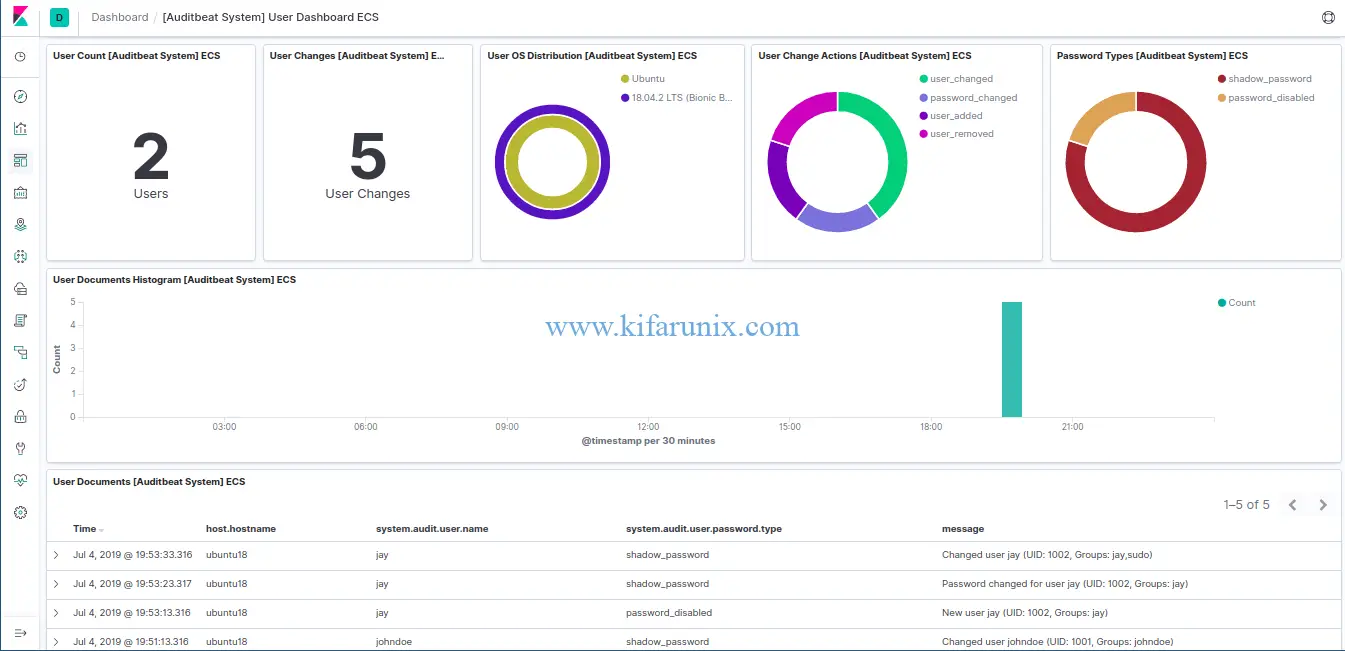
Beautiful, right? Now you can explore other dashboards. You can also create your own dashboards.
That is all on how to install and configure Elastic Auditbeat on Ubuntu 18.04. Enjoy.
Reference:
Getting Started with Auditbeat.
Related Tutorials;
Install Filebeat on Fedora 30/Fedora 29/CentOS 7
Install Logstash 7 on Fedora 30/Fedora 29/CentOS 7

