This guide will take you through how you can be able to add hosts to Zabbix Server for monitoring. Zabbix can be used to monitor literally anything right from cloud, network, servers, services, applications…
Install Zabbix Agents on Remote Hosts to Monitor
First off, install Zabbix agents on the remote hosts to be monitored.
Install Zabbix Agent on Ubuntu 22.04/Debian 11
Install Zabbix Agent on Windows Systems
Add Hosts to Zabbix Server for Monitoring
So how can you add remote host systems to Zabbix server for monitoring?
In this tutorial, we will be adding Linux and Windows systems into the Zabbix server for monitoring.
To add hosts to Zabbix server;
- Create a host group. Hosts added to Zabbix for monitoring can be organized based on the functionality into host groups. For example, Linux systems can be put together under Linux Servers group, Windows systems can be grouped into Windows systems group.
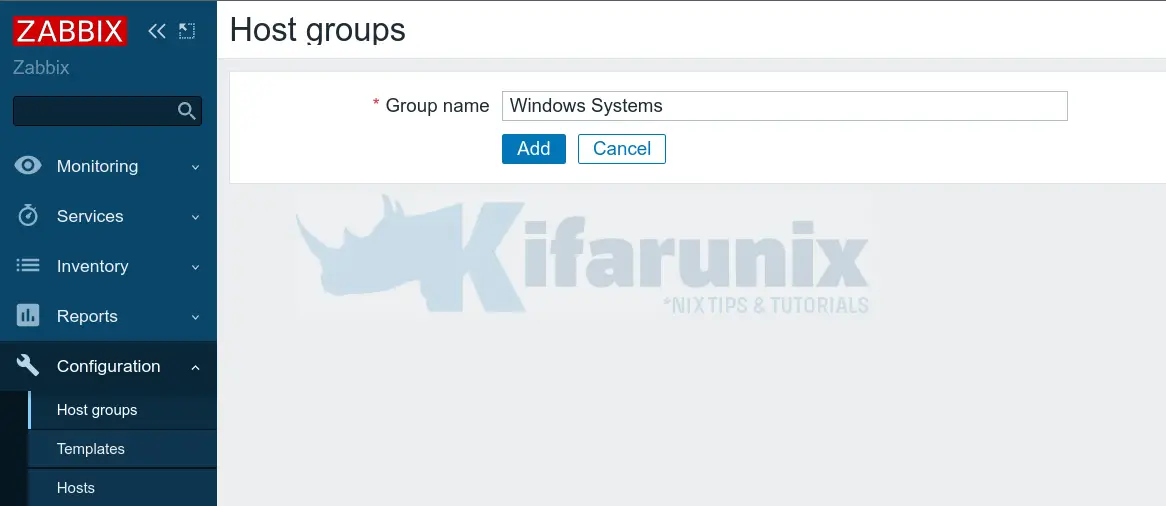
- To create Zabbix host group (if it doesn’t already exists), navigate to Configuration > Host groups > Create host group.
- Enter the name of the group;
- Click Add to create the group.
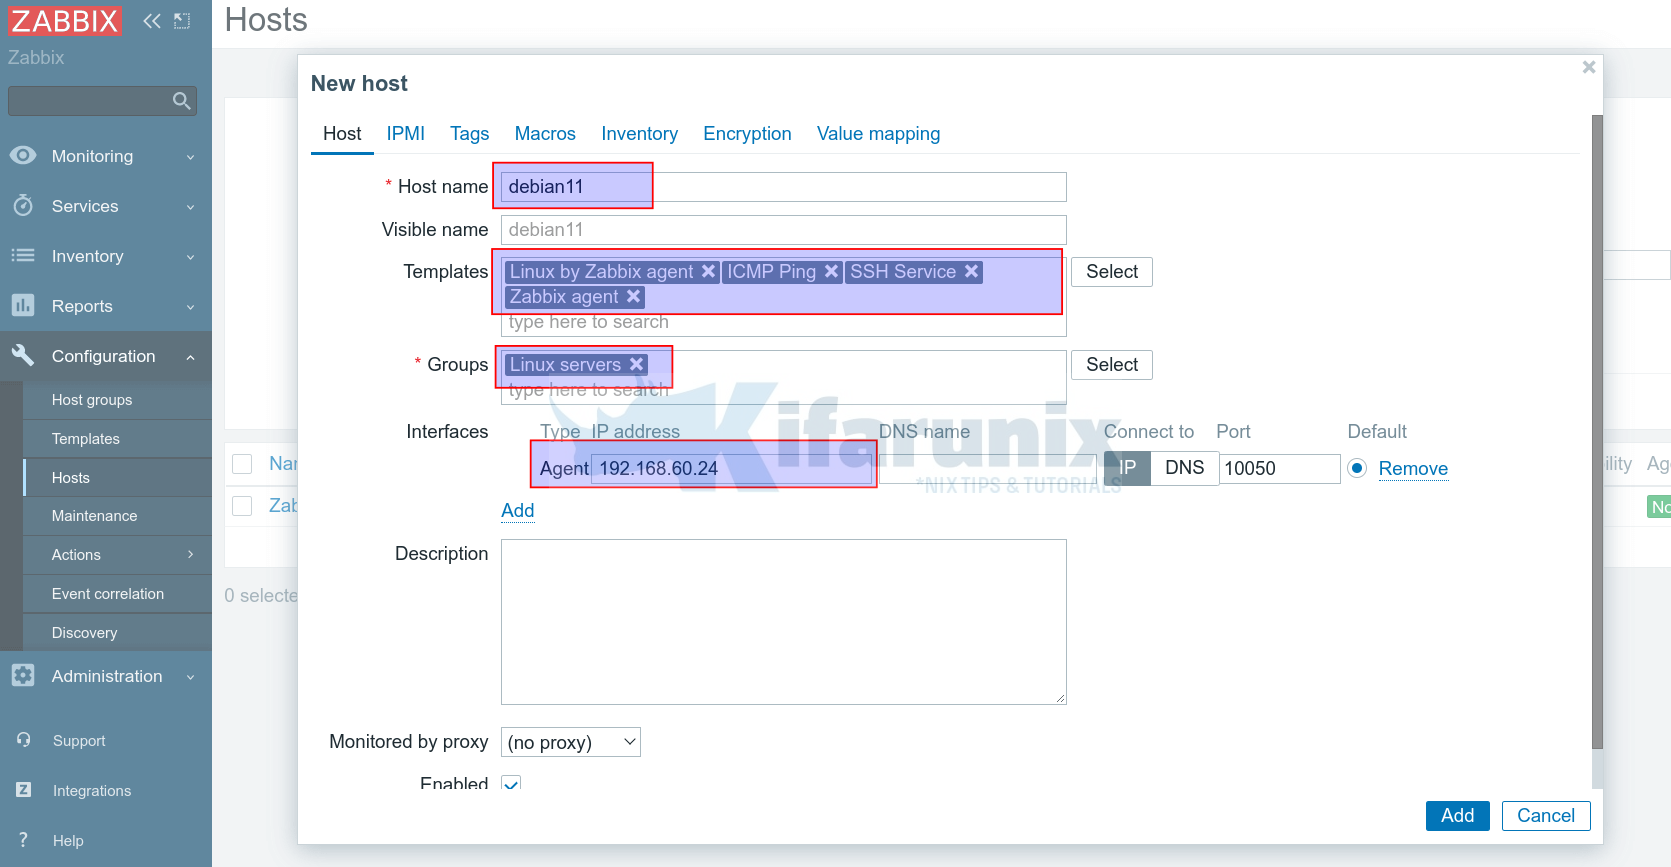
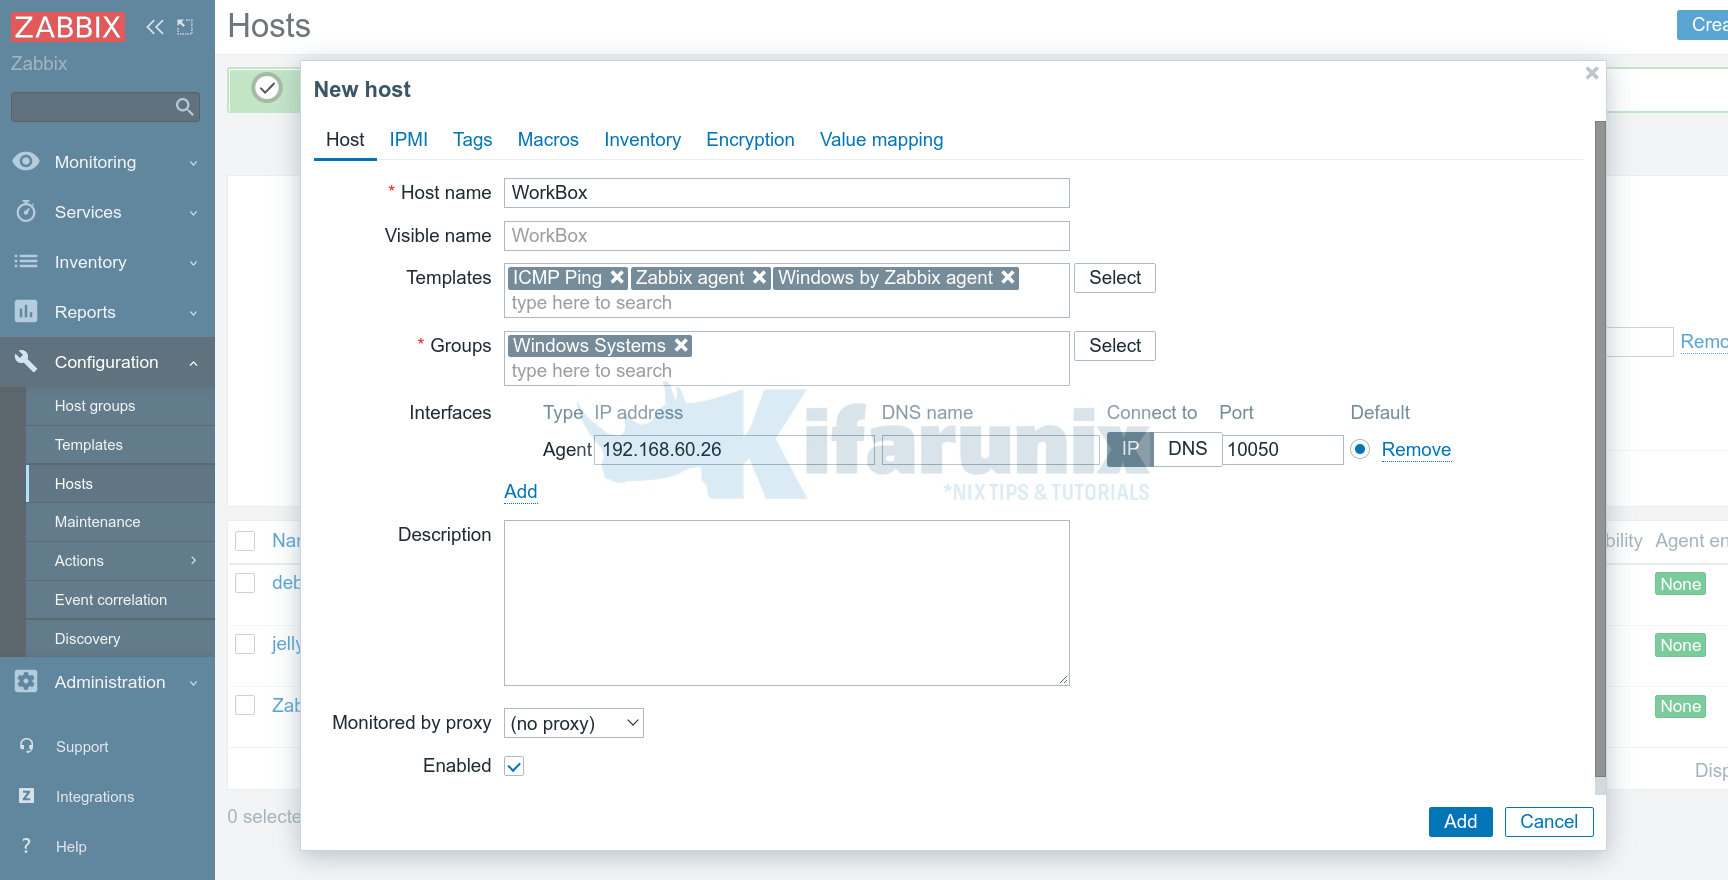
- Next, add the host to Zabbix Server by navigating to Configuration > Hosts > Create host. Enter the host details.
- Hostname
- Select Templates for the hosts such as Operating System, Modules etc
- You can also be able to add templates to the Host Group to make it easy to apply it to members of the group.
- Note the templates selected for my agents;
- Linux: Linux by Zabbix Agent, ICMP Ping, SSH Service, Zabbix Agent.
- Windows: Windows by Zabbix Agent, ICMP Ping, Zabbix Agent
- Groups, e.g Linux servers
- Interfaces > Agent;
- Enter the IP address, DNS name if any
- Other details are optional
- Click Add to add the host.
Linux;
Windows;
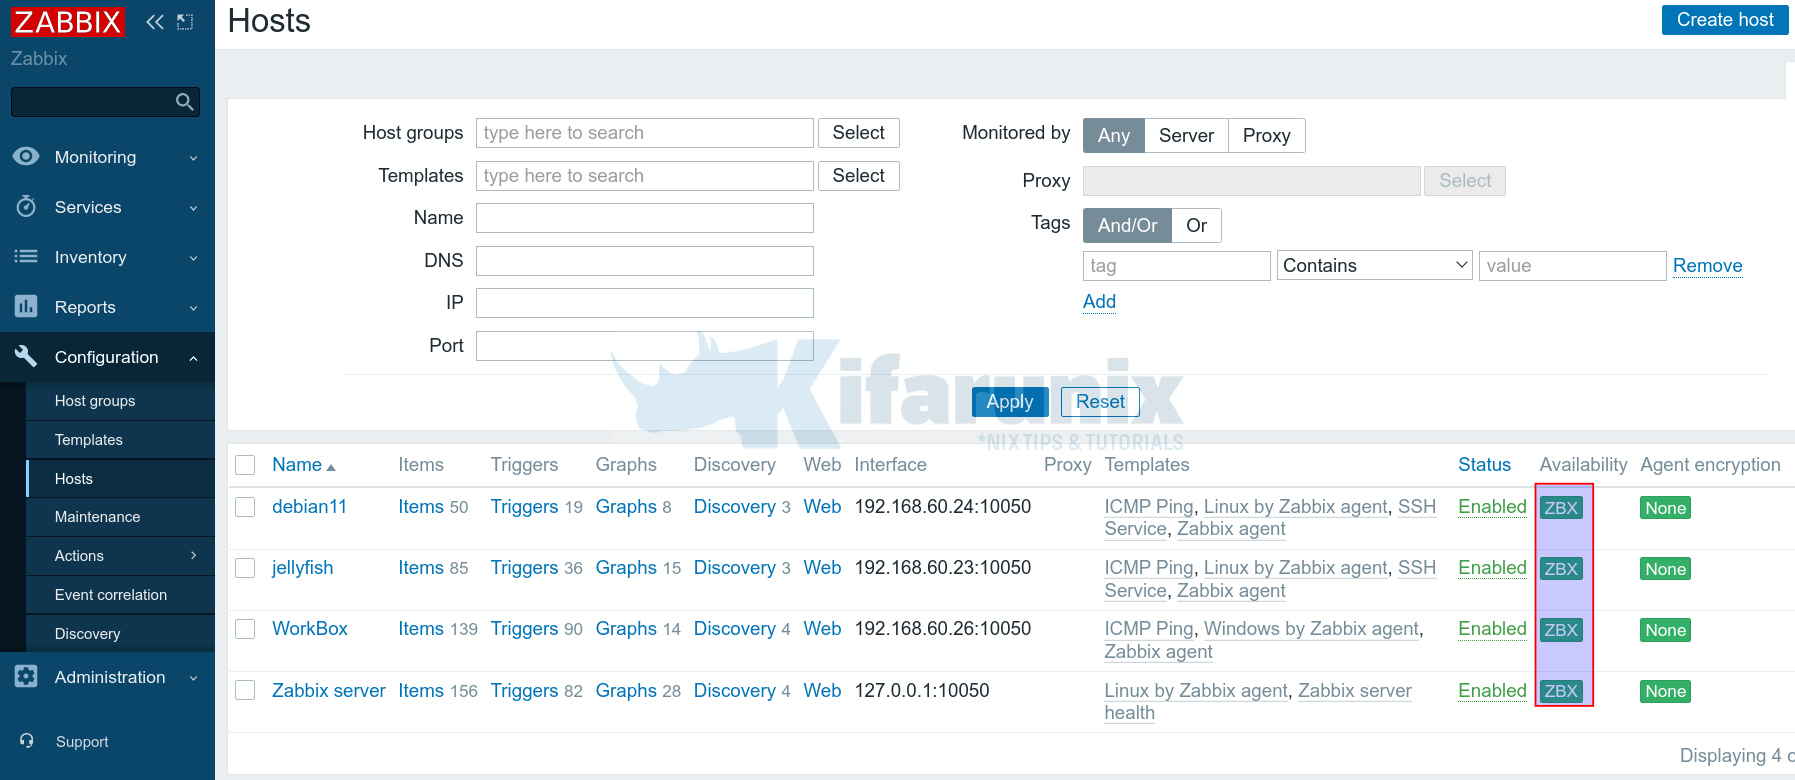
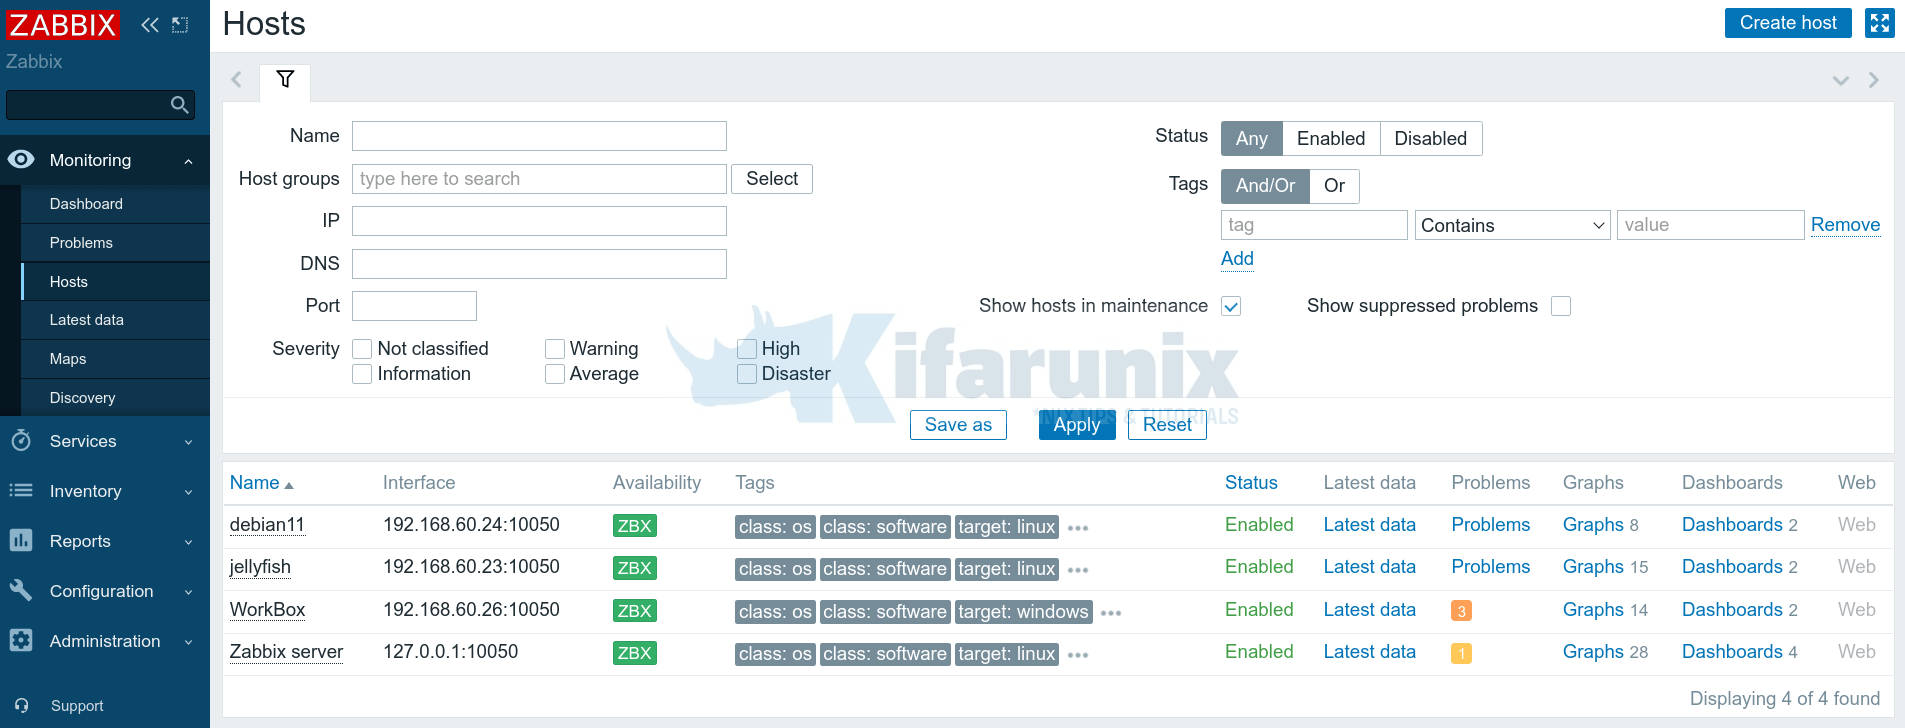
- Follow the same procedure to add more hosts. Here is a summary of my hosts added to Zabbix server for monitoring.
If the connection between the Zabbix server and Zabbix agents is fine, you should see the availability status change to green.
Please note that Availability icon is only related to passive checks, hence why we selected “passive” templates above. Any template with Active means active checks.
Active vs Passive agent connection
If you use the Zabbix agent in the passive mode, it means that the poller (internal server process) connects to the agent on port 10050/TCP and polls for a certain value (e.g., host CPU load). The poller waits until the agent on the host responds with the value. Then the server gets the value back, and the connection closes.
In the active mode, all data processing is performed on the agent, without the interference of pollers. However, the agent must know what metrics should be monitored, and that is why the agent connects to the trapper port 10051/TCP of the server once every two minutes (by default). The agent requests the information about the items, and then performs the monitoring on the host and pushes the data to the server via the same TCP port.
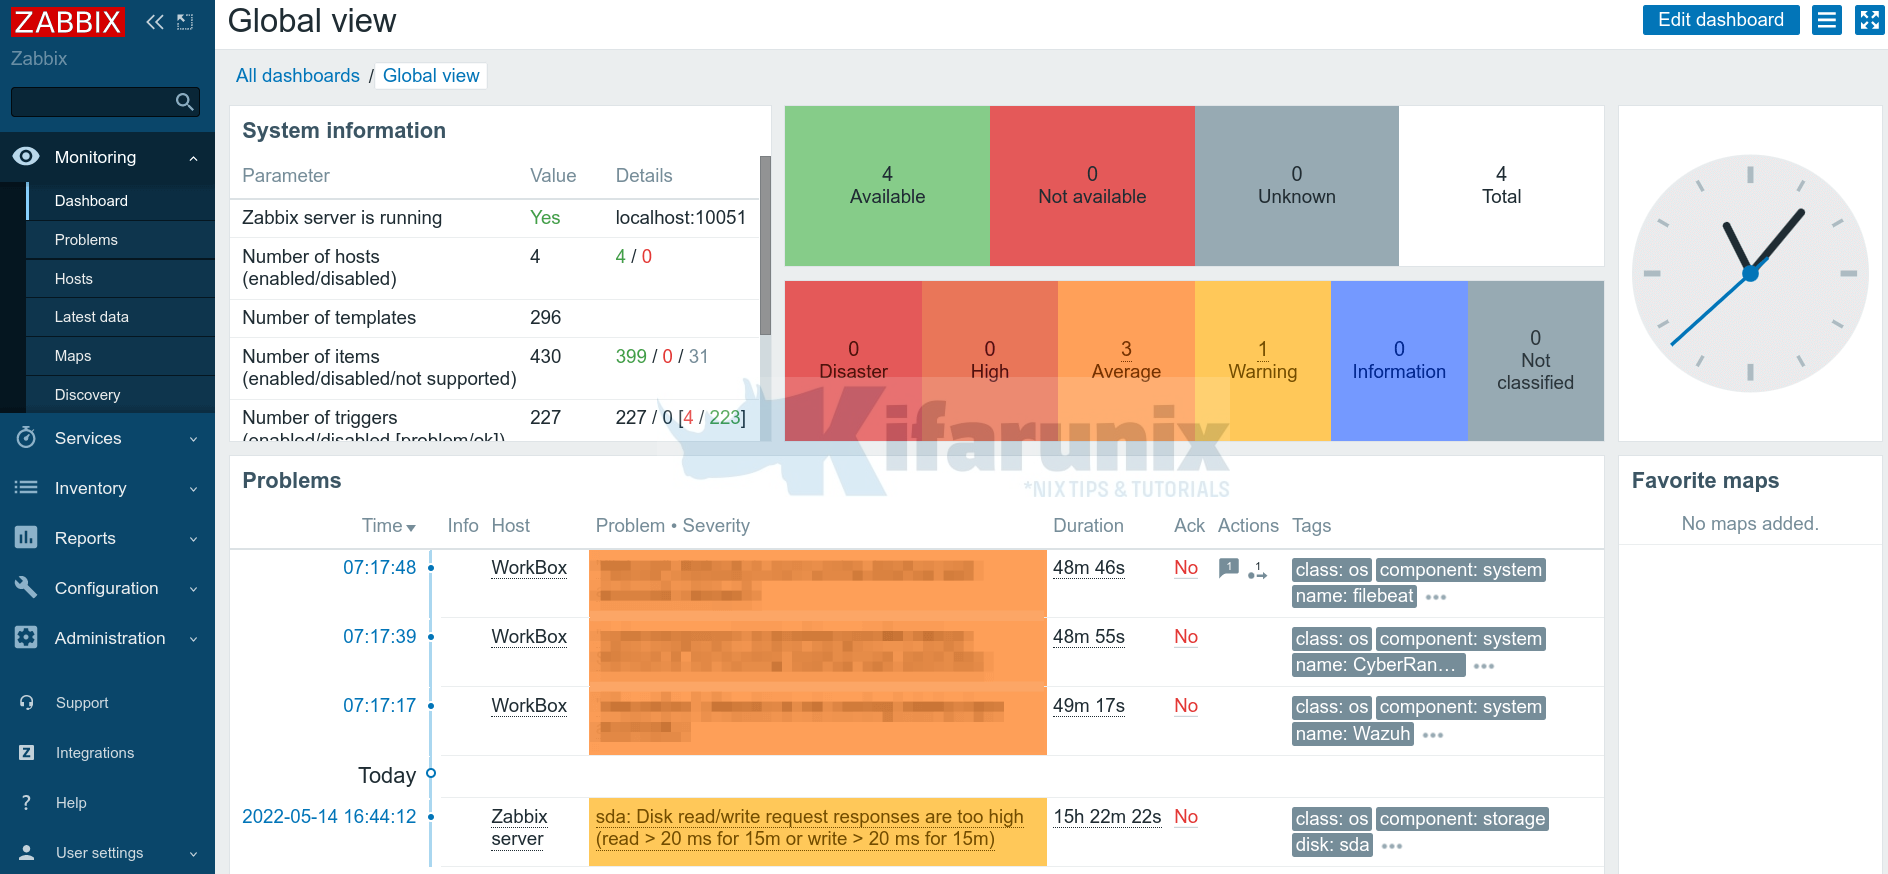
From the Zabbix dashboards, you can see we have four hosts available now, including server itself.
Zabbix Hosts; Monitoring > Hosts
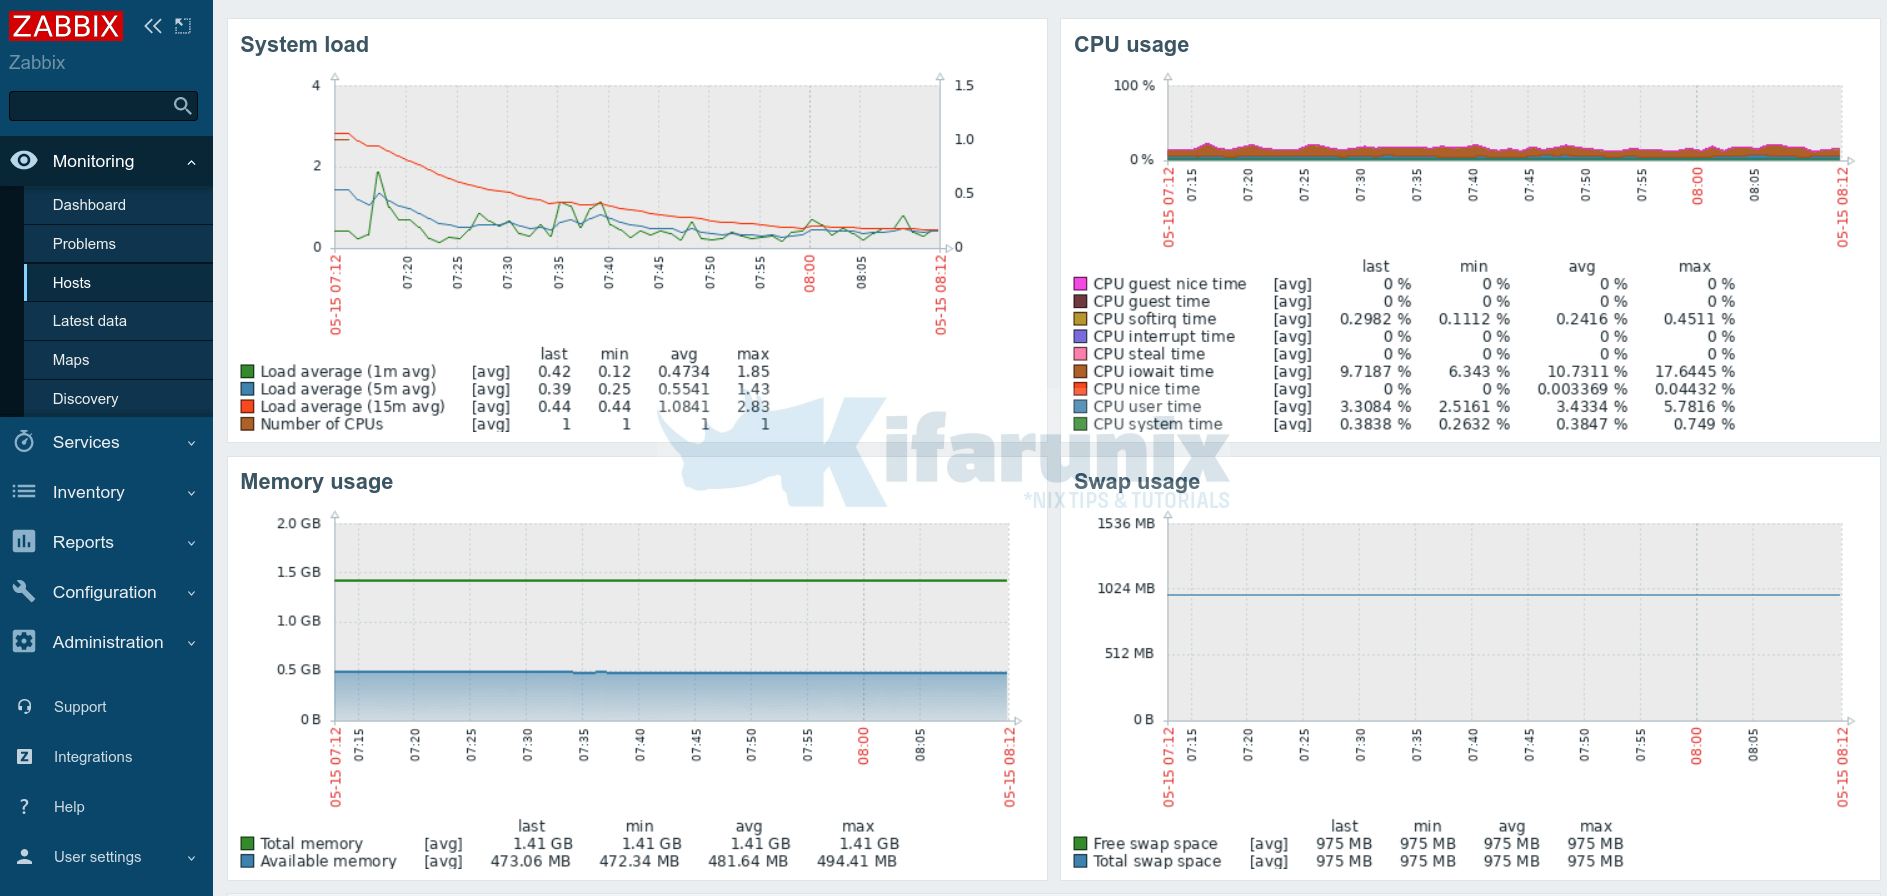
You can check the Graphs and Dashboards against each host for various metrics analysis.
Sample system performance dashbaord.
And that is how you can basically add remote hosts to Zabbix Server for Monitoring.
Read more on Zabbix Hosts documentation page.
Other Tutorials

