In this guide, we are going to learn how to install latest Grafana on CentOS 8. Grafana is the open source analytics and monitoring solution that enables you to query, visualize and alert on various systems metrics that can be pulled from various time series databases such as Graphite, InfluxDB & Prometheus etc.
Installing Grafana on CentOS 8
There are different methods on how to install Grafana on CentOS 8. These include;
- Installing Grafana automatically via YUM package manager
- Installing Grafana manually via RPM package manager
- Installing Grafana via Grafana Standalone Binary
In this guide, we are going to learn how to install Grafana using all these three methods.
Runs system update
To begin with, update your system packages.
dnf updateInstalling Grafana automatically via YUM Package Manager
To install Grafana automatically via YUM package manager, there are two ways;
- Create the Grafana repos and install directly from these repos.
- Download Grafana RPM binary and install it using YUM package manager.
Installing Grafana from YUM repository
To install Grafana from YUM repository, you need to create YUM repos as follows
Well, there are two kinds repos; Enterprise and Open-source software (OSS) repos. Our demo involves the use of the later.
cat > /etc/yum.repos.d/grafana.repo << 'EOL'
[grafana]
name=grafana
baseurl=https://packages.grafana.com/oss/rpm
repo_gpgcheck=1
enabled=1
gpgcheck=1
gpgkey=https://packages.grafana.com/gpg.key
sslverify=1
sslcacert=/etc/pki/tls/certs/ca-bundle.crt
EOL
Once the repos are in place, run the command below to install Grafana.
dnf install grafana -yInstead of creating Grafana repos as shown above, you would simply download latest stable release Grafana RPM binary from Grafana downloads page and install it using YUM package manager.
Obtain the download link of the latest stable release version and pull the RPM binary using wget. Grafana 6.7.1 is the current stable release as of this writing.
wget https://dl.grafana.com/oss/release/grafana-6.7.1-1.x86_64.rpmOnce the download completes, install it as follows;
dnf install grafana-6.7.1-1.x86_64.rpmYou can as well install it directly without having to download it;
dnf install https://dl.grafana.com/oss/release/grafana-6.7.1-1.x86_64.rpmor
dnf localinstall https://dl.grafana.com/oss/release/grafana-6.7.1-1.x86_64.rpmInstalling Grafana manually via RPM package manager
To manually install Grafana via RPM package manager, you have to download the latest RPM binary installer from the Grafana downloads page.
wget https://dl.grafana.com/oss/release/grafana-6.7.1-1.x86_64.rpmInstall required dependencies;
dnf install initscripts urw-fonts -yThen install Grafana as follows;
rpm -Uvh grafana-6.7.1-1.x86_64.rpmInstalling Grafana via Grafana Standalone Binary
Grafana has a ready made standalone Linux binary tarball that can simply downloaded and installed on an appropriate Grafana directory.
Download the latest standalone binary tarball from Downloads page.
wget https://dl.grafana.com/oss/release/grafana-6.7.1.linux-amd64.tar.gzOnce the download completes, you can extract the tarball to an appropriate directory. For example, to extract Grafana files to /usr/local/grafana directory;
mkdir /usr/local/grafanatar xzf grafana-6.7.1.linux-amd64.tar.gz --strip-components=1 -C /usr/local/grafanaYou should now have your Grafana and its configuration files on /usr/local/grafana.
ls /usr/local/grafanabin conf LICENSE NOTICE.md public README.md scripts tools VERSIONNote that no initialization scripts are installed with this method.
Running Grafana
Depending on the installation method you choose, Grafana can be run in different ways.
Managing Grafana Service with Systemd
Reload the systemd manager configuration.
systemctl daemon-reloadTo start, stop, restart, check status or enable Grafana server to run on system boot, run the commands below respectively.
systemctl start grafana-serversystemctl stop grafana-serversystemctl restart grafana-serversystemctl enable grafana-serversystemctl status grafana-serverTo start and enable Grafana to run on boot at the same time;
systemctl enable --now grafana-serverManaging Grafana Service with SysV
To start, stop, check status or enable Grafana to run on system boot, run the commands below respectively;
service grafana-server startservice grafana-server stopservice grafana-server statuschkconfig --add grafana-serverManaging Grafana Service with Standalone Binary
If you installed using the standalone Linux binary, then you need to navigate to the directory on which you extracted its configuration files to and execute the Grafana server binary as shown below.
cd /usr/local/grafana./bin/grafana-server webYou can stop by pressing Ctrl+c.
Accessing Grafana from Web
Open Grafana Port on Firewall
Grafana listens on TCP port 3000 by default. To allow external access, open the port on FirewallD.
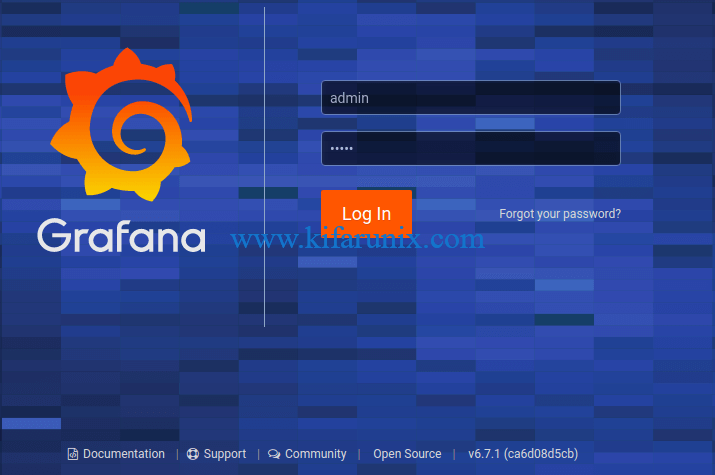
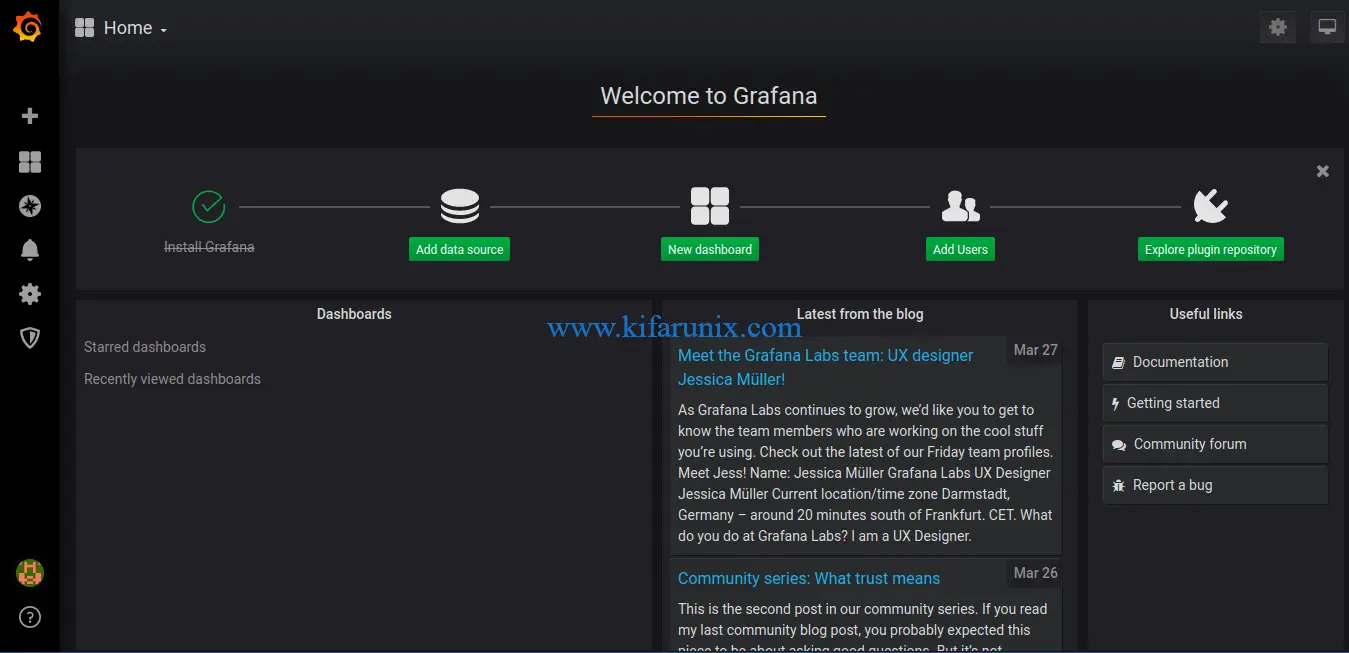
firewall-cmd --add-port=3000/tcp --permanentfirewall-cmd --reloadYou can then access Grafana via the url, http://grafana-server-IP:3000. Use the credentials admin for both username and password.

Reset the password when prompted and proceed to Grafana interface.

You have successfully installed Grafana on CentOS 8. In our next guide, we will cover how to visualize various system metrics with Grafana. Stay connected.
Reference
Installing Grafana on RPM-based Linux (CentOS, Fedora, OpenSuse, Red Hat) systems
Related Tutorials
Integrate Prometheus with Grafana for Monitoring
Install Grafana Plugins Behind a Proxy server

