
How do I monitor Docker containers in Grafana? Well, in this tutorial, you will learn how to monitor Docker containers metrics using Grafana. Grafana is an open source analytics and interactive data visualization tool that can be used to visualize metrics, logs collected from various remote endpoints. In this specific scenario, we will focus on monitoring Docker containers metrics using Grafana.
Table of Contents
Monitoring Docker Containers Metrics using Grafana
In this guide, we will use Grafana, Prometheus and cAdvisor (Container Advisor) to monitor Docker containers metrics. So basically, cAdvisor analyzes and exposes running containers metrics. Such metrics are then scraped using Prometheus time series database. Grafana will then be configured to read the metrics from Prometheus itself for visualization.
In short, these are the tools we will use in this guide to show you how to monitor Docker containers metrics;
Since we are collecting and monitoring Docker containers metrics, we will deploy all the above tools as Docker containers!
Create Docker Network to Interconnect cAdvisor, Prometheus and Grafana
To ensure that these monitoring containers, Grafana, cAdvisor, and Prometheus can communicate with each other, you need to put them on the same Docker network;
docker network create monitoring_stackThe above command creates a Docker network called monitoring_stack.
You check available Docker networks using the command below;
docker network lsNETWORK ID NAME DRIVER SCOPE
5f44af648fc1 bridge bridge local
26035daefa88 docker_gwbridge bridge local
948a8c9971f6 host host local
74d82d574037 monitoring_stack bridge local
326f211f2226 nagios-core-docker_default bridge local
e8a7ddcc85b4 none null local
ce199041829e wp-app bridge local
Deploy cAdvisor Docker Container
To begin with, let’s deploy cAdvisor so it can collect Docker container runtime metrics. You can simply run the command below to deploy cAdvisor and attach it to our custom Docker network above;
docker run -d -p 9080:8080 \
  --network monitoring_stack \
  -v=/:/rootfs:ro \
  -v=/var/run:/var/run:ro \
  -v=/sys:/sys:ro \
  -v=/var/lib/docker/:/var/lib/docker:ro \
  -v=/dev/disk/:/dev/disk:ro \
  --privileged \
  --device=/dev/kmsg \
  --name=cadvisor \
  gcr.io/cadvisor/cadvisor
By default, cAdvisor exposes metrics on port 8080. We have bound this port to host port 9080.
cAdvisor container should now be up and running;
docker ps -aCONTAINER ID IMAGE COMMAND CREATED STATUS PORTS NAMES
cd7c80dc0ac1 gcr.io/cadvisor/cadvisor "/usr/bin/cadvisor -…" 2 minutes ago Up 2 minutes (healthy) 0.0.0.0:9080->8080/tcp, :::9080->8080/tcp cadvisor
View Container Runtime Metrics on cAdvisor Dashboard
You can now access cAdvisor dashboard via http://<docker-host-IP>:8080/docker.

Check each container metrics by clicking on each container from cAdvisor dashboard. sample metrics.

Deploy Prometheus Docker Container
Next, deploy Prometheus Docker container to scrape collected container data from cAdvisor and store them in its internal time series database which can later be read and visualized via Grafana.
First of all, before you can deploy Prometheus Docker container, create a Prometheus configuration file. In our setup, we placed the Prometheus configuration file under /opt/prometheus directory. While creating Prometheus Docker container, we will mount this configuration file to the default Prometheus configuration file, /etc/prometheus/prometheus.yml.
vim /opt/prometheus/prometheus.yml
# my global config
global:
  scrape_interval:     15s # Set the scrape interval to every 15 seconds. Default is every 1 minute.
  evaluation_interval: 15s # Evaluate rules every 15 seconds. The default is every 1 minute.
  # scrape_timeout is set to the global default (10s).
# Load rules once and periodically evaluate them according to the global 'evaluation_interval'.
rule_files:
  # - "first.rules"
  # - "second.rules"
# A scrape configuration containing exactly one endpoint to scrape:
# Here it's Prometheus itself.
scrape_configs:
  # The job name is added as a label `job=` to any timeseries scraped from this config.
  - job_name: 'prometheus'
    static_configs:
      - targets: ['localhost:9090']
  - job_name: 'cadvisor'
    static_configs:
      - targets: ['cadvisor:8080']
In the configuration above, we use default settings for Prometheus and configured it to scrape the Docker metrics collected by cAdvisor cadvisor:8080.
We use the name of the cAdvisor container since both Prometheus and cAdvisor are on same network and they should be able to communicate via their “names”.
Prometheus will publish the metrics it scrapes on port 9090.
Thus, let’s create Prometheus Docker container using the official Prometheus Docker image and configure it to use our custom network created above, monitoring_stack.
docker run -d -p 9090:9090 \
--network monitoring_stack \
-v "/opt/prometheus/prometheus.yml:/etc/prometheus/prometheus.yml" \
--restart unless-stopped \
--name prometheus \
 prom/prometheus
Your Prometheus container should now be running and exposed via port 9090/tcp.
docker ps --format '{{.Names}} {{.Ports}} {{.Status}}'prometheus 0.0.0.0:9090->9090/tcp, :::9090->9090/tcp Up 8 minutesSimilarly, ensure you allow port 9090/tcp on firewall.
Verify Prometheus Targets/Metrics from Prometheus Dashboard
You can now navigate to http://docker-host-IP:9090/targets to see Prometheus targets,
Targets;

To see cAdvisor collected metrics, just simply go to http://docker-host-IP:9080/metrics;
Or even better;
curl -s http://docker-host-IP:9080/metricsCheck Docker Container Metrics on Prometheus
Before you can integrate Grafana with Prometheus, you can also be able to check Docker container metrics from Prometheus dashboard e.g;
Just type container and you should see quite a number of metrics;

You can filter running containers using the query;
container_tasks_state{name=~".+.",state="running"}
Deploy Grafana Docker Container
To get a better visualization of the Docker container metrics, you can deploy Grafana Docker container and configure it read and give a visualization of the Docker container metrics scrapped by Prometheus.
To deploy Grafana Docker container using the official image, grafana/grafana-oss and attach it to the custom network created above.
docker run -d -p 3000:3000 \
--network monitoring_stack \
--restart unless-stopped \
--name grafana \
grafana/grafana-oss
Open port 3000/tcp on firewall to allow external access to Grafana;
ufw allow 3000/tcpAccessing Grafana Web Interface
You can now access Grafana web interface http://docker-host-IP:3000.
Default credentials are admin/admin. Reset the password and proceed to the Dashboard;

Integrate Prometheus with Grafana For Monitoring
You can now integrate Prometheus with Grafana by adding Prometheus data source to Grafana. Check the link below;
Integrate Prometheus with Grafana For Monitoring
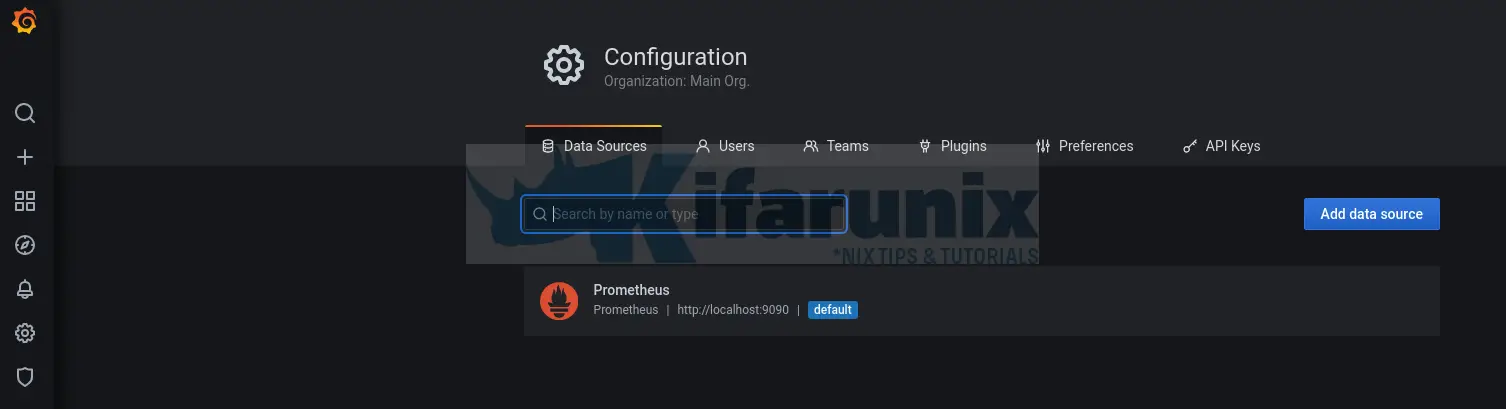
Data sources, once you have added the Prometheus data source.

As you can see, we specified the name of the Prometheus container on the data source URL because both Grafana and Prometheus are on same network.
Create Docker Metrics Dashboards on Grafana
You can now create your own Grafana visualization dashboards.
As a simple example, let’s create a simple visualization to display running, paused or stopped containers;
To create a Grafana dashboard, navigate to dashboards menu > New dashboard.

Add new panel;
You have three sections on the dashboard panel;

So, to create a visualization of specific metric, you need a query to fetch those metrics from the datasource, which in this case is our Preom
- So from the Query panel, select a datasource (Prometheus in this example).
- You can build your query using Builder which lets you select metrics and enter values (Builder) or simply switch to code which allows you to type the query manually.
- with Builder, you can simply select your metric query from Metric dropdown and define the filters under Label filters.
- with Code, you can just type your query under metrics browser;
Builder;

Code:

The query will count total number of running containers seen in last one minute (names is not empty), count(rate(container_last_seen{name!=""}[1m])).
Under the Panel options;
- change visualization type. We are using Stat in this example
- Set the panel name e.g Running Containers. You can leave other options with default values
- Value options: we leave defaults
- Stat Styles, we only changed Color mode to Value and Graph Mode to node.
- Standard Options unit Number.
- everything else, defaults!

When done, click Save/Apply to save the dashboard/visualization.
Docker container total CPU usage, RAM usage, Network I/O, Block I/O
Sample dashboard;

Here is a sample dashboard JSON file;
{
  "annotations": {
    "list": [
      {
        "builtIn": 1,
        "datasource": {
          "type": "grafana",
          "uid": "-- Grafana --"
        },
        "enable": true,
        "hide": true,
        "iconColor": "rgba(0, 211, 255, 1)",
        "name": "Annotations & Alerts",
        "target": {
          "limit": 100,
          "matchAny": false,
          "tags": [],
          "type": "dashboard"
        },
        "type": "dashboard"
      }
    ]
  },
  "editable": true,
  "fiscalYearStartMonth": 0,
  "graphTooltip": 0,
  "id": 7,
  "links": [],
  "liveNow": false,
  "panels": [
    {
      "gridPos": {
        "h": 1,
        "w": 24,
        "x": 0,
        "y": 0
      },
      "id": 10,
      "title": "Row title",
      "type": "row"
    },
    {
      "datasource": {
        "type": "prometheus",
        "uid": "iLkJX_A4z"
      },
      "fieldConfig": {
        "defaults": {
          "color": {
            "mode": "thresholds"
          },
          "mappings": [],
          "thresholds": {
            "mode": "absolute",
            "steps": [
              {
                "color": "green",
                "value": null
              },
              {
                "color": "red",
                "value": 80
              }
            ]
          },
          "unit": "none"
        },
        "overrides": []
      },
      "gridPos": {
        "h": 8,
        "w": 9,
        "x": 0,
        "y": 1
      },
      "id": 2,
      "options": {
        "colorMode": "value",
        "graphMode": "none",
        "justifyMode": "auto",
        "orientation": "auto",
        "reduceOptions": {
          "calcs": [
            "lastNotNull"
          ],
          "fields": "",
          "values": false
        },
        "textMode": "auto"
      },
      "pluginVersion": "9.3.6",
      "targets": [
        {
          "datasource": {
            "type": "prometheus",
            "uid": "iLkJX_A4z"
          },
          "editorMode": "code",
          "expr": "count(rate(container_last_seen{name!=\"\"}[1m]))",
          "legendFormat": "__auto",
          "range": true,
          "refId": "A"
        }
      ],
      "title": "Running Containers",
      "type": "stat"
    },
    {
      "datasource": {
        "type": "prometheus",
        "uid": "iLkJX_A4z"
      },
      "fieldConfig": {
        "defaults": {
          "color": {
            "mode": "palette-classic"
          },
          "custom": {
            "axisCenteredZero": false,
            "axisColorMode": "text",
            "axisLabel": "",
            "axisPlacement": "left",
            "barAlignment": 0,
            "drawStyle": "line",
            "fillOpacity": 10,
            "gradientMode": "none",
            "hideFrom": {
              "legend": false,
              "tooltip": false,
              "viz": false
            },
            "lineInterpolation": "linear",
            "lineWidth": 2,
            "pointSize": 5,
            "scaleDistribution": {
              "type": "linear"
            },
            "showPoints": "never",
            "spanNulls": true,
            "stacking": {
              "group": "A",
              "mode": "none"
            },
            "thresholdsStyle": {
              "mode": "off"
            }
          },
          "mappings": [],
          "thresholds": {
            "mode": "absolute",
            "steps": [
              {
                "color": "green",
                "value": null
              },
              {
                "color": "red",
                "value": 80
              }
            ]
          }
        },
        "overrides": []
      },
      "gridPos": {
        "h": 8,
        "w": 15,
        "x": 9,
        "y": 1
      },
      "id": 4,
      "options": {
        "legend": {
          "calcs": [
            "max",
            "min",
            "mean"
          ],
          "displayMode": "table",
          "placement": "right",
          "showLegend": true
        },
        "tooltip": {
          "mode": "single",
          "sort": "none"
        }
      },
      "targets": [
        {
          "datasource": {
            "type": "prometheus",
            "uid": "iLkJX_A4z"
          },
          "editorMode": "code",
          "expr": "rate(container_cpu_usage_seconds_total{name=~\".+\"}[5m]) * 100",
          "legendFormat": "{{name}}",
          "range": true,
          "refId": "A"
        }
      ],
      "title": "% CPU Usage",
      "type": "timeseries"
    },
    {
      "datasource": {
        "type": "prometheus",
        "uid": "iLkJX_A4z"
      },
      "fieldConfig": {
        "defaults": {
          "color": {
            "mode": "palette-classic"
          },
          "custom": {
            "axisCenteredZero": false,
            "axisColorMode": "text",
            "axisLabel": "",
            "axisPlacement": "auto",
            "barAlignment": 0,
            "drawStyle": "line",
            "fillOpacity": 0,
            "gradientMode": "none",
            "hideFrom": {
              "legend": false,
              "tooltip": false,
              "viz": false
            },
            "lineInterpolation": "linear",
            "lineWidth": 1,
            "pointSize": 5,
            "scaleDistribution": {
              "type": "linear"
            },
            "showPoints": "auto",
            "spanNulls": false,
            "stacking": {
              "group": "A",
              "mode": "none"
            },
            "thresholdsStyle": {
              "mode": "off"
            }
          },
          "mappings": [],
          "thresholds": {
            "mode": "absolute",
            "steps": [
              {
                "color": "green",
                "value": null
              },
              {
                "color": "red",
                "value": 80
              }
            ]
          },
          "unit": "KBs"
        },
        "overrides": []
      },
      "gridPos": {
        "h": 8,
        "w": 9,
        "x": 0,
        "y": 9
      },
      "id": 8,
      "options": {
        "legend": {
          "calcs": [
            "mean"
          ],
          "displayMode": "table",
          "placement": "right",
          "showLegend": true,
          "sortBy": "Mean",
          "sortDesc": true
        },
        "tooltip": {
          "mode": "single",
          "sort": "none"
        }
      },
      "targets": [
        {
          "datasource": {
            "type": "prometheus",
            "uid": "iLkJX_A4z"
          },
          "editorMode": "code",
          "expr": "sum(rate(container_network_transmit_bytes_total{name=~\".+\"}[5m])) by (name)",
          "legendFormat": "{{name}}",
          "range": true,
          "refId": "A"
        }
      ],
      "title": "Transmitted Network Traffic (Tx)",
      "type": "timeseries"
    },
    {
      "datasource": {
        "type": "prometheus",
        "uid": "iLkJX_A4z"
      },
      "fieldConfig": {
        "defaults": {
          "color": {
            "mode": "palette-classic"
          },
          "custom": {
            "axisCenteredZero": false,
            "axisColorMode": "text",
            "axisLabel": "",
            "axisPlacement": "left",
            "barAlignment": 0,
            "drawStyle": "line",
            "fillOpacity": 10,
            "gradientMode": "none",
            "hideFrom": {
              "legend": false,
              "tooltip": false,
              "viz": false
            },
            "lineInterpolation": "linear",
            "lineWidth": 2,
            "pointSize": 5,
            "scaleDistribution": {
              "type": "linear"
            },
            "showPoints": "never",
            "spanNulls": true,
            "stacking": {
              "group": "A",
              "mode": "none"
            },
            "thresholdsStyle": {
              "mode": "off"
            }
          },
          "mappings": [],
          "thresholds": {
            "mode": "absolute",
            "steps": [
              {
                "color": "green",
                "value": null
              },
              {
                "color": "red",
                "value": 80
              }
            ]
          },
          "unit": "MiB"
        },
        "overrides": []
      },
      "gridPos": {
        "h": 8,
        "w": 15,
        "x": 9,
        "y": 9
      },
      "id": 5,
      "options": {
        "legend": {
          "calcs": [
            "lastNotNull",
            "mean"
          ],
          "displayMode": "table",
          "placement": "right",
          "showLegend": true,
          "sortBy": "Last *",
          "sortDesc": true
        },
        "tooltip": {
          "mode": "single",
          "sort": "none"
        }
      },
      "targets": [
        {
          "datasource": {
            "type": "prometheus",
            "uid": "iLkJX_A4z"
          },
          "editorMode": "code",
          "expr": "container_memory_usage_bytes{name!=\"\"} / (1024*1024)",
          "legendFormat": "{{name}}",
          "range": true,
          "refId": "A"
        }
      ],
      "title": "Memory Usage",
      "type": "timeseries"
    },
    {
      "datasource": {
        "type": "prometheus",
        "uid": "iLkJX_A4z"
      },
      "fieldConfig": {
        "defaults": {
          "color": {
            "mode": "palette-classic"
          },
          "custom": {
            "axisCenteredZero": false,
            "axisColorMode": "text",
            "axisLabel": "",
            "axisPlacement": "auto",
            "barAlignment": 0,
            "drawStyle": "line",
            "fillOpacity": 0,
            "gradientMode": "none",
            "hideFrom": {
              "legend": false,
              "tooltip": false,
              "viz": false
            },
            "lineInterpolation": "linear",
            "lineWidth": 1,
            "pointSize": 5,
            "scaleDistribution": {
              "type": "linear"
            },
            "showPoints": "auto",
            "spanNulls": false,
            "stacking": {
              "group": "A",
              "mode": "none"
            },
            "thresholdsStyle": {
              "mode": "off"
            }
          },
          "mappings": [],
          "thresholds": {
            "mode": "absolute",
            "steps": [
              {
                "color": "green",
                "value": null
              },
              {
                "color": "red",
                "value": 80
              }
            ]
          },
          "unit": "KBs"
        },
        "overrides": []
      },
      "gridPos": {
        "h": 8,
        "w": 15,
        "x": 0,
        "y": 17
      },
      "id": 7,
      "options": {
        "legend": {
          "calcs": [
            "mean"
          ],
          "displayMode": "table",
          "placement": "right",
          "showLegend": true,
          "sortBy": "Mean",
          "sortDesc": true
        },
        "tooltip": {
          "mode": "single",
          "sort": "none"
        }
      },
      "targets": [
        {
          "datasource": {
            "type": "prometheus",
            "uid": "iLkJX_A4z"
          },
          "editorMode": "code",
          "expr": "sum(rate(container_network_receive_bytes_total{name=~\".+\"}[5m])) by (name)",
          "legendFormat": "{{name}}",
          "range": true,
          "refId": "A"
        }
      ],
      "title": "Received Network Traffic (Rx)",
      "type": "timeseries"
    }
  ],
  "schemaVersion": 37,
  "style": "dark",
  "tags": [],
  "templating": {
    "list": [
      {
        "datasource": {
          "type": "prometheus",
          "uid": "iLkJX_A4z"
        },
        "filters": [],
        "hide": 0,
        "name": "Filters",
        "skipUrlSync": false,
        "type": "adhoc"
      }
    ]
  },
  "time": {
    "from": "now-6h",
    "to": "now"
  },
  "timepicker": {},
  "timezone": "",
  "title": "Docker Container Metrics",
  "uid": "s8x5QuA4k",
  "version": 8,
  "weekStart": ""
}
You can also check community created dashboards an import any that might impress you.
That marks the end of our guide on using Grafana to monitor Docker containers metrics.
Read more about cAdvisor Prometheus metrics.
