Follow through this tutorial to learn how create custom ELK ingest pipeline for custom log processing. Elastic Stack is so flexible that it can give you ability to create your own custom pipeline processors to parse your custom logs. Elastic ingest pipelines “let you perform common transformations on your data before indexing. For example, you can use pipelines to remove fields, extract values from text, and enrich your data“.
Table of Contents
Create Custom ELK Ingest Pipeline to Process Custom Log
In this tutorial, we will create custom ELK ingest pipeline to process Modsecurity logs.
Below is a sample Modsecurity Log we will be working with;
[Wed Oct 05 18:37:22.744204 2022] [:error] [pid 12683:tid 139658067420736] [client 192.168.56.124:59696] [client 192.168.56.124] ModSecurity: Access denied with code 403 (phase 2). Matched phrase "nikto" at REQUEST_HEADERS:User-Agent. [file "/etc/modsecurity/crs/rules/REQUEST-913-SCANNER-DETECTION.conf"] [line "56"] [id "913100"] [msg "Found User-Agent associated with security scanner"] [data "Matched Data: nikto found within REQUEST_HEADERS:User-Agent: mozilla/5.00 (nikto/2.1.5) (evasions:none) (test:000562)"] [severity "CRITICAL"] [ver "OWASP_CRS/3.2.0"] [tag "application-multi"] [tag "language-multi"] [tag "platform-multi"] [tag "attack-reputation-scanner"] [tag "paranoia-level/1"] [tag "OWASP_CRS"] [tag "OWASP_CRS/AUTOMATION/SECURITY_SCANNER"] [tag "WASCTC/WASC-21"] [tag "OWASP_TOP_10/A7"] [tag "PCI/6.5.10"] [hostname "sales.kifarunix.com"] [uri "/index.php"] [unique_id "Yz3O4pMZhpOcYpdhYgoXwQAAAEs"]There are different ways in which you can create custom ELK ingest pipeline;
- Using Kibana’s Ingest Pipelines feature
- Using ELK stack ingest APIs
Before you can proceed to create custom ELK ingest pipeline, be sure to check the ingest pipeline prerequisites:
- To use ingest pipelines, your cluster must have at least one node with the
ingestrole. For heavy ingest loads, it is recommend to have a dedicated ingest nodes. - If the Elasticsearch security features are enabled, you must have the manage_pipeline cluster privilege to manage ingest pipelines.
- You also need the
cluster:monitor/nodes/infocluster privileges use Kibana’s Ingest Pipelines feature - Pipelines including the enrich processor require additional setup
Create Custom ELK Ingest Pipeline using Kibana’s Ingest Pipelines feature
Create Grok Filters to Parse your Custom Logs
One of the ways of parsing a custom log is by extracting the fields of your preference. You can use grok patterns or anything that can get the job done for you;
Here is our grok pattern for extracting fields from the ModSecurity logs.
We assume that the Log will always have the same pattern. Thus, develop your grok pattern accordingly.
\[(?<event_date>%{DAY}\s+%{MONTH}\s+%{MONTHDAY}\s+%{TIME}\s+%{YEAR})\]\s+\[\:(?<log_level>\w+)\]\s+\S+.+client\s+(?<source_ip>%{IP})\]\s+(?<error_message>ModSecurity\S+.+code\s+(?<status_code>%{INT}).+)\s+\[file\s+\"(?<rules_file>\S+.+)\"\]\s+\[line\s+\"(?<rule_line_num>%{INT})\"\]\s+\[id\s+\"(?<rule_id>%{INT})\"\]\s+\[msg\s+\"(?<msg>\S+.+)\"\]\s+\[data\s+\"(?<data>\S+.+)\"\]\s+\[severity\s+\"(?<severity>\w+)\"\]\s+\[ver\s+\"(?<owasp_crs_version>\S+)\"\]\s+(?<tags>\S+.+)\s+\[hostname\s+\"(?<hostname>%{IPORHOST})\"\]\s+\[uri\s+\"(?<uri>/|\S+.+)\"\]\s+\[unique_id\s+\"(?<unique_id>\S+.+)\"\]These are the fields as shown on Kibana Grok debugger;
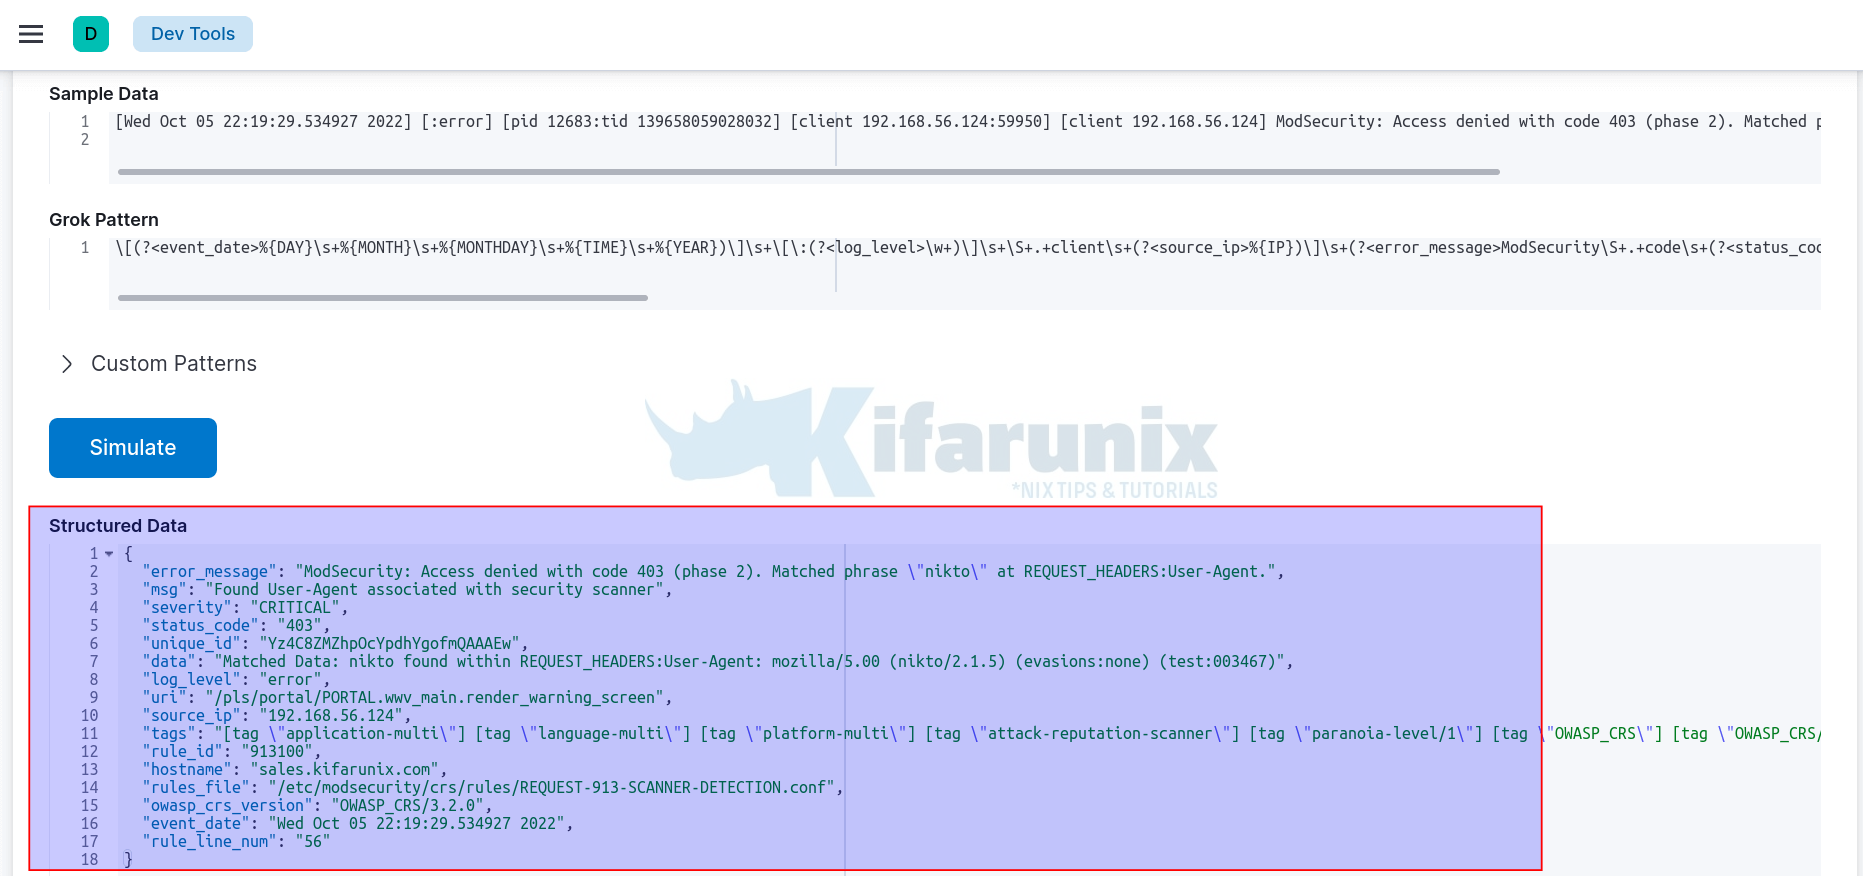
For this grok pattern to be accepted by the processor, it needs to be properly escaped by preceding brackets with double backslashes (\\[), (\\]), colon by double backslashes (\\:) and double quotes (“) with triple backslashes (\\\").
You can replace all \s+ with %{SPACE}+, \S+ (%{NOTSPACE}+), \d (%{INT}), \w (%{WORD}) e.tc.
\\[(?<event_date>%{DAY}%{SPACE}+%{MONTH}%{SPACE}+%{MONTHDAY}%{SPACE}+%{TIME}%{SPACE}+%{YEAR})\\]%{SPACE}+\\[\\:(?<log_level>%{WORD}+)\\]%{SPACE}+%{NOTSPACE}+.+client%{SPACE}+(?<source_ip>%{IP})\\]%{SPACE}+(?<error_message>ModSecurity%{NOTSPACE}+.+code%{SPACE}+(?<status_code>%{INT}).+)%{SPACE}+\\[file%{SPACE}+\\\"(?<rules_file>%{NOTSPACE}+.+)\\\"\\]%{SPACE}+\\[line%{SPACE}+\\\"(?<rule_line_num>%{INT})\\\"\\]%{SPACE}+\\[id%{SPACE}+\\\"(?<rule_id>%{INT})\\\"\\]%{SPACE}+\\[msg%{SPACE}+\\\"(?<msg>%{NOTSPACE}+.+)\\\"\\]%{SPACE}+\\[data%{SPACE}+\\\"(?<data>%{NOTSPACE}+.+)\\\"\\]%{SPACE}+\\[severity%{SPACE}+\\\"(?<severity>%{WORD}+)\\\"\\]%{SPACE}+\\[ver%{SPACE}+\\\"(?<owasp_crs_version>%{NOTSPACE}+)\\\"\\]%{SPACE}+(?<tags>%{NOTSPACE}+.+)%{SPACE}+\\[hostname%{SPACE}+\\\"(?<hostname>%{IPORHOST})\\\"\\]%{SPACE}+\\[uri%{SPACE}+\\\"(?<uri>/|%{NOTSPACE}+.+)\\\"\\]%{SPACE}+\\[unique_id%{SPACE}+\\\"(?<unique_id>%{NOTSPACE}+.+)\\\"\\]If not well escaped, you will get such an error as Invalid JSON String.
Create New Pipeline for Custom Log
Once you have grok pattern/filter for your custom log;
- Navigate to Kibana > main menu > Management > Stack Management > Ingest > Ingest Pipelines.
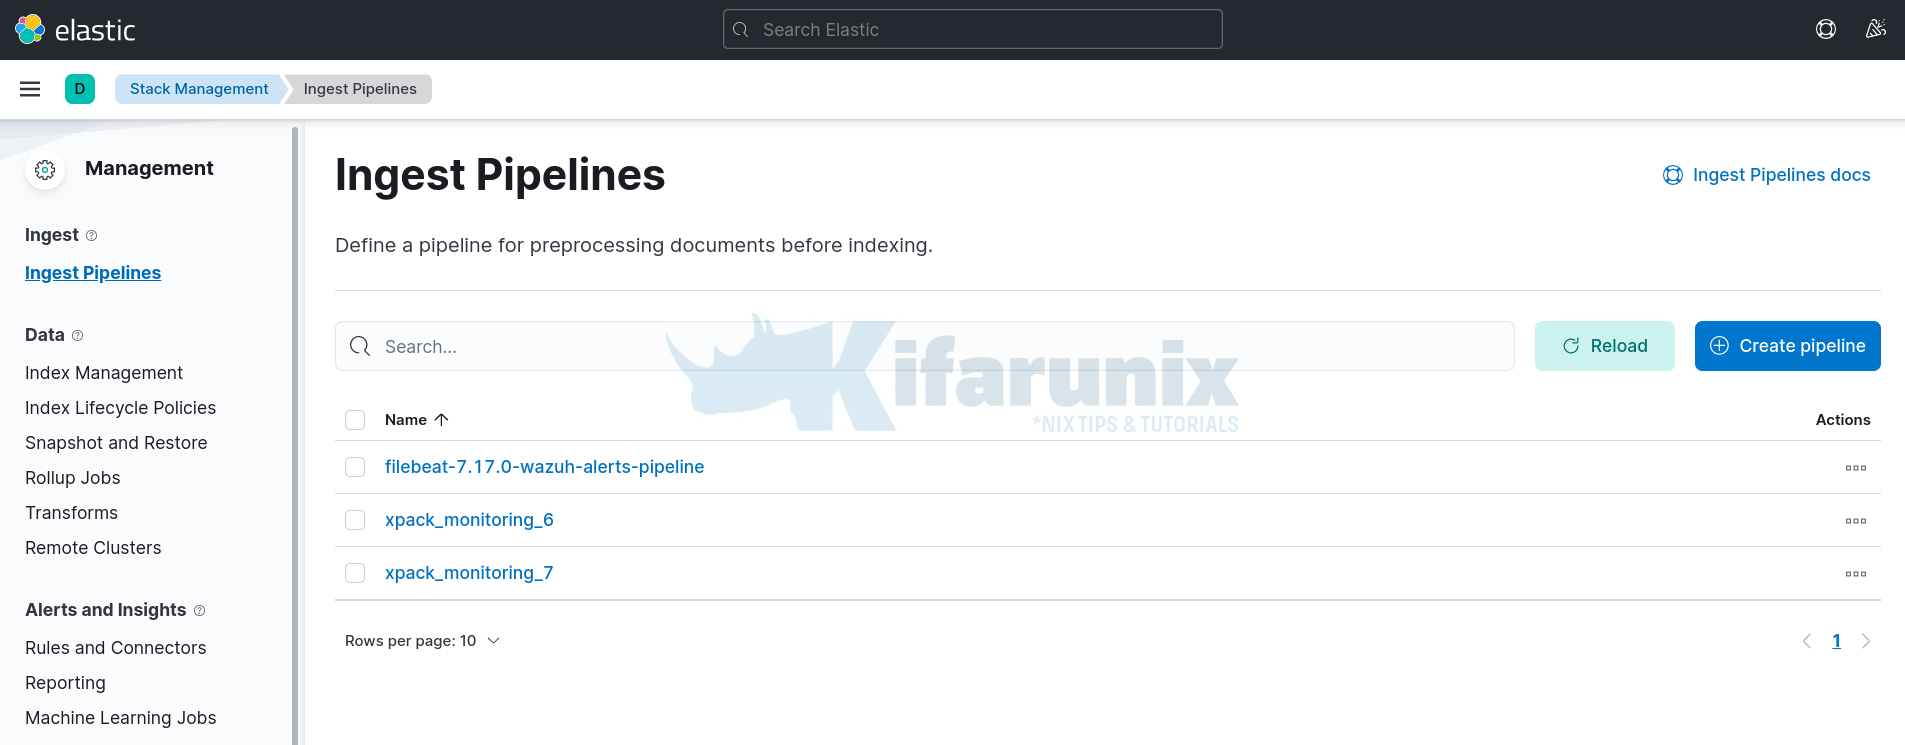
- Click Create Pipeline
- Enter the name of the pipeline
- Optionally add version number and description of the pipeline
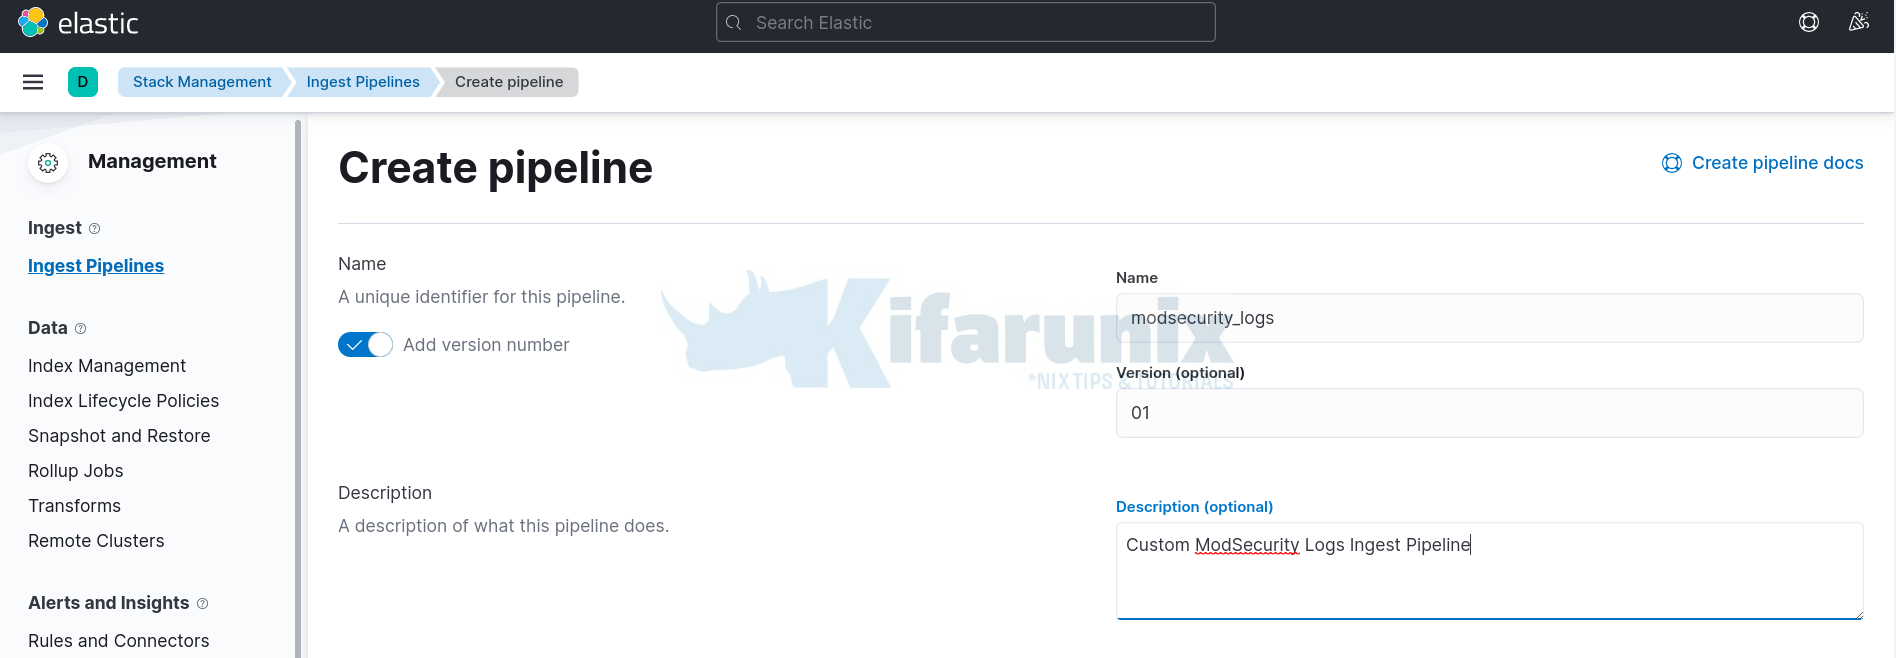
- Scroll down under Processors, and add a processor to use for transforming the custom log before indexing.
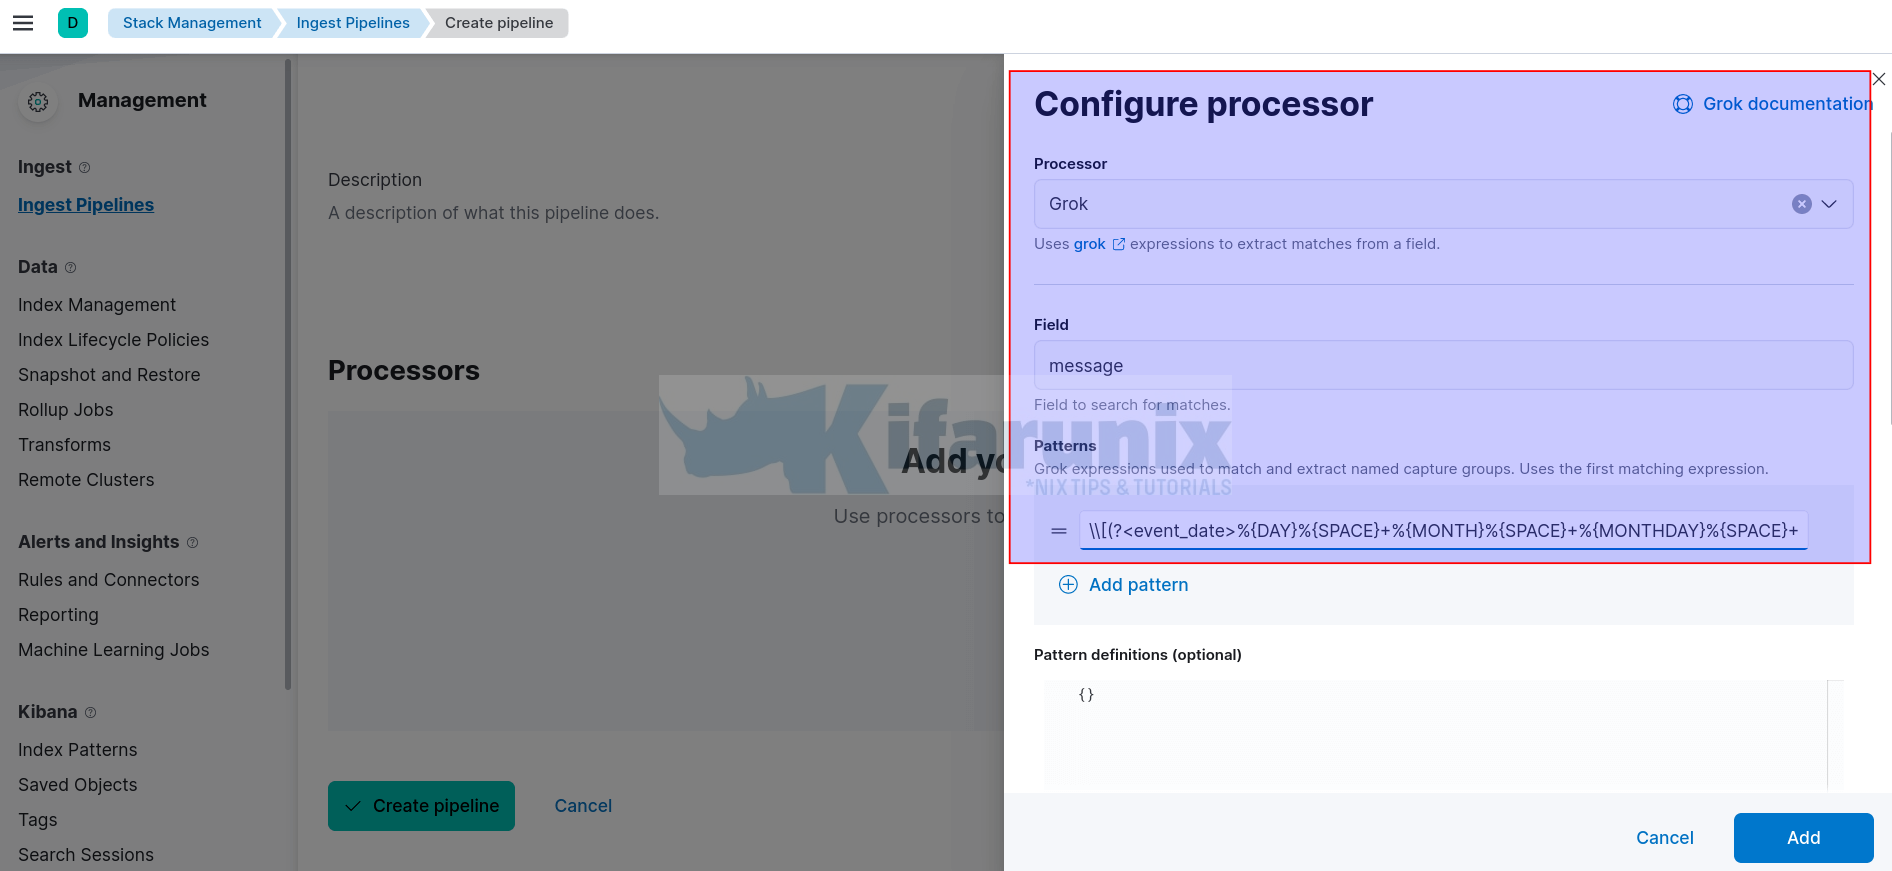
- We are using a Grok processor in this example.
- Hence, select appropriate processor for extracting the fields from the custom log, Grok.
- Field: use message.
- Patterns: Paste your well escaped custom log grok pattern. If not escaped well, you will get an error, Invalid JSON String.
- The rest of the settings are optional
- Click Add.
- Next, based on our custom fields, we need to convert the source_ip to GeoIP field. Hence, click Add a processor.
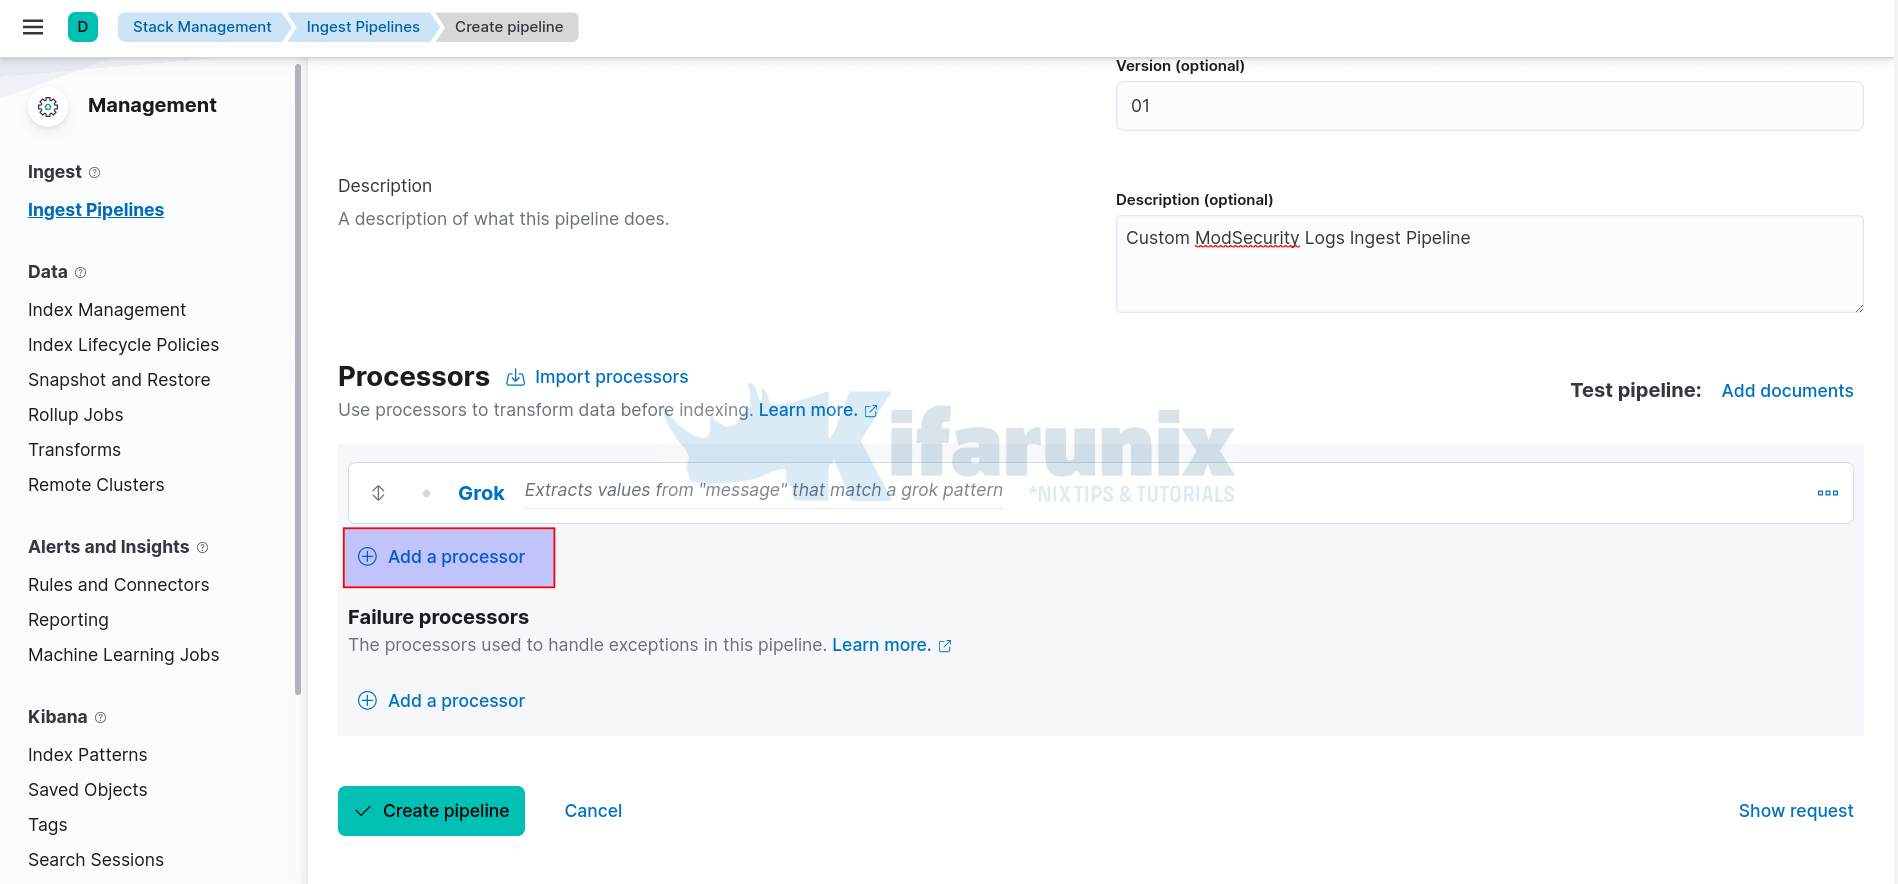
- Processor: select GeoIP
- Field: Enter your custom source IP field, in this example is source_ip.
- Leave other options default/
- You can disable First only.
- You can enable Ignore missing fields.
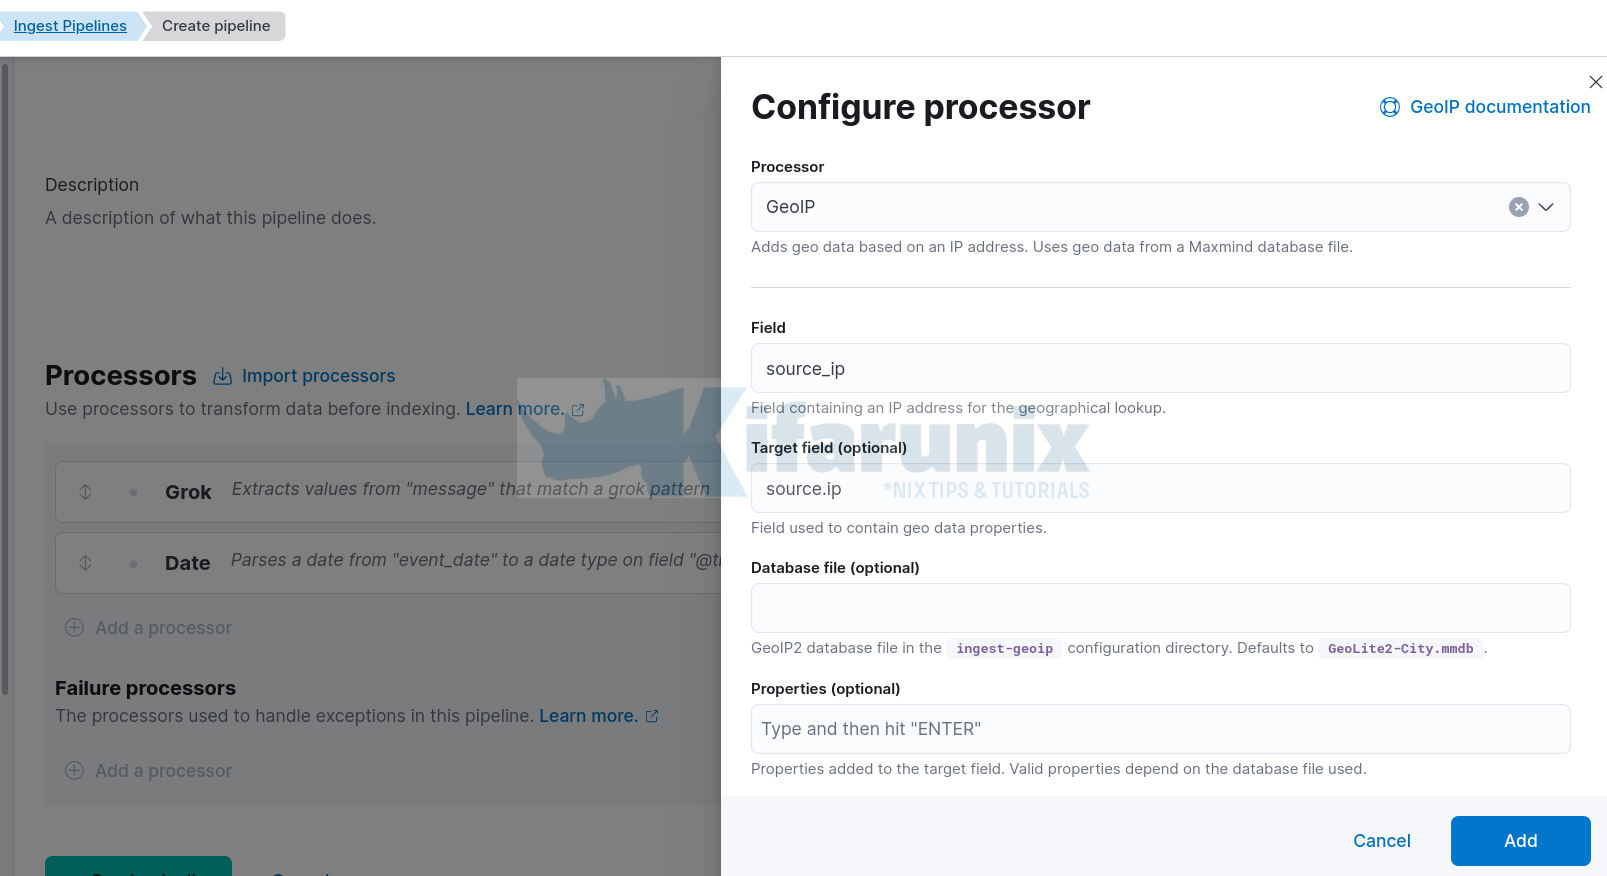
- Click Add.
- Your custom log processors now look like;

- Next, you need to configure the processor to process only specific logs that matches the pattern and drop the rest. Remember, in this example, the ModSecurity logs are written to Apache, which will contain other web server logs that will not match the pattern created. Hence, you can drop all messages that the pattern fails to parse.
- Therefore, under Failure processors, Add a processor;
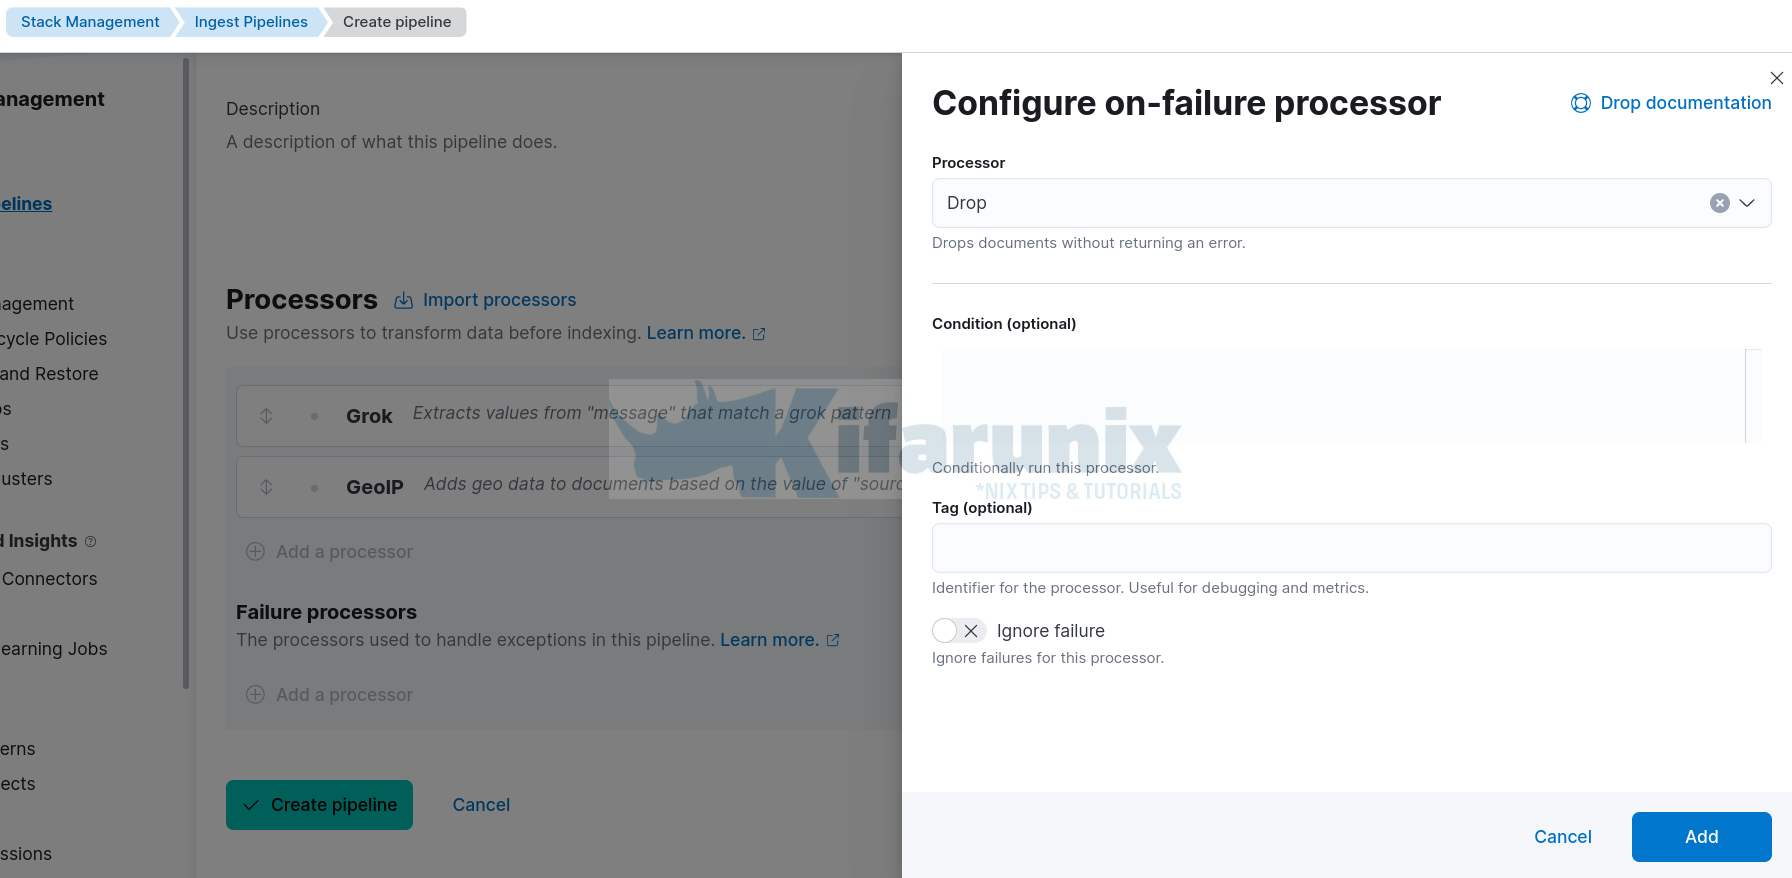
- Select Drop processor
- Leave other options with defaults
- Click Add.
Next;
- Click Create Pipeline to create your custom log pipeline processor.
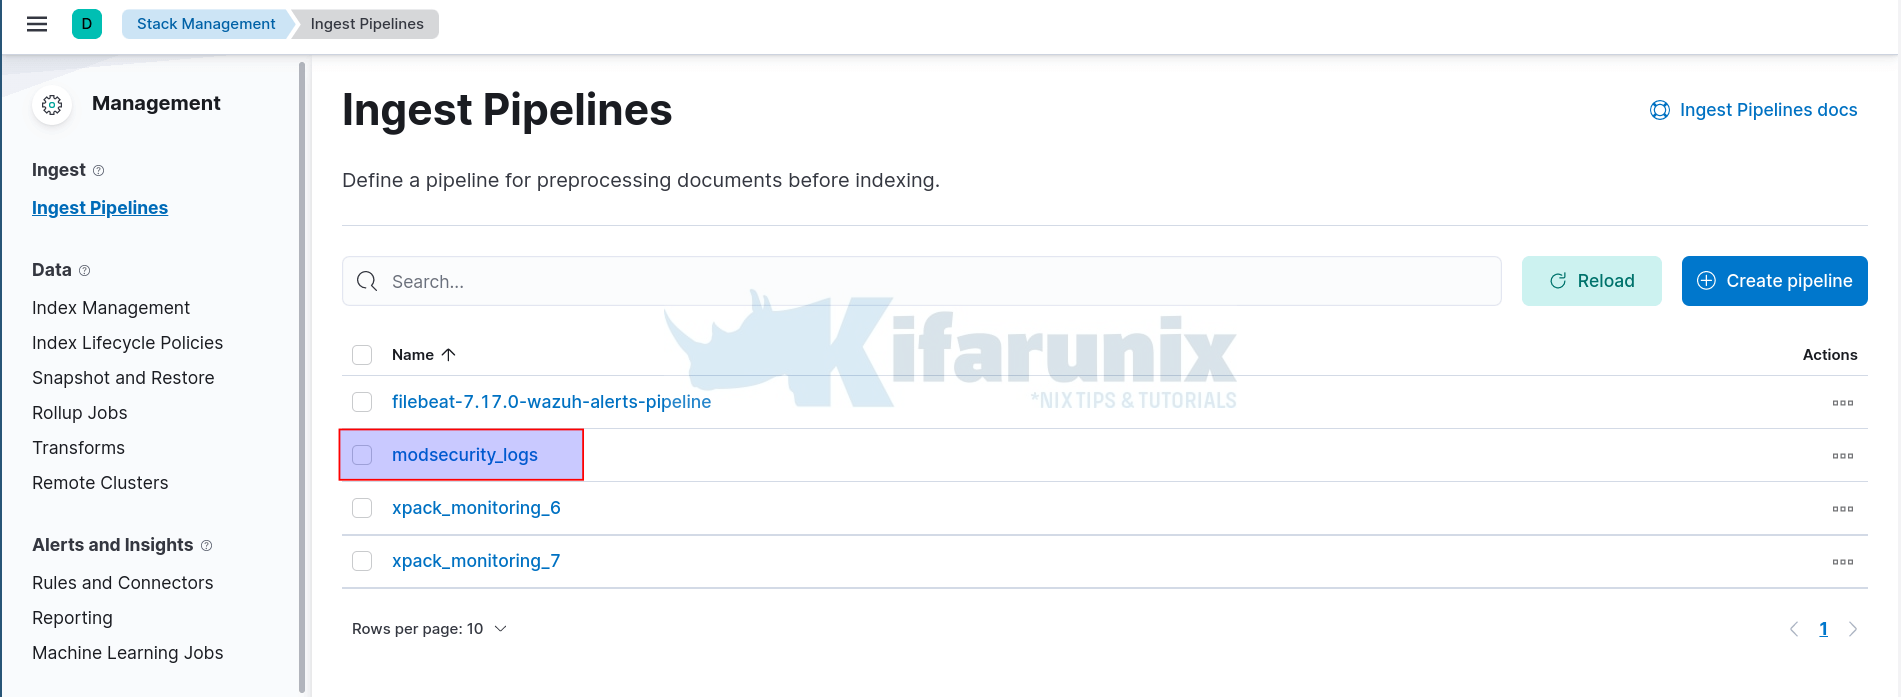
- Your pipeline should now appear under Ingest pipelines;
Configure Filebeat to Ship Custom Logs to Custom Ingest Pipeline
Next, you need to configure your data shippers, in our case, Filebeat to sent custom logs to the custom ingest pipeline.
You can refer to our various tutorials on how to install filebeat;
How to install Filebeat Data Shipper
In our web server (Ubuntu 22.04), we have deployed filebeat v7.17.0.
vim /etc/filebeat/filebeat.ymlWe are reading the Modsecurity logs from the Apache Web server error logs using the filestream input type;
filebeat.inputs:
- type: filestream
  enabled: true
  paths:
    - /var/log/apache2/error.log
To configure Filebeat to ship data to specific ingest pipeline, you need to add the pipeline option and the name of the pipeline under Elasticsearch output;
output.elasticsearch:
  hosts: ["192.168.58.22:9200"]
  pipeline: modsecurity_logs
In general, this is our sample Filebeat configuration file;
filebeat.inputs:
- type: filestream
  enabled: true
  paths:
    - /var/log/apache2/error.log
filebeat.config.modules:
  path: ${path.config}/modules.d/*.yml
  reload.enabled: false
setup.template.settings:
  index.number_of_shards: 1
setup.kibana:
output.elasticsearch:
  hosts: ["192.168.58.22:9200"]
  pipeline: modsecurity_logs
processors:
  - add_host_metadata:
      when.not.contains.tags: forwarded
seccomp:
  default_action: allow
  syscalls:
  - action: allow
    names:
    - rseq
With this config, Filebeat will create and use the default filebeat index on Elasticsearch. You can define your own custom index if you want.
Save and file and exit.
Test the configuration if all good.
filebeat test configEnsure the output is Config OK.
You can also check connection to Elasticsearch;
filebeat test outputStart Filebeat;
systemctl enable --now filebeatIf the logs are actively being written to the log file, Filebeat should have read, collect them and pushed them to the Elasticsearch index for processing.
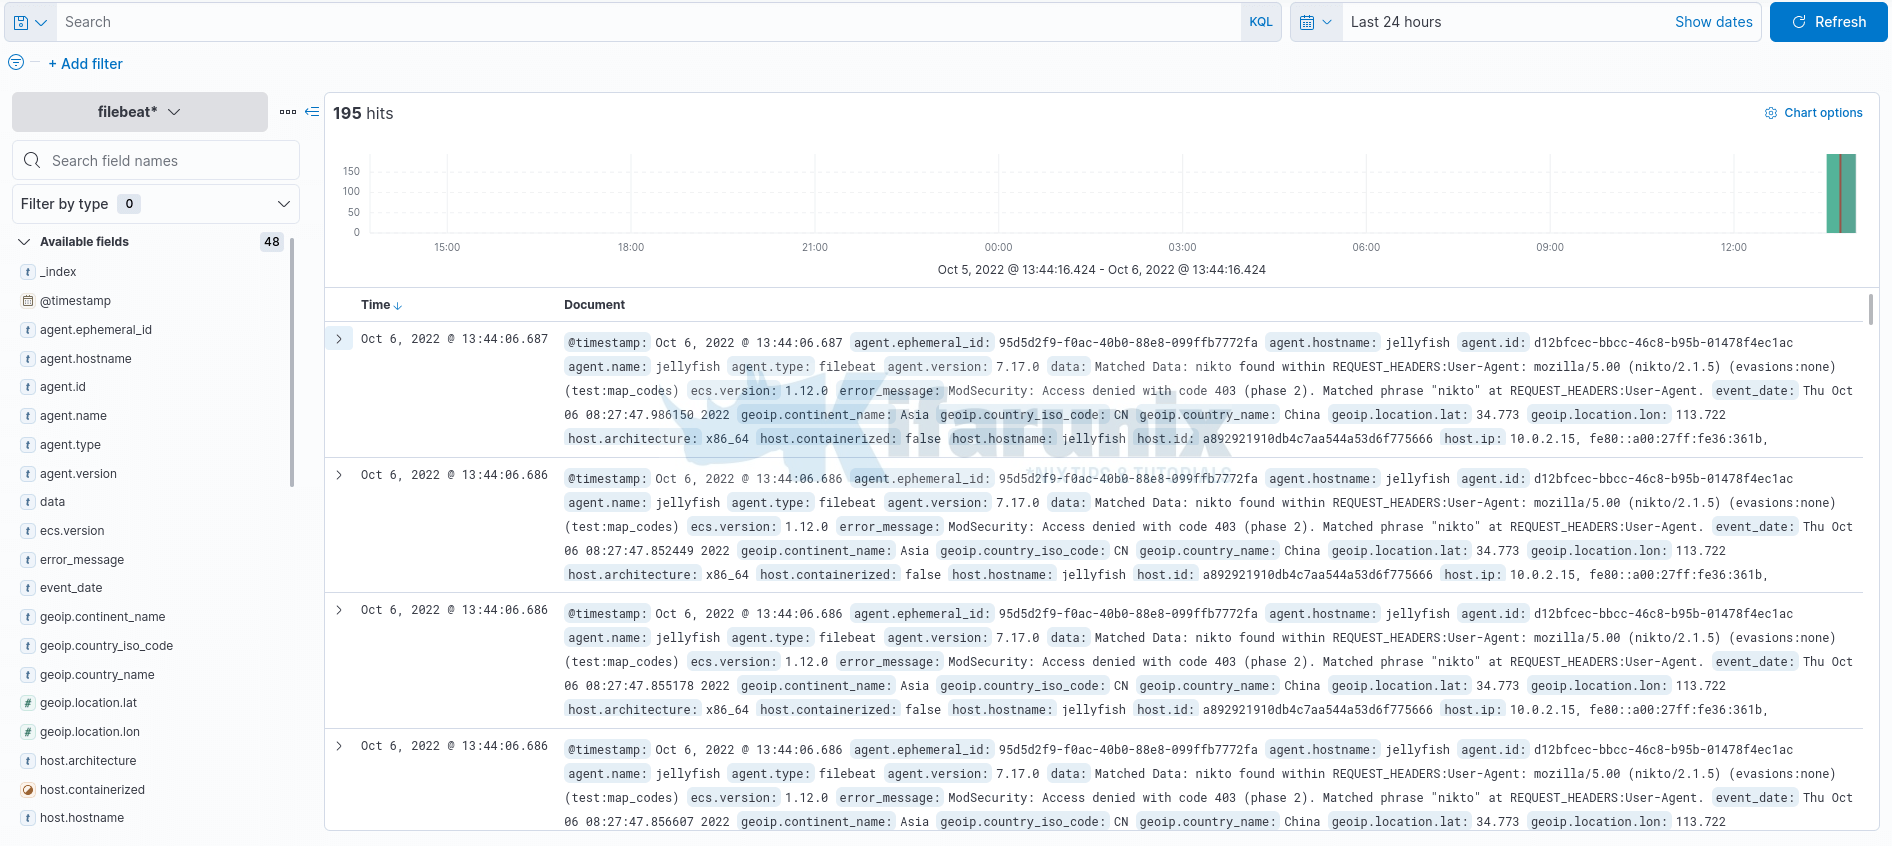
In our setup, the logs are written to Filebeat index pattern.
You can view the data on Kibana Discover menu;
Expanding one of the events;
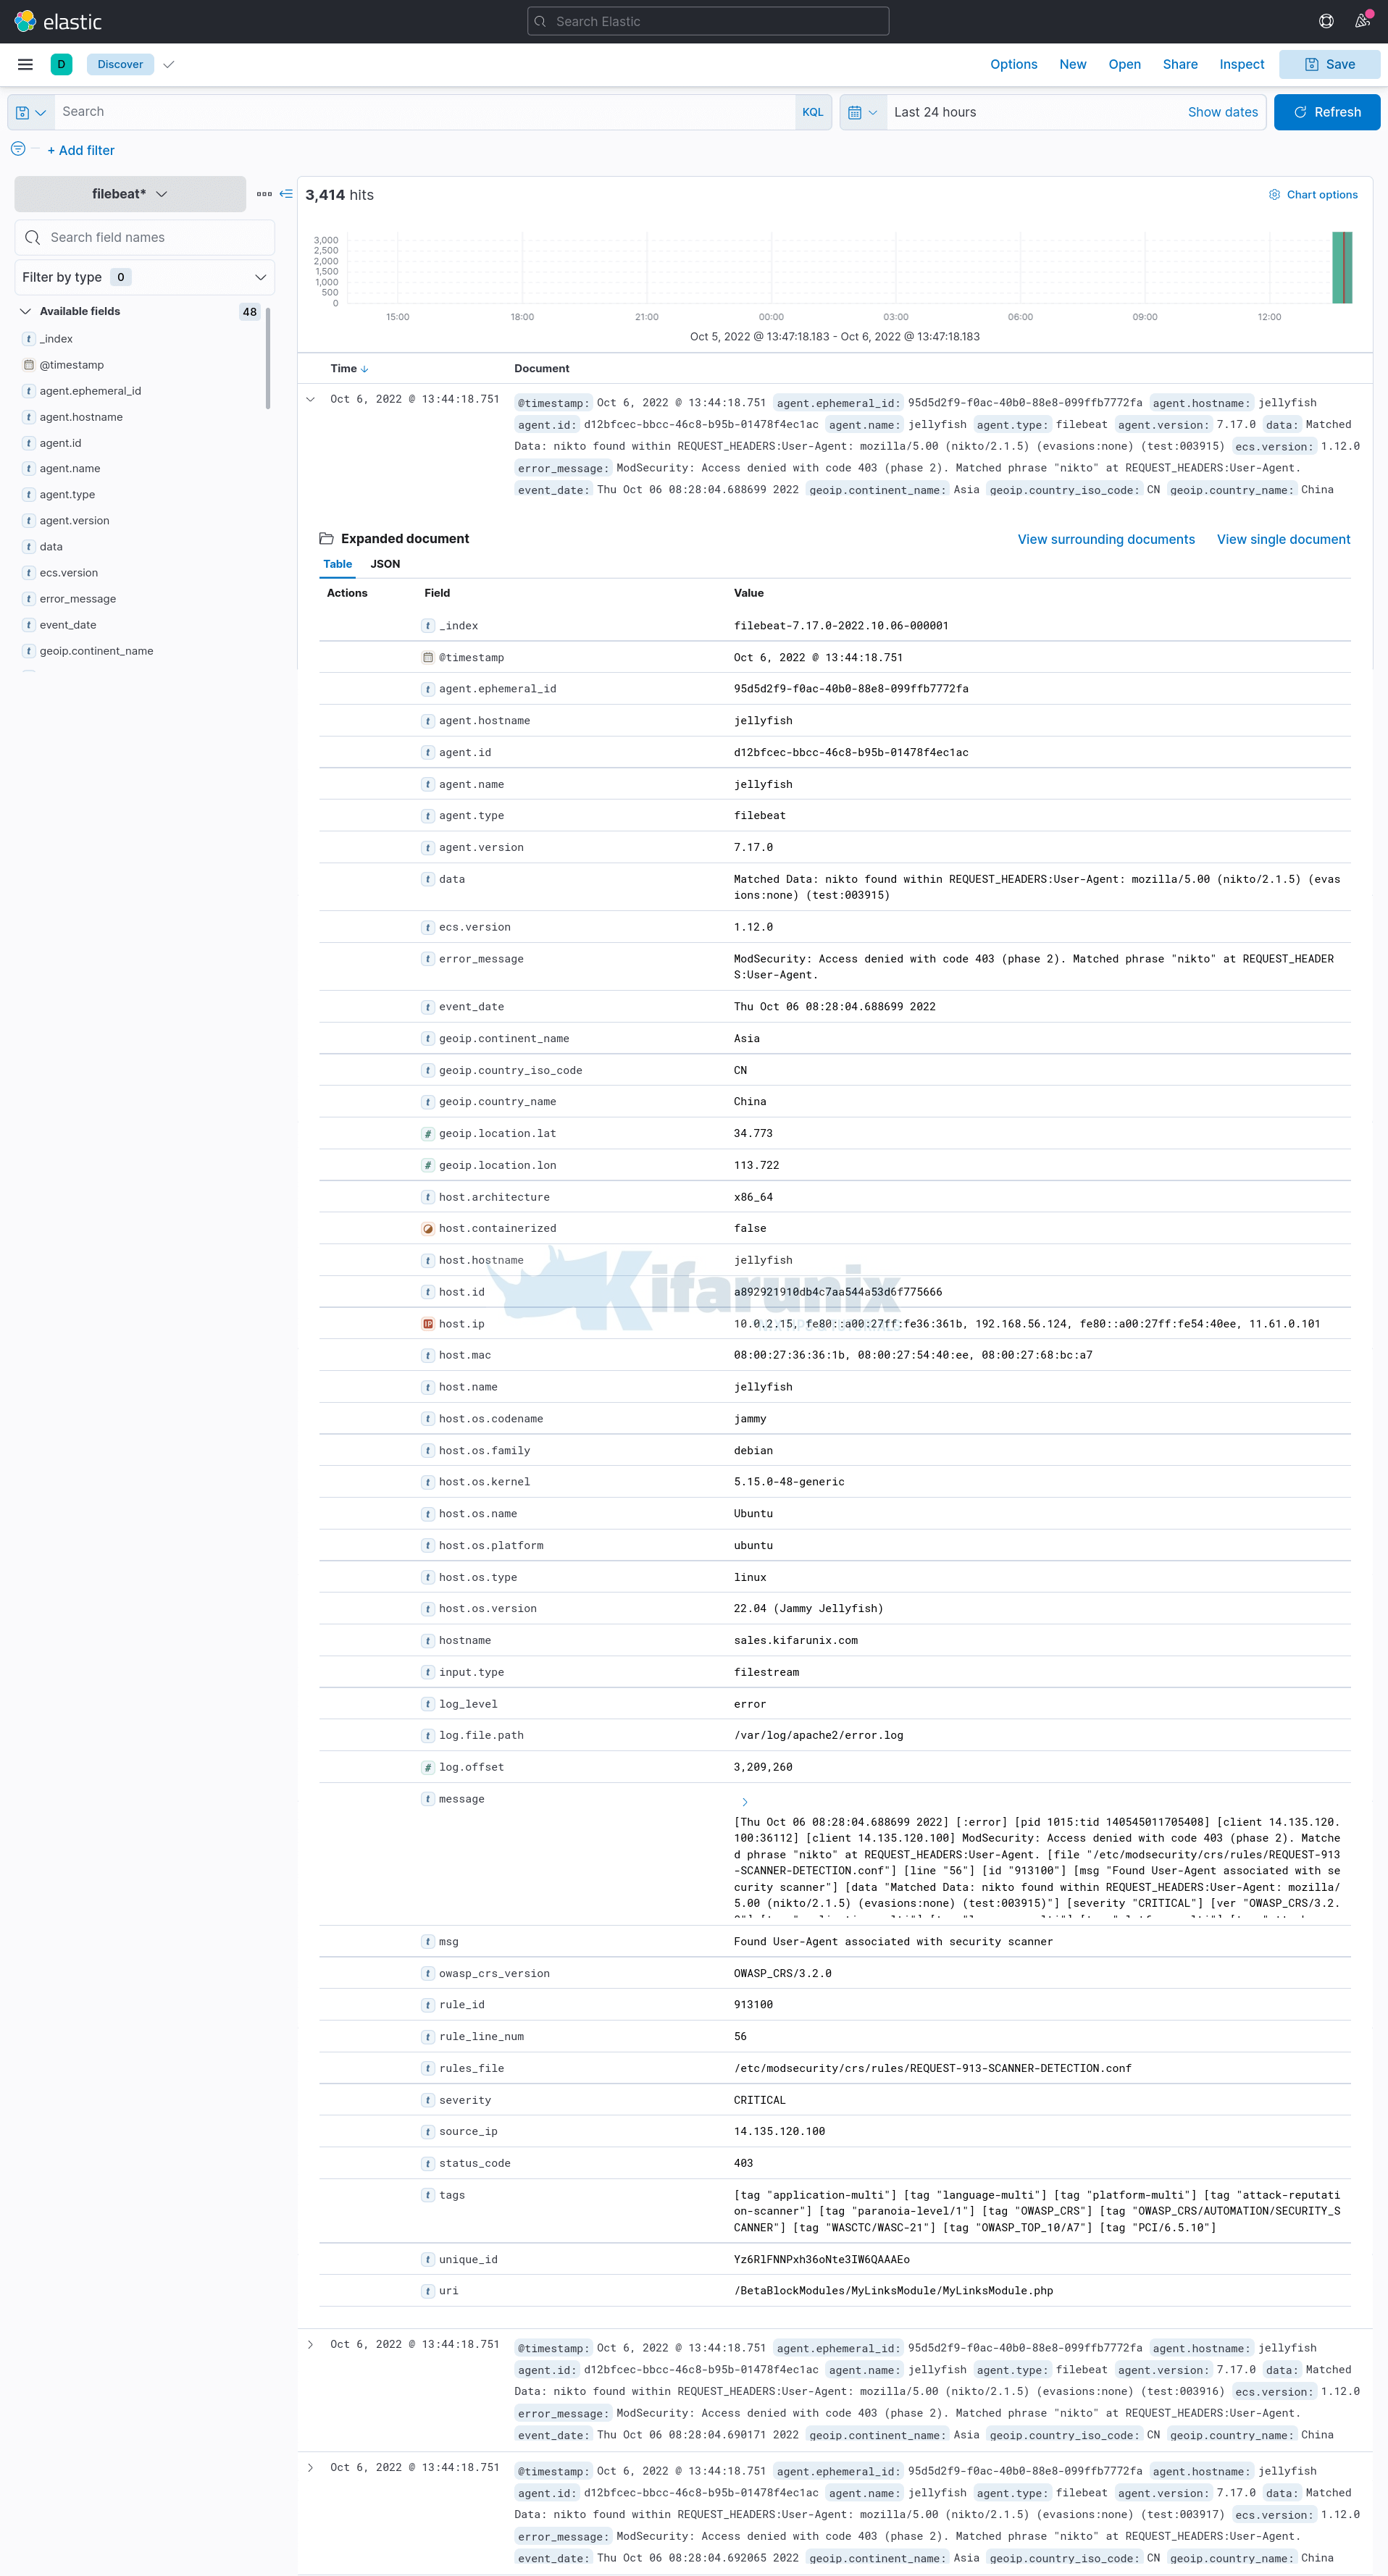
And that is how easy it is to use custom ingest pipelines to process custom logs.
That marks the end of our guide on how to create custom ELK ingest pipeline for custom log processing.

