In this guide, we are going to learn how to configure availability Monitoring on AlienVault USM/OSSIM using Nagios. AlienVault OSSIM is a feature-rich, open-source security information and event management (SIEM) that includes event collection, normalization, and correlation. It uses Nagios for host and service monitoring.
Table of Contents
AlienVault USM/OSSIM Nagios Configuration
We will cover how to configure host as well as service availability monitoring.
- Host monitoring reports whether an asset is up or down
- Services monitoring discovers services on an asset and monitors their availability.
AlienVault uses Nagios by default for host availability monitoring and it thus comes pre-configured with basic Nagios settings.
Create Custom Directory for Custom Nagios Configurations
The default Nagios configuration settings are located at /etc/nagios3/conf.d/. AlienVault has made the configuration of Nagios hosts, host services, hostsgroup or even the hostgroup services a bit easier. However, you can create your custom configuration directory under the /etc/nagios3/conf.d directory if you do not want to use the default Nagios configurations, for example;
mkdir /etc/nagios3/conf.d/myenv-configsCreate Contact and Contact group Object Definition
A contact definition is used to identify someone who should be contacted in the event of a problem on your network while contact group definition is used to define all the people who get notified when certain host or service problems occur.
Create your custom contact definition configuration file with the following contents.
vim /etc/nagios3/conf.d/myenv-configs/contacts.cfg
# With CONTACT DEFINITION, a single contact will receive all alerts.
define contact{
        name                            myevn-contact  <name of the contact template>
        service_notification_period     24x7
        host_notification_period        24x7
        service_notification_options    w,u,c,r
        host_notification_options       d,r
        service_notification_commands   notify-service-by-email
        host_notification_commands      notify-host-by-email
        register                        0
        }
# Define Individual Contact
define contact{
        contact_name                    johndoe
        use                             myevn-contact
        alias                           John Doe-Oracle DBA
        email                           [email protected]
        }
define contact{
        contact_name                    amos
        use                             myevn-contact
        alias                           Amos Mibey-System Admin
        email                           [email protected]
        }
# CONTACT GROUP DEFINITION allows multiple contacts to receive alerts
define contactgroup{
        contactgroup_name    admins
        alias                Sys-DB Admins
        members              johndoe,amos <names of the members as defined on contacts object>
       }
NOTE: multiple email contacts as well as contact group members can be defined by separating them with comma.
Create Host and Service Template Configuration
Create a custom host and service definition template as shown below. This template will be used to define hosts that resides in your environment and specific services to be monitored within them. Note that this is just a template.
vim /etc/nagios3/conf.d/myenv-configs/hosts-service-template.cfg
# Host Template Definition
define host{
name                         myenv-host
notifications_enabled        1
event_handler_enabled        1
flap_detection_enabled       1
failure_prediction_enabled   1
process_perf_data            1
retain_status_information    1
retain_nonstatus_information 1
        check_command                check-host-alive
        normal_check_interval        5
        max_check_attempts           2
        notification_interval        0
        notification_period          24x7
        notification_options         d,u,r
        contact_groups               admins < as defined in contacts >
register                     0
}

# Service Template definition
define service{
name                         myenv-service
active_checks_enabled        1
passive_checks_enabled       1
parallelize_check            1
obsess_over_service          1
check_freshness              0
notifications_enabled        1
event_handler_enabled        1
flap_detection_enabled       1
failure_prediction_enabled   1
process_perf_data            1
retain_status_information    1
retain_nonstatus_information 1
        notification_interval        0
        is_volatile                  0
        check_period                 24x7
        normal_check_interval        5
        retry_check_interval         1
        max_check_attempts           2
        notification_period          24x7
        notification_options         w,u,c,r
        contact_groups               admins < as defined in contacts >
register                     0
}
Create Monitoring Hosts and Hosts Groups
Next, you need to create a configuration files defining the hosts to be monitored. You may also group the hosts based on their functionality to make it easier to view the status of related hosts in the Nagios web interface and monitor services of the related hosts as a group.
As stated above, AlienVault makes this step easier as this can be done automatically from the Web UI. Therefore, login to AlienVault UI and navigate to Environment > Assets and Groups. To enable availability monitoring of a single host, select the host under Assets. Under Actions, enable availability monitoring. See screenshot below;

This will automatically create a configuration file called ossim-configs under the /etc/nagios3/conf.d/.
ls -1 /etc/nagios3/conf.d/ossim-configshost-services
hostgroup-services
hostgroups
hostsThe host definition configuration file for our host enabled for monitoring above, will be located under hosts directory.
cat /etc/nagios3/conf.d/ossim-configs/hosts/192.168.57.22.cfg
define host{
	host_name hr-server
	alias hr-server
	address 192.168.57.22
	use generic-host   < you can change this to reflect you custom template >
	}
If you need to enable availability monitoring for a group servers, select multiple hosts and add to an existing group or create a new group for them.

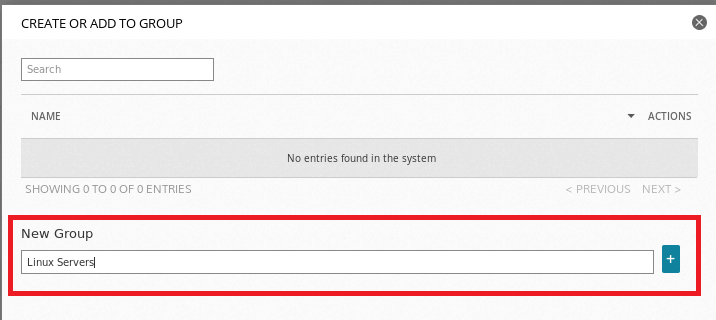
As you can see below, enter the name of the group, for example, Linux Servers and click the + button to create the group. You should now able to view your Server group under the Asset Groups.
Once the group is created, enable availability monitoring. See screenshot below.
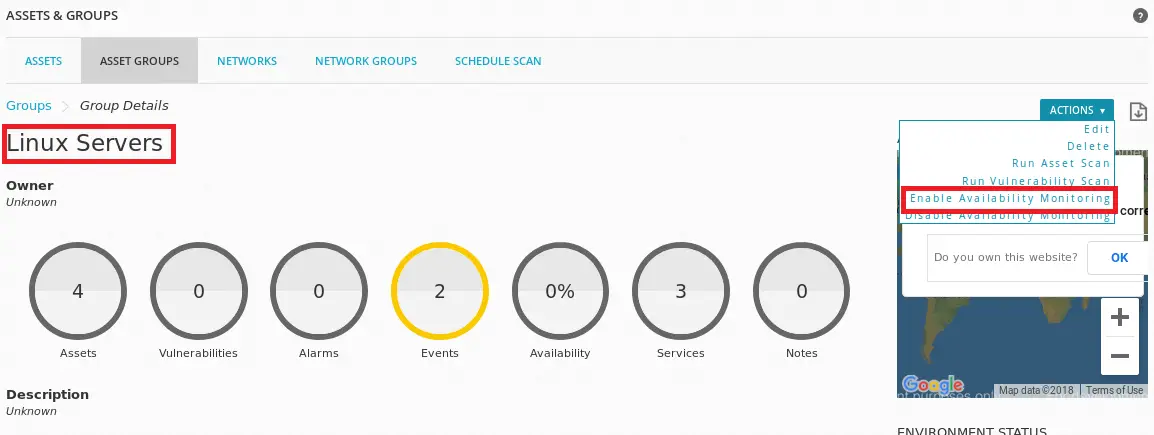
If you can check, this will automatically create individual host definition configuration file as well as the hostgroup definition file.
ls -1 /etc/nagios3/conf.d/ossim-configs/hosts/192.168.43.154.cfg
192.168.43.200.cfg
192.168.43.63.cfg
192.168.57.22.cfgTo check the hostgroup definition file;
cat /etc/nagios3/conf.d/ossim-configs/hostgroups/Linux\ Servers.cfg define hostgroup{
hostgroup_name Linux Servers
alias Linux Servers
members linuxservera,hr-server,solaris,ubuntu
}Also note that these configuration files can be deleted anytime you disable availability monitoring for a single host or hostgroup.
If however you need permanent configurations that cannot be overwritten, you can create your own custom host and hostgroup definition configurations. See the example below;
vim /etc/nagios3/conf.d/myenv-configs/hosts-hostgroups.cfg
# Hosts Definition
define host {
        use       myenv-host        < host template
        host_name servera.example.com
        alias     Test Server A
        address   192.168.43.63
}

define host {
        use       myenv-host
        host_name serverb.example.com
        alias     Test Server B
        address   192.168.43.218
}
# HostGroups Definition
define hostgroup{
        hostgroup_name LinuxServers
        alias          Linux Server
        members        servera.example.com
}
define hostgroup{
        hostgroup_name WindowsServers
        alias          WindowsServer
        members        serverb.example.com
}
Nagios Command Definition
Nagios commands defines the scripts or programs that Nagios should execute against a host in order to perform host and service checks, notifications, event handlers etc. In this tutorial, we are going to use two plugins to monitor remote hosts: check_nrpe and check_nt.
check_nrpewill be used to monitor remote Unix hosts while check_nt will be used to monitor Windows hosts.
vim /etc/nagios3/conf.d/myenv-configs/host-commands.cfg
# Command Definition
define command{
        command_name check_nrpe_all
        command_line /usr/lib/nagios/plugins/check_nrpe -H $HOSTADDRESS$ -c $ARG1$
}

define command{
        command_name check_nt1
        command_line /usr/lib/nagios/plugins/check_nt -H $HOSTADDRESS$ -p 12489 -s PASSWORD -v $ARG1$ $ARG2$
}
Note the password and the port set for the check_nt command. The agent on the host should be set with the same password.
Install NRPE Plugins on AlienVault USM/OSSIM
The NRPE plugins are not included by default on AlienVault USM/OSSIM. Thus run the command below to install;
apt-get install nagios-nrpe-pluginThe check_nrpe command should now be available under /usr/lib/nagios/plugins/.
Define Host Services for Monitoring
Services are one of the central objects in the monitoring logic. Services are associated with hosts and can be attributes of a host such as CPU load, disk usage, uptime,running processes, number of logged in users etc or services provided by the host such HTTP, POP3, FTP, SSH, etc.
vim /etc/nagios3/conf.d/myenv-configs/hosts-services.cfg
# Services for Linux Servers
define service
        use                     myenv-service   < service template
        hostgroup_name          LinuxServers
        service_description     Logged in Users
        check_command           check_nrpe_all!check_users
        }
define service{
        use                     myenv-service
        hostgroup_name          LinuxServers
        service_description     Disk Usage
        check_command           check_nrpe_all!check_disk
        }
define service{
        use                     myenv-service
        hostgroup_name          LinuxServers
        service_description     Swap Memory
        check_command           check_nrpe_all!check_swap
        }
define service{
        use                     myenv-service
        hostgroup_name          LinuxServers
        service_description     CPU Load
        check_command           check_nrpe_all!check_load
        }

define service{
        use                     myenv-service
        hostgroup_name          LinuxServers
        service_description     Running Procs
        check_command           check_nrpe_all!check_procs
        }
# Services for Windows
define service{
        use                     myenv-service
        hostgroup_name          WindowsServers
        service_description     Disk Usage
        check_command           check_nt1!USEDDISKSPACE!-l c -w 80 -c 90
        }
define service{
        use                     myenv-service
        hostgroup_name          WindowsServers
        service_description     Memory Usage
        check_command           check_nt1!MEMUSE!-w 80 -c 90
        }
define service{
        use                     myenv-service
        hostgroup_name          WindowsServers
        service_description     CPU Usage
        check_command           check_nt1!CPULOAD!-l 5,80,90
        }
Install Nagios NRPE and NSClient Monitoring Agents on the Hosts
To monitor the hosts, you need to install the monitoring agents on them. Check our other tutorials on the same using the links below;
- How to Install Nagios NRPE Monitoring Agent on Linux Host From the Source
- How to Install Nagios NSClient++ Monitoring Agent on Windows System
Test the Plugins
Once you are done with the installation of the Nagios agents on the hosts, run the commands below to verify that NRPE is executing plugins correctly.
Linux Hosts
For Linux Server, test for the load, logged in users, total running processes, swap by running the commands below.
/usr/lib/nagios/plugins/check_nrpe -H 192.168.43.63 -c check_loadOK - load average per CPU: 0.00, 0.01, 0.03|load1=0.000;8.000;11.000;0; load5=0.015;7.500;10.000;0; load15=0.025;7.000;9.000;0;/usr/lib/nagios/plugins/check_nrpe -H 192.168.43.63 -c check_usersUSERS OK - 2 users currently logged in |users=2;5;10;0/usr/lib/nagios/plugins/check_nrpe -H 192.168.43.63 -c check_swap SWAP OK - 100% free (1022 MB out of 1023 MB) |swap=1022MB;0;0;0;1023/usr/lib/nagios/plugins/check_nrpe -H 192.168.43.63 -c check_procsPROCS OK: 113 processes | procs=113;300;400;0;Windows Hosts
For Windows systems, run the tests as follows;
/usr/lib/nagios/plugins/check_nt -H 192.168.43.218 -p 12489 -s STRONGPASSWORD -v CPULOAD -l 5,80,90CPU Load 0% (5 min average) | '5 min avg Load'=0%;80;90;0;100/usr/lib/nagios/plugins/check_nt -H 192.168.43.218 -p 12489 -s STRONGPASSWORD -v USEDDISKSPACE -l c -w 80 -c 90c:\ - total: 34.08 Gb - used: 32.89 Gb (96%) - free 1.19 Gb (4%) | 'c:\ Used Space'=32.89Gb;27.26;30.67;0.00;34.08/usr/lib/nagios/plugins/check_nt -H 192.168.43.218 -p 12489 -s STRONGPASSWORD -v MEMUSE -w 80 -c 90 Memory usage: total:2047.57 MB - used: 1079.53 MB (53%) - free: 968.04 MB (47%) | 'Memory usage'=1079.53MB;1638.06;1842.81;0.00;2047.57Perfect, you are doing great.
Restart Nagios on OSSIM
Before you can restart Nagios, run the command below to check for any errors in the configuration files.
If you encounter any error, fix it before you can restart Nagios.
nagios3 -v /etc/nagios3/nagios.cfgIf everything is okay, you should see the sample output below;
...output cut...

Total Warnings: 0
Total Errors: 0

Things look okay - No serious problems were detected during the pre-flight check
Run the command below to restart nagios service
/etc/init.d/nagios3 restartVerify Nagios Availability Monitoring on AlienVault USM/OSSIM
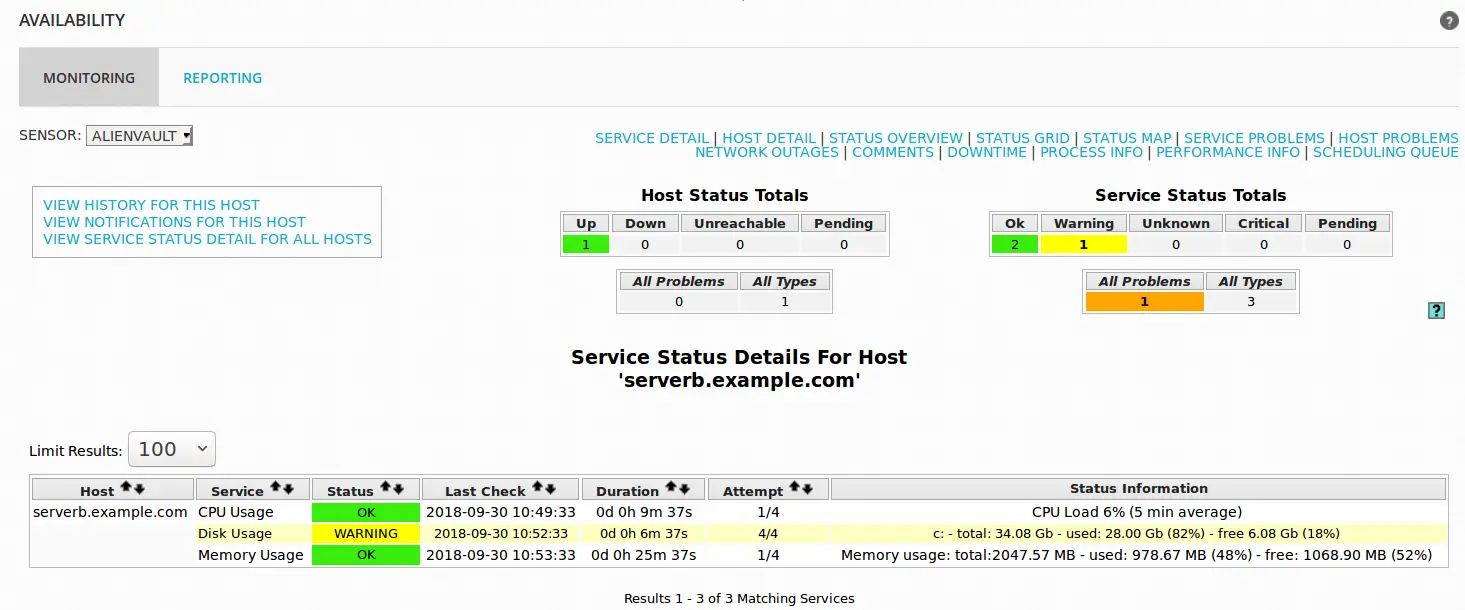
Login to AlienVault UI and navigate to Availability monitoring page to check the status of the hosts. After a few minutes, you should be able to see status of each host.
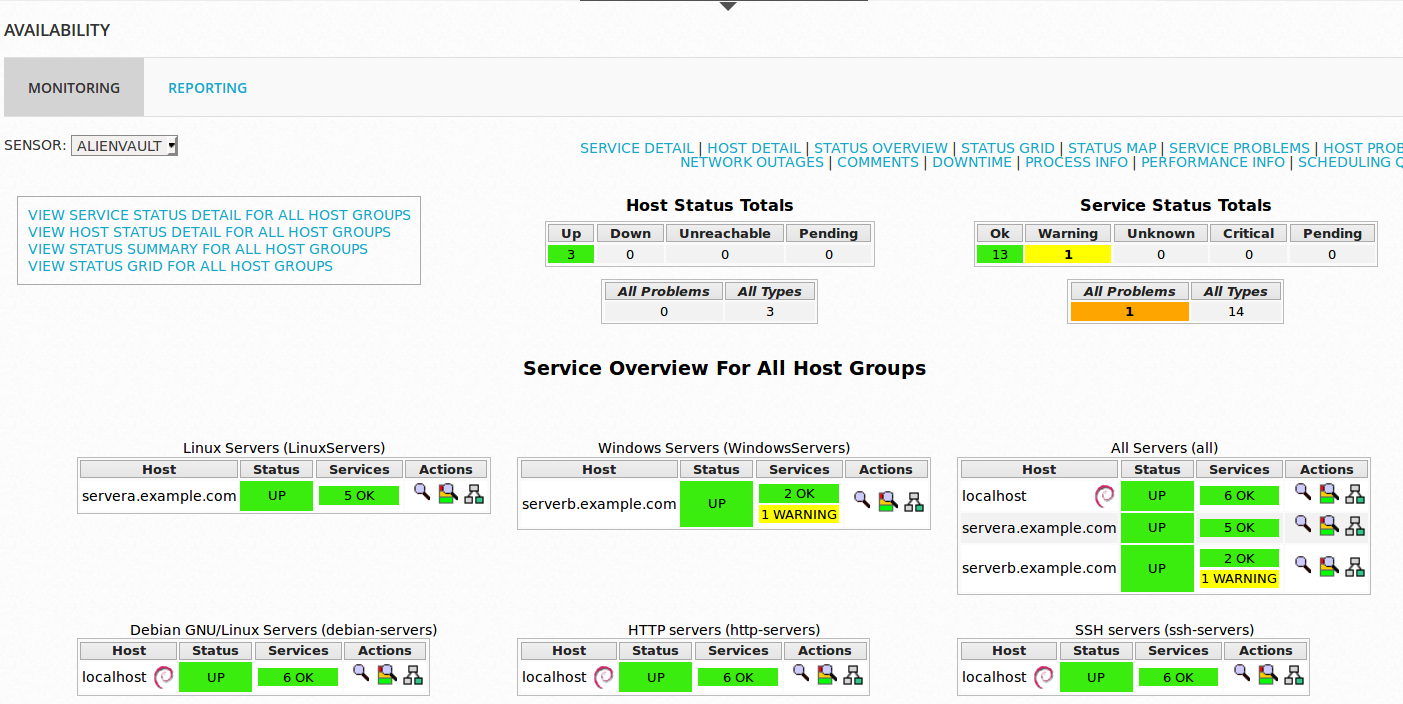
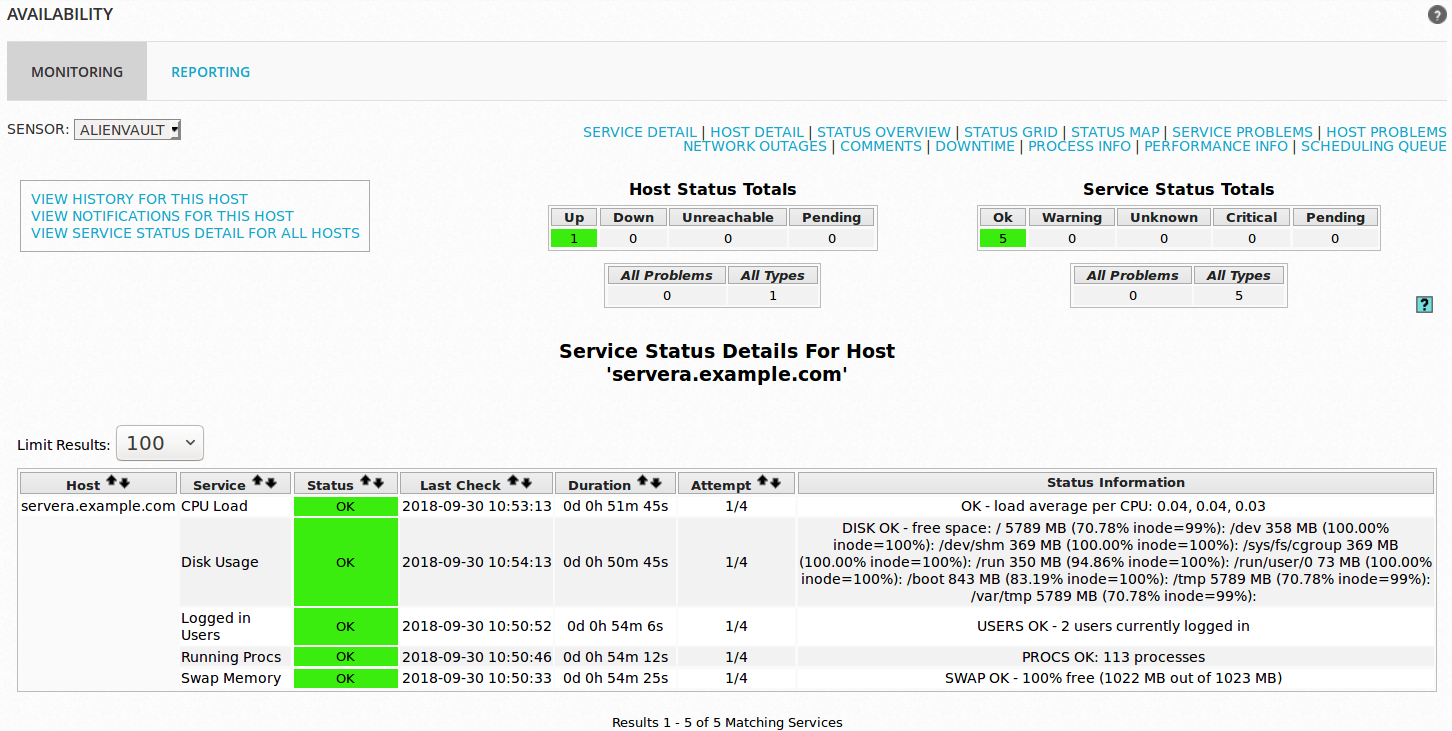
You can click on the specific server to see service status details.
Linux Server status details
Windows Server status details
Phew!!, that is all about how to configure availability monitoring on AlienVault USM or OSSIM using Nagios.

