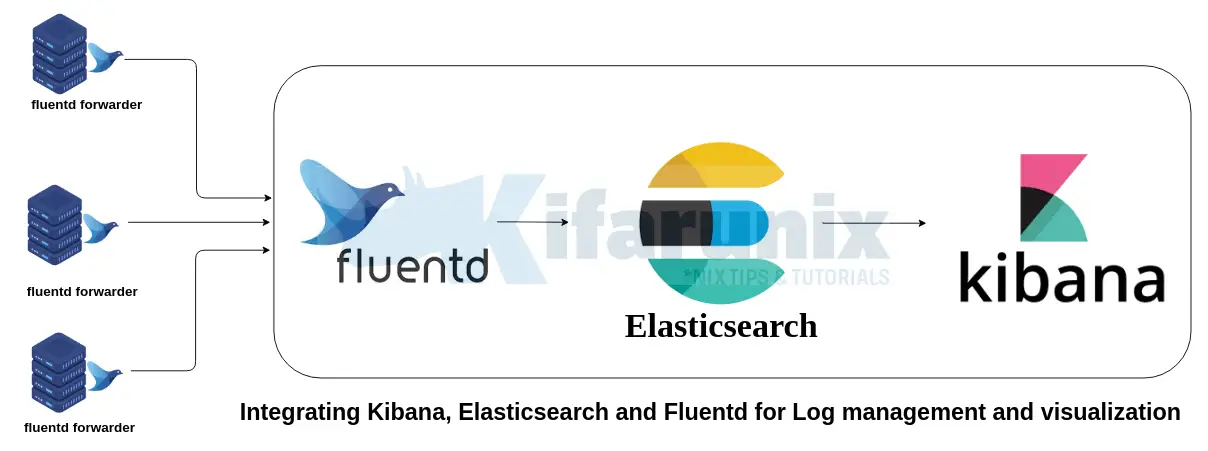
Hello there. In this tutorial, you will learn how to setup Kibana Elasticsearch and Fluentd on CentOS 8. Normally, you would setup Elasticsearch with Logstash, Kibana and beats. But in this setup, we will see how Fluentd can be used instead of Logstash and Beats to collect and ship logs to Elasticsearch, a search and analytics engine. So, what is Fluentd? Fluentd “is an open source data collector for unified logging layer”. It can act as a log aggregator (sits on the same server as Elasticsearch for example) and as a log forwarder (collecting logs from the nodes being monitored).

Below are the the key features of Fluentd.
- Provides unified logging with JSON: Fluentd attempts to structure collected data as JSON thus allowing it to unify all facets of processing log data: collecting, filtering, buffering, and outputting logs across multiple sources and destinations. This makes it easy for the data processors to process the data,
- Supports a pluggable architecture: This makes it easy for the community to extend the functionality of the Fluentd as they can develop any custom plugins to collect their logs.
- Consumes minimum system resources: Fluentd requires very little system resources with the vanilla version requiring between 30-40 MB of memory and can process 13,000 events/second/core. There also exists a Fluentd lightweight forwarder called Fluent Bit.
- Built-in Reliability: Fluentd supports memory and file-based buffering to prevent inter-data node loss. Fluentd also supports robust failover and can be set up for high availability.
Install and Configure Kibana, Elasticsearch and Fluentd
In order to setup Kibana, Elasticsearch and Fluentd, we will install and configure each component separately as follows.
Creating Elastic Stack Repository on CentOS 8
Run the command below to create Elastic Stack version 7.x repo on CentOS 8.
cat > /etc/yum.repos.d/elasticstack.repo << EOL
[elasticstack]
name=Elastic repository for 7.x packages
baseurl=https://artifacts.elastic.co/packages/7.x/yum
gpgcheck=1
gpgkey=https://artifacts.elastic.co/GPG-KEY-elasticsearch
enabled=1
autorefresh=1
type=rpm-md
EOL
Run system package update.
dnf updateInstall Elasticsearch on CentOS 8
Install Elasticsearch on CentOS 8 from the Elastic repos;
dnf install elasticsearchConfiguring Elasticsearch
Out of the box, Elasticsearch works well with the default configuration options. In this setup, we will make a few changes as per Important Elasticsearch Configurations.
Set the Elasticsearch bind address to a specific system IP if you need to enable remote access either from Kibana. Replace the IP, 192.168.56.154, with your appropriate server IP address.
sed -i 's/#network.host: 192.168.0.1/network.host: 192.168.56.154/' /etc/elasticsearch/elasticsearch.ymlYou can as well leave the default settings to only allow local access to Elasticsearch.
When configured to listen on a non-loopback interface, Elasticsearch expects to join a cluster. But since we are setting up a single node Elastic Stack, you need to specify in the ES configuration that this is a single node setup, by entering the line, discovery.type: single-node, under discovery configuration options. However, you can skip this if your ES is listening on a loopback interface.
vim /etc/elasticsearch/elasticsearch.yml# --------------------------------- Discovery ----------------------------------
#
# Pass an initial list of hosts to perform discovery when this node is started:
# The default list of hosts is ["127.0.0.1", "[::1]"]
#
#discovery.seed_hosts: ["host1", "host2"]
#
# Bootstrap the cluster using an initial set of master-eligible nodes:
#
#cluster.initial_master_nodes: ["node-1", "node-2"]
# Single Node Discovery
discovery.type: single-nodeNext, configure JVM heap size to no more than half the size of your memory. In this case, our test server has 2G RAM and the heap size is set to 512M for both maximum and minimum sizes.
vim /etc/elasticsearch/jvm.options...
################################################################
# Xms represents the initial size of total heap space
# Xmx represents the maximum size of total heap space
-Xms512m
-Xmx512m
...Start and enable ES to run on system boot.
systemctl daemon-reload
systemctl enable --now elasticsearch
Verify that Elasticsearch is running as expected.
curl -XGET 192.168.56.154:9200{
"name" : "centos8.kifarunix-demo.com",
"cluster_name" : "elasticsearch",
"cluster_uuid" : "rVPJG0k9TKK9-I-mVmoV_Q",
"version" : {
"number" : "7.9.1",
"build_flavor" : "default",
"build_type" : "rpm",
"build_hash" : "083627f112ba94dffc1232e8b42b73492789ef91",
"build_date" : "2020-09-01T21:22:21.964974Z",
"build_snapshot" : false,
"lucene_version" : "8.6.2",
"minimum_wire_compatibility_version" : "6.8.0",
"minimum_index_compatibility_version" : "6.0.0-beta1"
},
"tagline" : "You Know, for Search"
}Install Kibana on CentOS 8
The next Elastic Stack component to install is Kabana. Since we already created the Elastic Stack repos, you can simply run the command below to install it.
yum install kibanaConfiguring Kibana
To begin with, you need to configure Kibana to allow remote access. By default, it allows local access on port 5601/tcp. Hence, open the Kibana configuration file for editing and uncomment and change the following lines;
vim /etc/kibana/kibana.yml...
#server.port: 5601
...
# To allow connections from remote users, set this parameter to a non-loopback address.
#server.host: "localhost"
...
# The URLs of the Elasticsearch instances to use for all your queries.
#elasticsearch.hosts: ["http://localhost:9200"]Such that it look like as shown below:
Replace the IP addresses of Kibana and Elasticsearch accordingly. Note that in this demo, All Elastic Stack components are running on the same host.
...
server.port: 5601
...
# To allow connections from remote users, set this parameter to a non-loopback address.
server.host: "192.168.56.154"
...
# The URLs of the Elasticsearch instances to use for all your queries.
elasticsearch.hosts: ["http://192.168.56.154:9200"]
Start and enable Kibana to run on system boot.
systemctl enable --now kibanaOpen Kibana Port on FirewallD, if it is running;
firewall-cmd --add-port=5601/tcp --permanentfirewall-cmd --reloadAccessing Kibana Interface
You can now access Kibana from your browser by using the URL, http://kibana-server-hostname-OR-IP:5601.
On Kibana web interface, you can choose to try sample data since we do not have any data being sent to Elasticsearch yet. You can as well choose to explore your own data, of course after sending data to ES.
Install and Configure Fluentd on CentOS 8
Next, install and configure Fluentd to collect logs into Elasticsearch. On the same server running Elasticsearch, we will install Fluentd aggregator so it can receive logs from the end point nodes using the Fluentd forwarder.
Prereqs of Installing Fluentd
There are a number of requirements that you need to consider while setting up Fluentd.
- Ensure that your system time is synchronized with the up-to-date time server (NTP) so that the logs can have the correct event timestamp entries.
- Increase the maximum number of open file descriptors. By default, the max number of open file descriptors is set to 1024;
ulimit -n1024You can set the max number to 65536 by editing the limits.conf file and adding the lines below;
vim /etc/security/limits.confroot soft nofile 65536
root hard nofile 65536
* soft nofile 65536
* hard nofile 65536- Next, if you gonna have several Fluentd nodes with the high load being expected, you need to adjust some Network kernel parameter.
cat >> /etc/sysctl.conf << 'EOL'
net.core.somaxconn = 1024
net.core.netdev_max_backlog = 5000
net.core.rmem_max = 16777216
net.core.wmem_max = 16777216
net.ipv4.tcp_wmem = 4096 12582912 16777216
net.ipv4.tcp_rmem = 4096 12582912 16777216
net.ipv4.tcp_max_syn_backlog = 8096
net.ipv4.tcp_slow_start_after_idle = 0
net.ipv4.tcp_tw_reuse = 1
net.ipv4.ip_local_port_range = 10240 65535
EOL
Update the changes by rebooting your system or by just running the command below;
sysctl -pInstall Fluentd Aggregator on CentOS 8
Fluentd installation has been made easier through the use of the td-agent (Treasure Agent), an RPM package that provides a stable distribution of Fluentd based data collector and is managed and maintained by Treasure Data, Inc.
To install td-agent package, run the command below to download and execute a script that will create the td-agent RPM repository and installs td-agent on CentOS 8.
dnf install curlcurl -L https://toolbelt.treasuredata.com/sh/install-redhat-td-agent4.sh | shRunning Fluentd td-agent on CentOS 8
When installed, td-agent installs a systemd service unit for managing it. You can therefore start and enable it to run on system boot by executing the command below;
systemctl enable --now td-agentTo check the status;
systemctl status td-agent● td-agent.service - td-agent: Fluentd based data collector for Treasure Data
Loaded: loaded (/usr/lib/systemd/system/td-agent.service; enabled; vendor preset: disabled)
Active: active (running) since Fri 2020-09-18 22:09:40 EAT; 29s ago
Docs: https://docs.treasuredata.com/articles/td-agent
Process: 2543 ExecStart=/opt/td-agent/bin/fluentd --log $TD_AGENT_LOG_FILE --daemon /var/run/td-agent/td-agent.pid $TD_AGENT_OPTIONS (code=exited, status=0/SUCCESS)
Main PID: 2549 (fluentd)
Tasks: 9 (limit: 5027)
Memory: 89.4M
CGroup: /system.slice/td-agent.service
├─2549 /opt/td-agent/bin/ruby /opt/td-agent/bin/fluentd --log /var/log/td-agent/td-agent.log --daemon /var/run/td-agent/td-agent.pid
└─2552 /opt/td-agent/bin/ruby -Eascii-8bit:ascii-8bit /opt/td-agent/bin/fluentd --log /var/log/td-agent/td-agent.log --daemon /var/run/td-agent/td-agent.pid --u>
Sep 18 22:09:38 centos8.kifarunix-demo.com systemd[1]: Starting td-agent: Fluentd based data collector for Treasure Data...
Sep 18 22:09:40 centos8.kifarunix-demo.com systemd[1]: Started td-agent: Fluentd based data collector for Treasure Data.Installing Fluentd Elasticsearch Plugin
In this setup, we will use Elasticsearch as our search and analytics engine and hence, all the data collected by the Fluentd. As such, install Fluentd Elasticsearch plugin.
td-agent-gem install fluent-plugin-elasticsearchAlso, if you are gonna sent the logs to Fluentd via Internet, you need to install secure_forward Fluentd output plugin that sends data securely.
td-agent-gem install fluent-plugin-secure-forwardYou can see a whole list of Fluentd plugins on list of plugins by category page.
Configuring Fluentd Aggregator on CentOS 8
The default configuration file for Fluentd installed via the td-agent RPM, is /etc/td-agent/td-agent.conf. The configuration file consists of the following directives:
sourcedirectives determine the input sourcesmatchdirectives determine the output destinationsfilterdirectives determine the event processing pipelinessystemdirectives set system wide configurationlabeldirectives group the output and filter for internal routing@includedirectives include other files
Configure Fluentd Aggregator Input Plugins
First off, there are quite a number of input plugins which Fluentd aggregator can use to accept/receive data from the Fluentd forwarders.
In this setup, we are receiving logs via the Fluentd the forward input plugin. forward input plugin listens to a TCP socket to receive the event stream. It also listens to a UDP socket to receive heartbeat messages. The default port for Fluentd forward plugin is 24224.
Create a configuration backup;
cp /etc/td-agent/td-agent.conf{,.old}vim /etc/td-agent/td-agent.conf...
<source>
@type forward
port 24224
bind 192.168.60.6
</source>
...Be sure to open this port on firewall.
firewall-cmd --add-port=24224/{tcp,udp} --permanent
firewall-cmd --reloadConfigure Fluentd Aggregator Output Plugins
Configure Fluentd to sent data to Elasticsearch via the elasticsearch Fluentd output plugin.
vim /etc/td-agent/td-agent.conf####
## Output descriptions:
##
<match *.**>
@type elasticsearch
host 192.168.60.6
port 9200
logstash_format true
logstash_prefix fluentd
enable_ilm true
index_date_pattern "now/m{yyyy.mm}"
flush_interval 10s
</match>
####
## Source descriptions:
##
<source>
@type forward
port 24224
bind 192.168.60.6
</source>The match directive wildcard is explained on the File syntax page.
That is our modified Fluentd aggregator configuration file. You can adjust it to meet your requirements.
Restart Fluentd td-agent;
systemctl restart td-agentInstall Fluentd Forwarder on Remote Nodes
Now that the Kibana, Elasticsearch and Fluentd Aggregator is setup and ready to receive collected data from the remote end points, proceed to install the Fluentd forwarders to push the logs to the the Fluentd aggregator.
In this setup, we are using a remote CentOS 8 as the remote end point to collect logs from.
curl -L https://toolbelt.treasuredata.com/sh/install-redhat-td-agent4.sh | shUbuntu 20.04;
curl -L https://toolbelt.treasuredata.com/sh/install-ubuntu-focal-td-agent4.sh | shUbuntu 18.04
curl -L https://toolbelt.treasuredata.com/sh/install-ubuntu-bionic-td-agent4.sh | shFor more systems installation, refer to Fluentd installation page.
Configure Fluentd Forwarder to Ship Logs to Fluentd Aggregator
Similarly, make a copy of the configuration file.
cp /etc/td-agent/td-agent.conf{,.old}Configure Fluentd Forwarder Input and Output
In this setup, just as an example, we will collect the system authentication logs, /var/log/secure, from a remove CentOS 8 system.
vim /etc/td-agent/td-agent.confWe will use the tail input plugin to read the log files by tailing them. Therefore, our input configuration looks like;
<source>
  @type tail
  path /var/log/secure
  pos_file /var/log/td-agent/secure.pos
  tag ssh.auth
  <parse>
    @type syslog
  </parse>
</source>
Next, configure how logs are shipped to Fluentd aggregator. In this setup, we utilize the forward output plugin to sent the data to our log manager server running Elasticsearch, Kibana and Fluentd aggregator, listening on port 24224 TCP/UDP.
<match pattern>
  @type forward
  send_timeout 60s
  recover_wait 10s
  hard_timeout 60s

  <server>
    name log_mgr
    host 192.168.60.6
    port 24224
    weight 60
  </server>
</match>
In general, our Fluentd forwarder configuration looks like;
####
## Output descriptions:
##
<match *.**>
  @type forward
  send_timeout 60s
  recover_wait 10s
  hard_timeout 60s

  <server>
    name log_mgr
    host 192.168.60.6
    port 24224
    weight 60
  </server>
</match>
####
## Source descriptions:
##
<source>
  @type tail
  path /var/log/secure
  pos_file /var/log/td-agent/secure.pos
  tag ssh.auth
  <parse>
    @type syslog
  </parse>
</source>
Save and exit the configuration file.
Next, give Fluentd read access to the authentication logs file or any log file being collected. By default, only root can read the logs;
ls -alh /var/log/secure-rw-------. 1 root root 14K Sep 19 00:33 /var/log/secureTo ensure that Fluentd can read this log file, give the group and world read permissions;
chmod og+r /var/log/secureThe permissions should now look like;
ll /var/log/secure-rw-r--r--. 1 root root 13708 Sep 19 00:33 /var/log/secureNext, start and enable Fluentd Forwarder to run on system boot;
systemctl enable --now td-agentCheck the status;
systemctl status td-agent● td-agent.service - td-agent: Fluentd based data collector for Treasure Data
Loaded: loaded (/usr/lib/systemd/system/td-agent.service; enabled; vendor preset: disabled)
Active: active (running) since Sat 2020-09-19 01:23:40 EAT; 29s ago
Docs: https://docs.treasuredata.com/articles/td-agent
Process: 3163 ExecStart=/opt/td-agent/bin/fluentd --log $TD_AGENT_LOG_FILE --daemon /var/run/td-agent/td-agent.pid $TD_AGENT_OPTIONS (code=exited, status=0/SUCCESS)
Main PID: 3169 (fluentd)
Tasks: 8 (limit: 11476)
Memory: 71.0M
CGroup: /system.slice/td-agent.service
├─3169 /opt/td-agent/bin/ruby /opt/td-agent/bin/fluentd --log /var/log/td-agent/td-agent.log --daemon /var/run/td-agent/td-agent.pid
└─3172 /opt/td-agent/bin/ruby -Eascii-8bit:ascii-8bit /opt/td-agent/bin/fluentd --log /var/log/td-agent/td-agent.log --daemon /var/run/td-agent/td-agent.pid --u>
Sep 19 01:23:39 localrepo.kifarunix-demo.com systemd[1]: Starting td-agent: Fluentd based data collector for Treasure Data...
Sep 19 01:23:40 localrepo.kifarunix-demo.com systemd[1]: Started td-agent: Fluentd based data collector for Treasure Data.If you tail the Fluentd forwarder logs, you should see that it starts to read the log file;
tail -f /var/log/td-agent/td-agent.log </source>
</ROOT>
2020-09-19 01:23:40 +0300 [info]: starting fluentd-1.11.2 pid=3163 ruby="2.7.1"
2020-09-19 01:23:40 +0300 [info]: spawn command to main: cmdline=["/opt/td-agent/bin/ruby", "-Eascii-8bit:ascii-8bit", "/opt/td-agent/bin/fluentd", "--log", "/var/log/td-agent/td-agent.log", "--daemon", "/var/run/td-agent/td-agent.pid", "--under-supervisor"]
2020-09-19 01:23:41 +0300 [info]: adding match pattern="pattern" type="forward"
2020-09-19 01:23:41 +0300 [info]: #0 adding forwarding server 'log_mgr' host="192.168.60.6" port=24224 weight=60 plugin_id="object:71c"
2020-09-19 01:23:41 +0300 [info]: adding source type="tail"
2020-09-19 01:23:41 +0300 [info]: #0 starting fluentd worker pid=3172 ppid=3169 worker=0
2020-09-19 01:23:41 +0300 [info]: #0 following tail of /var/log/secure
2020-09-19 01:23:41 +0300 [info]: #0 fluentd worker is now running worker=0
...On the server running Elasticsearch, Kibana and Fluentd aggregator, you can check if any data is being received on the port 24224;
tcpdump -i enp0s8 -nn dst port 24224tcpdump: verbose output suppressed, use -v or -vv for full protocol decode
listening on enp0s8, link-type EN10MB (Ethernet), capture size 262144 bytes
01:28:37.183634 IP 192.168.60.5.39452 > 192.168.60.6.24224: Flags [S], seq 2062965426, win 29200, options [mss 1460,sackOK,TS val 3228636873 ecr 0,nop,wscale 7], length 0
01:28:37.184740 IP 192.168.60.5.39452 > 192.168.60.6.24224: Flags [.], ack 2675674893, win 229, options [nop,nop,TS val 3228636875 ecr 354613533], length 0
01:28:37.185145 IP 192.168.60.5.39452 > 192.168.60.6.24224: Flags [F.], seq 0, ack 1, win 229, options [nop,nop,TS val 3228636875 ecr 354613533], length 0
01:28:38.181546 IP 192.168.60.5.39454 > 192.168.60.6.24224: Flags [S], seq 1970844825, win 29200, options [mss 1460,sackOK,TS val 3228637794 ecr 0,nop,wscale 7], length 0
01:28:38.182649 IP 192.168.60.5.39454 > 192.168.60.6.24224: Flags [.], ack 2454001874, win 229, options [nop,nop,TS val 3228637796 ecr 354614454], length 0
...Check Available Indices on Elasticsearch
Perform failed and successful SSH authentication to your host running Fluentd forwarder. After that, check if your Elasticsearch index has been created. In this setup, we set our index prefix to fluentd, logstash_prefix fluentd.
curl -XGET http://192.168.60.6:9200/_cat/indices?vhealth status index uuid pri rep docs.count docs.deleted store.size pri.store.size
green open .apm-custom-link kuDD9tq0RAapIEtF4k79zw 1 0 0 0 208b 208b
green open .kibana-event-log-7.9.1-000001 gJ6tr6p5TCWmu1GhUNaD4A 1 0 9 0 48.4kb 48.4kb
green open .kibana_task_manager_1 T-dC9DFNTsy2uoYAJmvDtg 1 0 6 20 167.1kb 167.1kb
green open .apm-agent-configuration lNCadKowT3eIg_heAruB-w 1 0 0 0 208b 208b
yellow open fluentd-2020.09.19 nWU0KLe2Rv-T5eMD53kcoA 1 1 30 0 36.2kb 36.2kb
green open .async-search C1gXukCuQIe5grCFpLwxaQ 1 0 0 0 231b 231b
green open .kibana_1 Mw6PD83xT1KksRqAvO1BKg 1 0 22 5 10.4mb 10.4mbCreate Fluentd Kibana Index
Once you confirm that the data has been received on Elasticsearch and written to your index, navigate to Kibana web interface, http://server-IP-or-hostname:5601, and create the index.
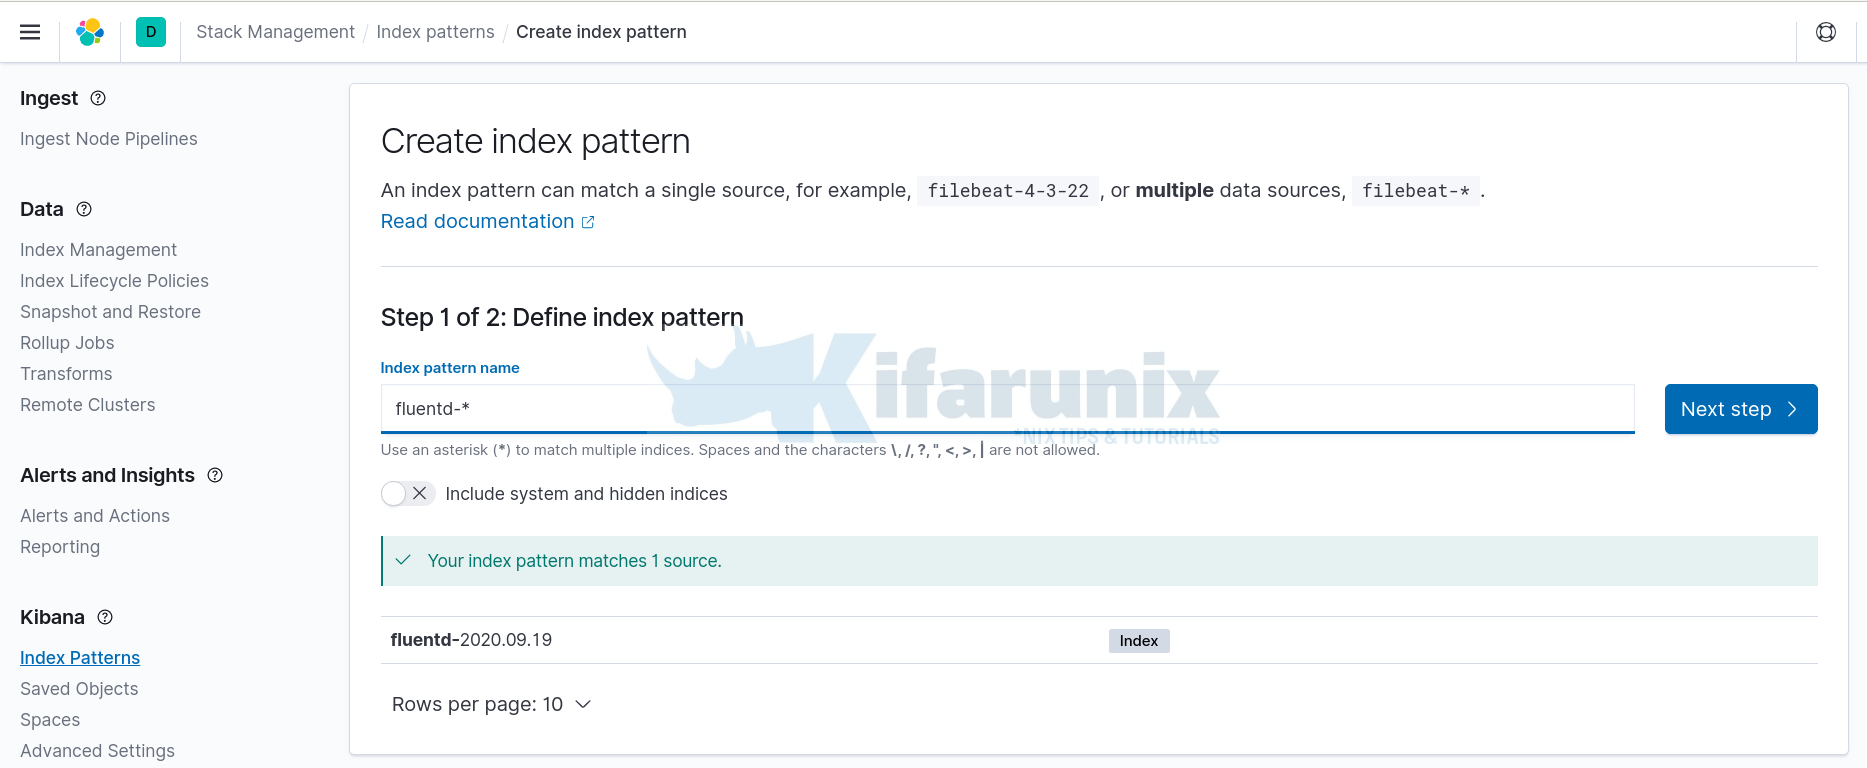
Click on Management tab (on the left side panel) > Kibana> Index Patterns > Create Index Pattern. Enter the wildcard for your index name.

In the next step, select timestamp as the time filter then click Create Index pattern to create your index pattern.
Viewing Fluentd Data on Kibana
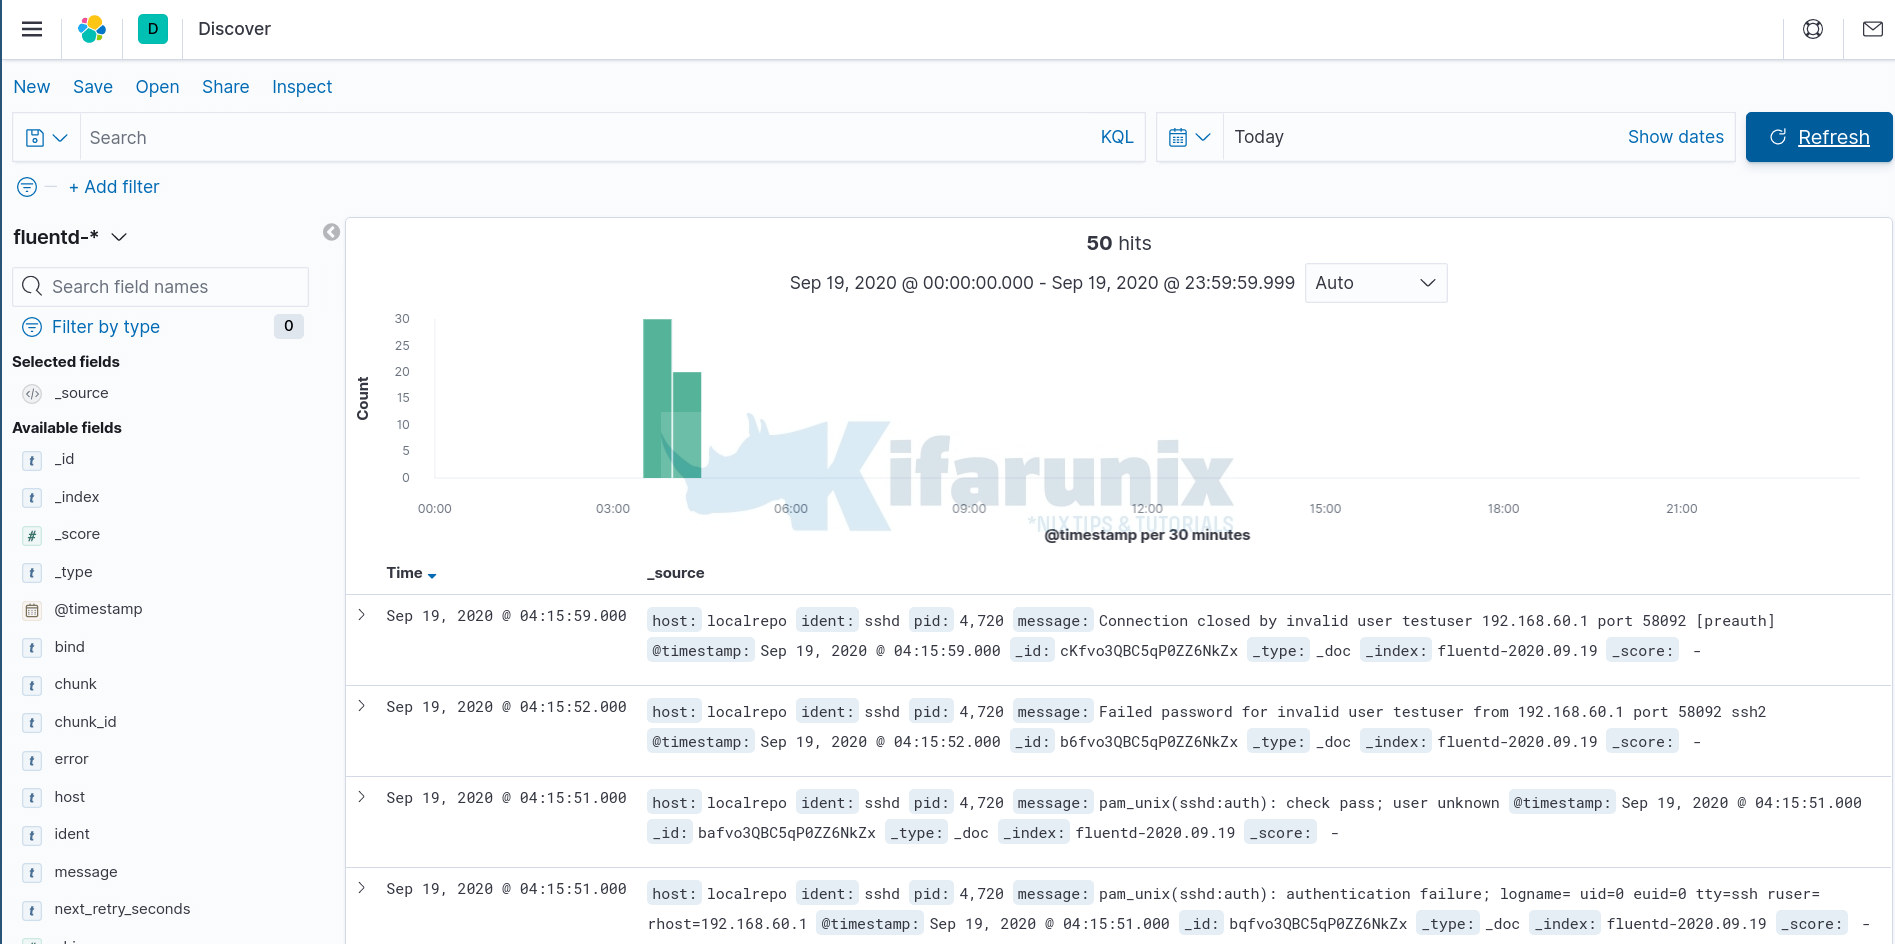
Once you have created Fluentd Kibana index, you can now view your event data on Kibana by clicking on the Discover tab on the left pane. Expand your time range accordingly.

Further Reading
Fluentd-Elasticsearch Plugin Reference
Related Tutorials
Installing ELK Stack on CentOS 8
Install Elastic Stack 7 on Fedora 30/Fedora 29/CentOS 7

