Welcome to our guide on how to install Prometheus on Rocky Linux 8. Prometheus is an open-source time series collection and processing monitoring system with a dimensional data model, flexible query language, efficient time series database and modern alerting approach.
Want to quickly get started wit Prometheus application and infrastructure monitoring? Check the link below;
Prometheus: Up & Running: Infrastructure and Application Performance Monitoring
Installing Prometheus on Rocky Linux 8
Step through this guide in order to install and configure Prometheus on Rocky Linux 8.
Create Prometheus System User and Group
Run the command below to create prometheus system user and group.
useradd -M -r -s /bin/false prometheusCreate Prometheus Configuration Directories
Since we are installing Prometheus from source, you need to create the respective configuration directories.
mkdir /etc/prometheusmkdir /var/lib/prometheusDownload Prometheus Tarball
In order to install the latest version of Prometheus, navigate to the Download’s Page and grab Prometheus binary for your platform.
You can simply run the command below to download the latest version as of this writing for Linux systems.
Replace the value of the VER variable below with the current version of Prometheus.
VER=2.28.1wget https://github.com/prometheus/prometheus/releases/download/v$VER/prometheus-$VER.linux-amd64.tar.gz -P /tmpExtract Prometheus Tarball
Once the download is done, extract the archive.
cd /tmptar -xzf prometheus-$VER.linux-amd64.tar.gzls prometheus-2.14.0.linux-amd64console_libraries consoles LICENSE NOTICE prometheus prometheus.yml promtool tsdbCopy the two Prometheus binary files, prometheus and promtool, under the extracted Prometheus archive directory to the /usr/local/bin directory.
cp prometheus-$VER.linux-amd64/{prometheus,promtool} /usr/local/bin/Copy the consoles/ and console_libraries/ directories to /etc/prometheus directory created above.
cp -r prometheus-$VER.linux-amd64/{consoles,console_libraries} /etc/prometheus/Configure Prometheus on Rocky Linux 8
The sample Prometheus configuration file, prometheus.yml, is located under the extracted archive directory.
Since we are doing a basic setup, we will copy the configuration file and modify it as follows such that it can scrape the local system only (Prometheus server).
cp prometheus-$VER.linux-amd64/prometheus.yml /etc/prometheus/Next, open the configuration file for modification and adjust it such that it looks like;
vim /etc/prometheus/prometheus.ymlThe default configuration is enough for demo purposes. Below is the content of the default Prometheus config file.
# my global config
global:
  scrape_interval:     15s # Set the scrape interval to every 15 seconds. Default is every 1 minute.
  evaluation_interval: 15s # Evaluate rules every 15 seconds. The default is every 1 minute.
  # scrape_timeout is set to the global default (10s).

# Alertmanager configuration
alerting:
  alertmanagers:
  - static_configs:
    - targets:
      # - alertmanager:9093

# Load rules once and periodically evaluate them according to the global 'evaluation_interval'.
rule_files:
  # - "first_rules.yml"
  # - "second_rules.yml"

# A scrape configuration containing exactly one endpoint to scrape:
# Here it's Prometheus itself.
scrape_configs:
  # The job name is added as a label `job=` to any timeseries scraped from this config.
  - job_name: 'prometheus'

    # metrics_path defaults to '/metrics'
    # scheme defaults to 'http'.

    static_configs:
    - targets: ['localhost:9090']
Save and exit the configuration file.
Allow Prometheus through firewall.
firewall-cmd --add-port=9090/tcp --permanentfirewall-cmd --reloadSet Proper Ownership on Configuration Files and Directories
Run the command below to set the ownership (owner and group) of Prometheus configuration files and directories to prometheus.
chown -R prometheus:prometheus /etc/prometheuschown -R prometheus:prometheus /var/lib/prometheuschown prometheus.prometheus /usr/local/bin/{prometheus,promtool}Starting Prometheus
To start Prometheus with our basic configuration file,run:
prometheus --config.file=/etc/prometheus/prometheus.yml...
level=info ts=2021-07-08T20:14:48.449Z caller=main.go:854 msg="TSDB started"
level=info ts=2021-07-08T20:14:48.449Z caller=main.go:981 msg="Loading configuration file" filename=/etc/prometheus/prometheus.yml
level=info ts=2021-07-08T20:14:48.451Z caller=main.go:1012 msg="Completed loading of configuration file" filename=/etc/prometheus/prometheus.yml totalDuration=1.389669ms remote_storage=1.749µs web_handler=236ns query_engine=591ns scrape=1.093751ms scrape_sd=26.279µs notify=23.549µs notify_sd=17.882µs rules=1.004µs
level=info ts=2021-07-08T20:14:48.451Z caller=main.go:796 msg="Server is ready to receive web requests."Accessing Prometheus Web Interface
You should able to access the Prometheus status page at http://localhost:9090 if you are accessing the server locally or http://<server-IP>:9090 if you are accessing remotely.

Create Prometheus Systemd Service file
To be able to run Prometheus as a service, you need to create a systemd service file, /etc/systemd/system/prometheus.service, configured as follows.
Note that this assumes Prometheus server is listening on default port 9090.
cat > /etc/systemd/system/prometheus.service << 'EOL'
[Unit]
Description=Prometheus Time Series Collection and Processing Server
Wants=network-online.target
After=network-online.target

[Service]
User=prometheus
Group=prometheus
Type=simple
ExecStart=/usr/local/bin/prometheus \
    --config.file /etc/prometheus/prometheus.yml \
    --storage.tsdb.path /var/lib/prometheus/ \
    --web.console.templates=/etc/prometheus/consoles \
    --web.console.libraries=/etc/prometheus/console_libraries

[Install]
WantedBy=multi-user.target
EOL
Reload systemd daemon configuration.
systemctl daemon-reloadStart and Enable Prometheus service to run at boot time.
systemctl enable --now prometheusCheck the status
systemctl status prometheus● prometheus.service - Prometheus Time Series Collection and Processing Server
Loaded: loaded (/etc/systemd/system/prometheus.service; disabled; vendor preset: disabled)
Active: active (running) since Thu 2021-07-08 23:19:51 EAT; 7s ago
Main PID: 8209 (prometheus)
Tasks: 6 (limit: 4938)
Memory: 18.3M
CGroup: /system.slice/prometheus.service
└─8209 /usr/local/bin/prometheus --config.file /etc/prometheus/prometheus.yml --storage.tsdb.path /var/lib/prometheus/ --web.console.templates=/etc/prometheus/c>
Jul 08 23:19:51 localhost.localdomain prometheus[8209]: level=info ts=2021-07-08T20:19:51.676Z caller=head.go:794 component=tsdb msg="On-disk memory mappable chunks replay>
Jul 08 23:19:51 localhost.localdomain prometheus[8209]: level=info ts=2021-07-08T20:19:51.676Z caller=head.go:800 component=tsdb msg="Replaying WAL, this may take a while"
Jul 08 23:19:51 localhost.localdomain prometheus[8209]: level=info ts=2021-07-08T20:19:51.678Z caller=tls_config.go:191 component=web msg="TLS is disabled." http2=false
Jul 08 23:19:51 localhost.localdomain prometheus[8209]: level=info ts=2021-07-08T20:19:51.678Z caller=head.go:854 component=tsdb msg="WAL segment loaded" segment=0 maxSegm>
Jul 08 23:19:51 localhost.localdomain prometheus[8209]: level=info ts=2021-07-08T20:19:51.678Z caller=head.go:860 component=tsdb msg="WAL replay completed" checkpoint_repl>
Jul 08 23:19:51 localhost.localdomain prometheus[8209]: level=info ts=2021-07-08T20:19:51.679Z caller=main.go:851 fs_type=XFS_SUPER_MAGIC
Jul 08 23:19:51 localhost.localdomain prometheus[8209]: level=info ts=2021-07-08T20:19:51.679Z caller=main.go:854 msg="TSDB started"
Jul 08 23:19:51 localhost.localdomain prometheus[8209]: level=info ts=2021-07-08T20:19:51.679Z caller=main.go:981 msg="Loading configuration file" filename=/etc/prometheus>
Jul 08 23:19:51 localhost.localdomain prometheus[8209]: level=info ts=2021-07-08T20:19:51.681Z caller=main.go:1012 msg="Completed loading of configuration file" filename=/>
Jul 08 23:19:51 localhost.localdomain prometheus[8209]: level=info ts=2021-07-08T20:19:51.681Z caller=main.go:796 msg="Server is ready to receive web requests."
Check that prometheus is listening on TCP port 9090.
ss -altnp | grep 9090LISTEN 0 128 *:9090 *:* users:(("prometheus",pid=8209,fd=7))Great, Prometheus is now running as a service.
You can now check the status of the connected targets. Click Status dropdown and then Targets. At the moment, we only have Prometheus scraping the localhost on which it is running.

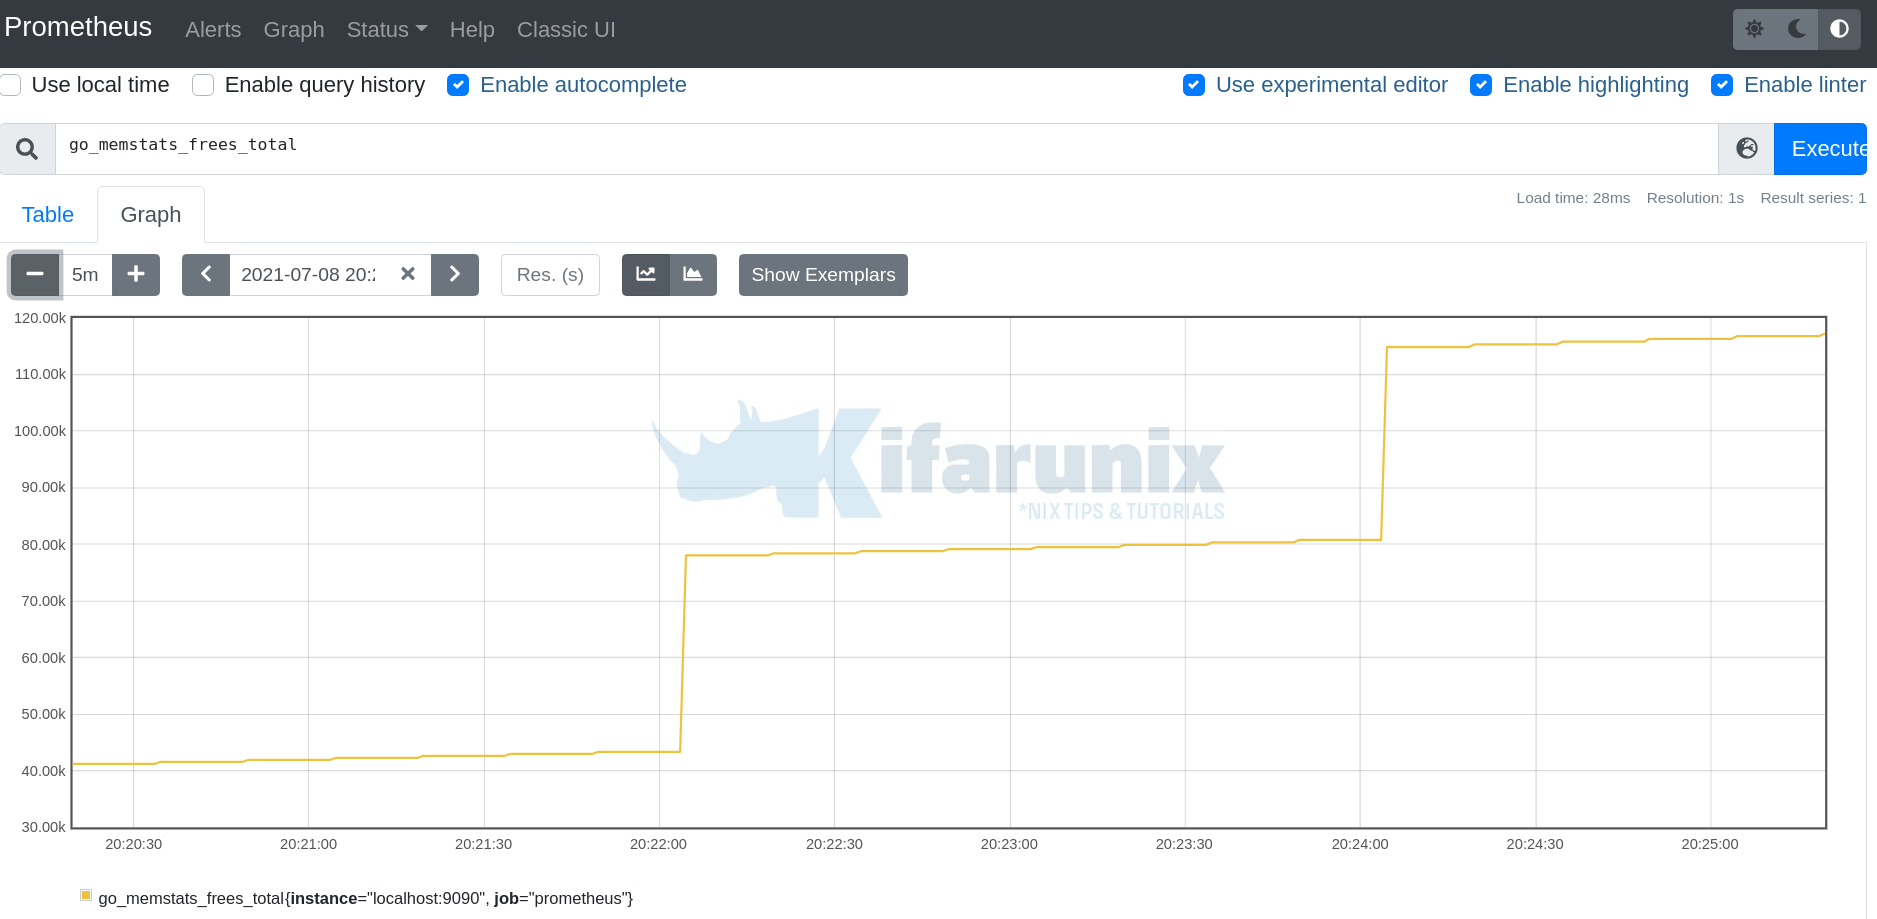
You can also check local system metrics for example to check memory statistics for example “go_memstats_frees_total“.

For graphical overview, click Graph.

So far so good, you have learnt how to install and configure Prometheus on Rocky Linux 8.
Feel free to explore more about Prometheus here.
Other tutorials
Configure Prometheus Email Alerting with AlertManager
Monitor SSL/TLS Certificate Expiry with Prometheus and Grafana

