Is it possible to monitor Docker Swarm and container metrics using Metricbeat? Yes, of course! Metricbeat provides a flexible and powerful way to monitor Docker environment, be it individual containers or Swarm services. It can collect metrics about Docker containers such as container CPU usage, memory usage, network statistics… and Swarm metrics such as the number of replicas, service health… The metrics are collected and pushed to Elasticsearch stack for parsing and processing and they can be visualized on Kibana interface.
Table of Contents
Monitoring Docker Swarm and Container Metrics using Metricbeat
In this guide, we will use Metricbeat to monitor Docker swarm and container metrics.
Install and Setup ELK Stack
You can deploy your ELK stack as Docker container or just run it on the host as usual.
In this tutorial, we are running ELK stack on a different host, not as Docker containers though.
See the links below on how to install and setup ELK;
How to Install ELK Stack on Linux
Setup Docker Swarm Cluster
Since we are dealing swarm services, you need to have setup swarm cluster that whose metrics need to be monitored.
If you haven’t, please refer to this guide to learn how to setup swarm cluster.
How to Setup Docker Swarm Cluster on Ubuntu
Deploy Metricbeat on each Swarm Node
In order to collect metrics from each node in the swarm cluster, we will deploy Metricbeat on each node.
Install Metricbeat on Linux Systems
Since we are running our Docker swarm cluster on Linux systems, let’s deploy Metricbeat on each node of the swarm cluster.
In order to install Metricbeat on Linux systems, you can follow this guide below;
Note, you need to install a version that is exactly same or a bit lower than the version of your ELK stack. We use version 8.7.0, which is the current new stable release as of this writing, in this guide.
Install Metricbeat in Linux Systems
Configure Metricbeat
By default, this is how this configuration looks like;
cat /etc/metricbeat/metricbeat.yml
###################### Metricbeat Configuration Example #######################

# This file is an example configuration file highlighting only the most common
# options. The metricbeat.reference.yml file from the same directory contains all the
# supported options with more comments. You can use it as a reference.
#
# You can find the full configuration reference here:
# https://www.elastic.co/guide/en/beats/metricbeat/index.html

# =========================== Modules configuration ============================

metricbeat.config.modules:
  # Glob pattern for configuration loading
  path: ${path.config}/modules.d/*.yml

  # Set to true to enable config reloading
  reload.enabled: false

  # Period on which files under path should be checked for changes
  #reload.period: 10s

# ======================= Elasticsearch template setting =======================

setup.template.settings:
  index.number_of_shards: 1
  index.codec: best_compression
  #_source.enabled: false


# ================================== General ===================================

# The name of the shipper that publishes the network data. It can be used to group
# all the transactions sent by a single shipper in the web interface.
#name:

# The tags of the shipper are included in their own field with each
# transaction published.
#tags: ["service-X", "web-tier"]

# Optional fields that you can specify to add additional information to the
# output.
#fields:
#  env: staging

# ================================= Dashboards =================================
# These settings control loading the sample dashboards to the Kibana index. Loading
# the dashboards is disabled by default and can be enabled either by setting the
# options here or by using the `setup` command.
#setup.dashboards.enabled: false

# The URL from where to download the dashboards archive. By default this URL
# has a value which is computed based on the Beat name and version. For released
# versions, this URL points to the dashboard archive on the artifacts.elastic.co
# website.
#setup.dashboards.url:

# =================================== Kibana ===================================

# Starting with Beats version 6.0.0, the dashboards are loaded via the Kibana API.
# This requires a Kibana endpoint configuration.
setup.kibana:

  # Kibana Host
  # Scheme and port can be left out and will be set to the default (http and 5601)
  # In case you specify and additional path, the scheme is required: http://localhost:5601/path
  # IPv6 addresses should always be defined as: https://[2001:db8::1]:5601
  #host: "localhost:5601"

  # Kibana Space ID
  # ID of the Kibana Space into which the dashboards should be loaded. By default,
  # the Default Space will be used.
  #space.id:

# =============================== Elastic Cloud ================================

# These settings simplify using Metricbeat with the Elastic Cloud (https://cloud.elastic.co/).

# The cloud.id setting overwrites the `output.elasticsearch.hosts` and
# `setup.kibana.host` options.
# You can find the `cloud.id` in the Elastic Cloud web UI.
#cloud.id:

# The cloud.auth setting overwrites the `output.elasticsearch.username` and
# `output.elasticsearch.password` settings. The format is `:`.
#cloud.auth:

# ================================== Outputs ===================================

# Configure what output to use when sending the data collected by the beat.

# ---------------------------- Elasticsearch Output ----------------------------
output.elasticsearch:
  # Array of hosts to connect to.
  hosts: ["localhost:9200"]

  # Protocol - either `http` (default) or `https`.
  #protocol: "https"

  # Authentication credentials - either API key or username/password.
  #api_key: "id:api_key"
  #username: "elastic"
  #password: "changeme"

# ------------------------------ Logstash Output -------------------------------
#output.logstash:
  # The Logstash hosts
  #hosts: ["localhost:5044"]

  # Optional SSL. By default is off.
  # List of root certificates for HTTPS server verifications
  #ssl.certificate_authorities: ["/etc/pki/root/ca.pem"]

  # Certificate for SSL client authentication
  #ssl.certificate: "/etc/pki/client/cert.pem"

  # Client Certificate Key
  #ssl.key: "/etc/pki/client/cert.key"

# ================================= Processors =================================

# Configure processors to enhance or manipulate events generated by the beat.

processors:
  - add_host_metadata: ~
  - add_cloud_metadata: ~
  - add_docker_metadata: ~
  - add_kubernetes_metadata: ~


# ================================== Logging ===================================

# Sets log level. The default log level is info.
# Available log levels are: error, warning, info, debug
#logging.level: debug

# At debug level, you can selectively enable logging only for some components.
# To enable all selectors use ["*"]. Examples of other selectors are "beat",
# "publisher", "service".
#logging.selectors: ["*"]

# ============================= X-Pack Monitoring ==============================
# Metricbeat can export internal metrics to a central Elasticsearch monitoring
# cluster.  This requires xpack monitoring to be enabled in Elasticsearch.  The
# reporting is disabled by default.

# Set to true to enable the monitoring reporter.
#monitoring.enabled: false

# Sets the UUID of the Elasticsearch cluster under which monitoring data for this
# Metricbeat instance will appear in the Stack Monitoring UI. If output.elasticsearch
# is enabled, the UUID is derived from the Elasticsearch cluster referenced by output.elasticsearch.
#monitoring.cluster_uuid:

# Uncomment to send the metrics to Elasticsearch. Most settings from the
# Elasticsearch output are accepted here as well.
# Note that the settings should point to your Elasticsearch *monitoring* cluster.
# Any setting that is not set is automatically inherited from the Elasticsearch
# output configuration, so if you have the Elasticsearch output configured such
# that it is pointing to your Elasticsearch monitoring cluster, you can simply
# uncomment the following line.
#monitoring.elasticsearch:

# ============================== Instrumentation ===============================

# Instrumentation support for the metricbeat.
#instrumentation:
    # Set to true to enable instrumentation of metricbeat.
    #enabled: false

    # Environment in which metricbeat is running on (eg: staging, production, etc.)
    #environment: ""

    # APM Server hosts to report instrumentation results to.
    #hosts:
    #  - http://localhost:8200

    # API Key for the APM Server(s).
    # If api_key is set then secret_token will be ignored.
    #api_key:

    # Secret token for the APM Server(s).
    #secret_token:


# ================================= Migration ==================================

# This allows to enable 6.7 migration aliases
#migration.6_to_7.enabled: true
So, we have updated our config to simply look like;
cat /etc/metricbeat/metricbeat.yml
metricbeat.config.modules:
  path: ${path.config}/modules.d/*.yml
  reload.enabled: false
setup.template.settings:
  index.number_of_shards: 1
  index.codec: best_compression
output.elasticsearch:
  hosts: ["node03.kifarunix-demo.com:9200"]
  protocol: "https"
  ssl.certificate_authorities: ["/etc/metricbeat/ca.crt"]
  username: "${ES_USER}"
  password: "${ES_PASSWORD}"
processors:
  - add_host_metadata: ~
  - add_docker_metadata: ~
logging.level: info
- The
metricbeat.config.modulesspecifies how Metricbeat should load and reload module configurations.${path.config}/modules.d/*.ymlspecifies the path to the directory containing module configuration files-
reload.enabled: falsespecifies whether Metricbeat should reload module configurations as they change.
setup.template.settings: allows you to customize the index template settings that Metricbeat uses when creating indices in Elasticsearch.- the
index.number_of_shardssetting is set to1, which means that each index will have only one primary shard - the
index.codecsetting is set tobest_compression, which means that Elasticsearch will use the best compression algorithm available for the index.
- the
output.elasticsearch: configures the Elasticsearch output for Metricbeat.- The
hostssetting specifies the Elasticsearch instance to send the data to, - The
protocolsetting specifies the protocol to use (in this case, HTTPS) - The
ssl.certificate_authoritiessetting specifies the path to the CA certificate used to verify the Elasticsearch server’s SSL/TLS certificate. - The
usernameandpasswordsettings specify the credentials to use for authentication. The values of the variables used are stored in the Metricbeat keystore, to be created later below.
- The
setup.ilm.enable: trueEnables or disables index lifecycle management on any new indices created by Metricbeat.setup.ilm.rollover_alias: "metricbeat": This specifies the alias that is used for the ILM rollover process.setup.ilm.pattern: "{now/d}-000001": This sets the name pattern for the index to something likemetricbeat-2023.04.14-000001.processors: This section defines the processors to apply to each event before sending it to Elasticsearch. In this example;- the
add_host_metadataprocessor adds metadata about the host where the event was generated, - the
add_docker_metadataprocessor adds metadata about the Docker container running on the host, if applicable.
- the
logging.level: This setting controls the logging level for Metricbeat.- the logging level is set to
info, which means that Metricbeat will log information and above (i.e., warnings and errors).
- the logging level is set to
Create Metricbeat Keystore and Add Elasticsearch Connection Username/Password
If you want, you can leave the username and password in plain-text. Otherwise, create a keystore and store the username and password using variables as defined in our config above.
metricbeat keystore createmetricbeat keystore add ES_USEREnter the username that has rights to create and write to index to be used with Metricbeat.
metricbeat keystore add ES_PASSWORDEnter the password for the above user.
Enable Metricbeat Docker/System Module
Enable Metricbeat System Module
System module, that enables you to monitor host server metrics such as cpu, load, memory, network, process, process_summary, socket_summary, filesystem, fsstat, and uptime is enabled by default.
Confirm by checking that under the modules directory, the system.yml has no .disabled suffix. You can also list the modules.
metricbeat modules listWe will configure the default system module as follows;
vim /etc/metricbeat/modules.d/system.yml
- module: system
  period: 10s
  metricsets:
    - cpu
    - load
    - memory
    - network
    - process
    - process_summary
    - socket_summary
    - service
    - users
  process.include_top_n:
    by_cpu: 5
    by_memory: 5
- module: system
  period: 1m
  metricsets:
    - filesystem
    - fsstat
  processors:
  - drop_event.when.regexp:
      system.filesystem.mount_point: '^/(sys|cgroup|proc|dev|etc|host|lib|snap)($|/)'
- module: system
  period: 15m
  metricsets:
    - uptime
Enable Metricbeat Docker Module
Enable and configure Docker module;
metricbeat modules enable dockerHere is our configuration;
vim /etc/metricbeat/modules.d/docker.yml
- module: docker
  metricsets:
    - container
    - cpu
    - diskio
    - event
    - healthcheck
    - info
    - memory
    - network
    - network_summary
  period: 5s
  hosts: ["unix:///var/run/docker.sock"]

  labels.dedot: false
  processors:
    - add_docker_metadata: ~
hosts parameter enables the module to connect to Docker daemon socket to collect Docker related metrics defined on the metricsset above.
Test Metricbeat Configuration, Modules and Output
Run the commands below to test Metricbeat configuration, module settings and to check if Metricbeat can connect to the output defined with the current settings, respectively;
metricbeat test configmetricbeat test modulesmetricbeat test outputIf there is any issue, please fix it before you can proceed.
Load Kibana Metricbeat Dashboards
Each and every module comes with predefined dashboards, visualizations, and searches for visualizing Metricbeat data in Kibana.
To utilize these dashboards on Kibana, you need to load them onto Kibana, as shown below.
Before you can proceed, ensure that Kibana is running and reachable.
nc -vz node01.kifarunix-demo.com 5601Connection to node01.kifarunix-demo.com (192.168.58.22) 5601 port [tcp/*] succeeded!Note, we are using Elasticsearch as output hence;
metricbeat setup --dashboards \
-E 'setup.kibana.host=node01.kifarunix-demo.com:5601' \
-E 'setup.dashboards.enabled=true'
If you have configured Metricbeat to write to a custom index pattern apart from the default, metricbeat-*, the you can specify custom one using the setup.dashboards.index. This setting overwrites the index name defined in the dashboards and index pattern.
metricbeat setup --dashboards \
-E 'setup.kibana.host=node01.kifarunix-demo.com:5601' \
-E 'setup.dashboards.enabled=true' \
-E 'setup.dashboards.index=custom-*'
The metricbeat setup --dashboards command does initial setup of the environment:
- Index mapping template in Elasticsearch to ensure fields are mapped.
- Kibana dashboards (where available).
- Ingest pipelines (where available).
- ILM policy (for Elasticsearch 6.5 and newer).
When you see, Loaded dashboards, you are good to go.
You can confirm from Kibana if there Kibana index patterns/data view (Management/Kibana/Data Views) for Metricbeat is created already.
Check dashboards from the Dashboards.
Running Metricbeat
To begin with, let’s run Metricbeat in foreground;
metricbeat -eIf all is good, you should see a line like;
Connection to backoff(elasticsearch(ES_ADDRESS:9200)) establishedYou can cancel foreground and start and enable Metricbeat to run on system boot;
systemctl enable --now metricbeatOn the rest of the nodes on the cluster, install and configure Metricbeat as done above. You dont need to load dashboards again, once you have loaded on one node.
Viewing Metricbeat Data
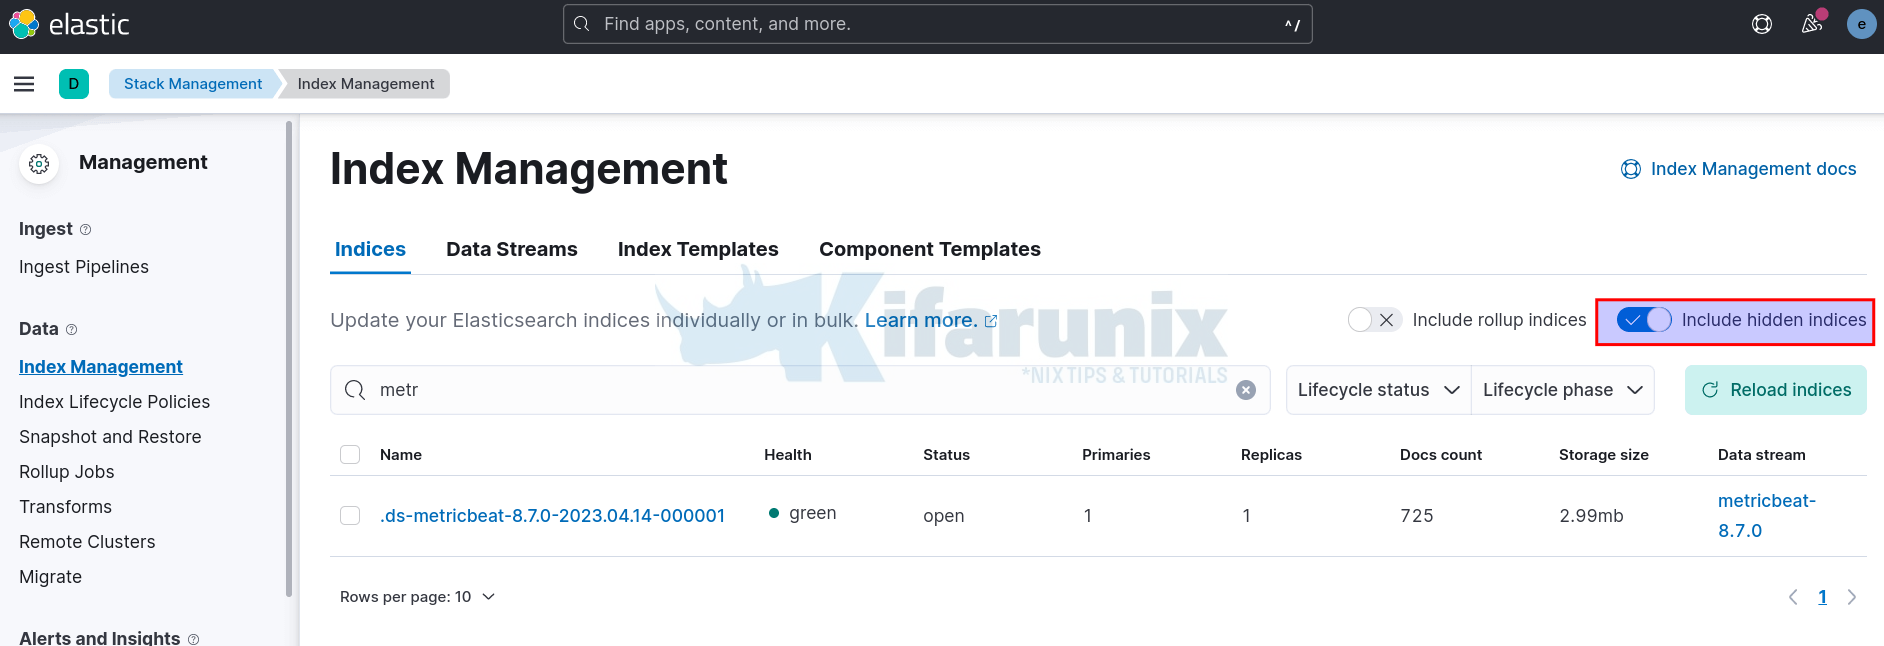
Metricbeat Index is hidden, click show hidden indices to see it;
The Kibana data view is automatically created when you load dashboards.
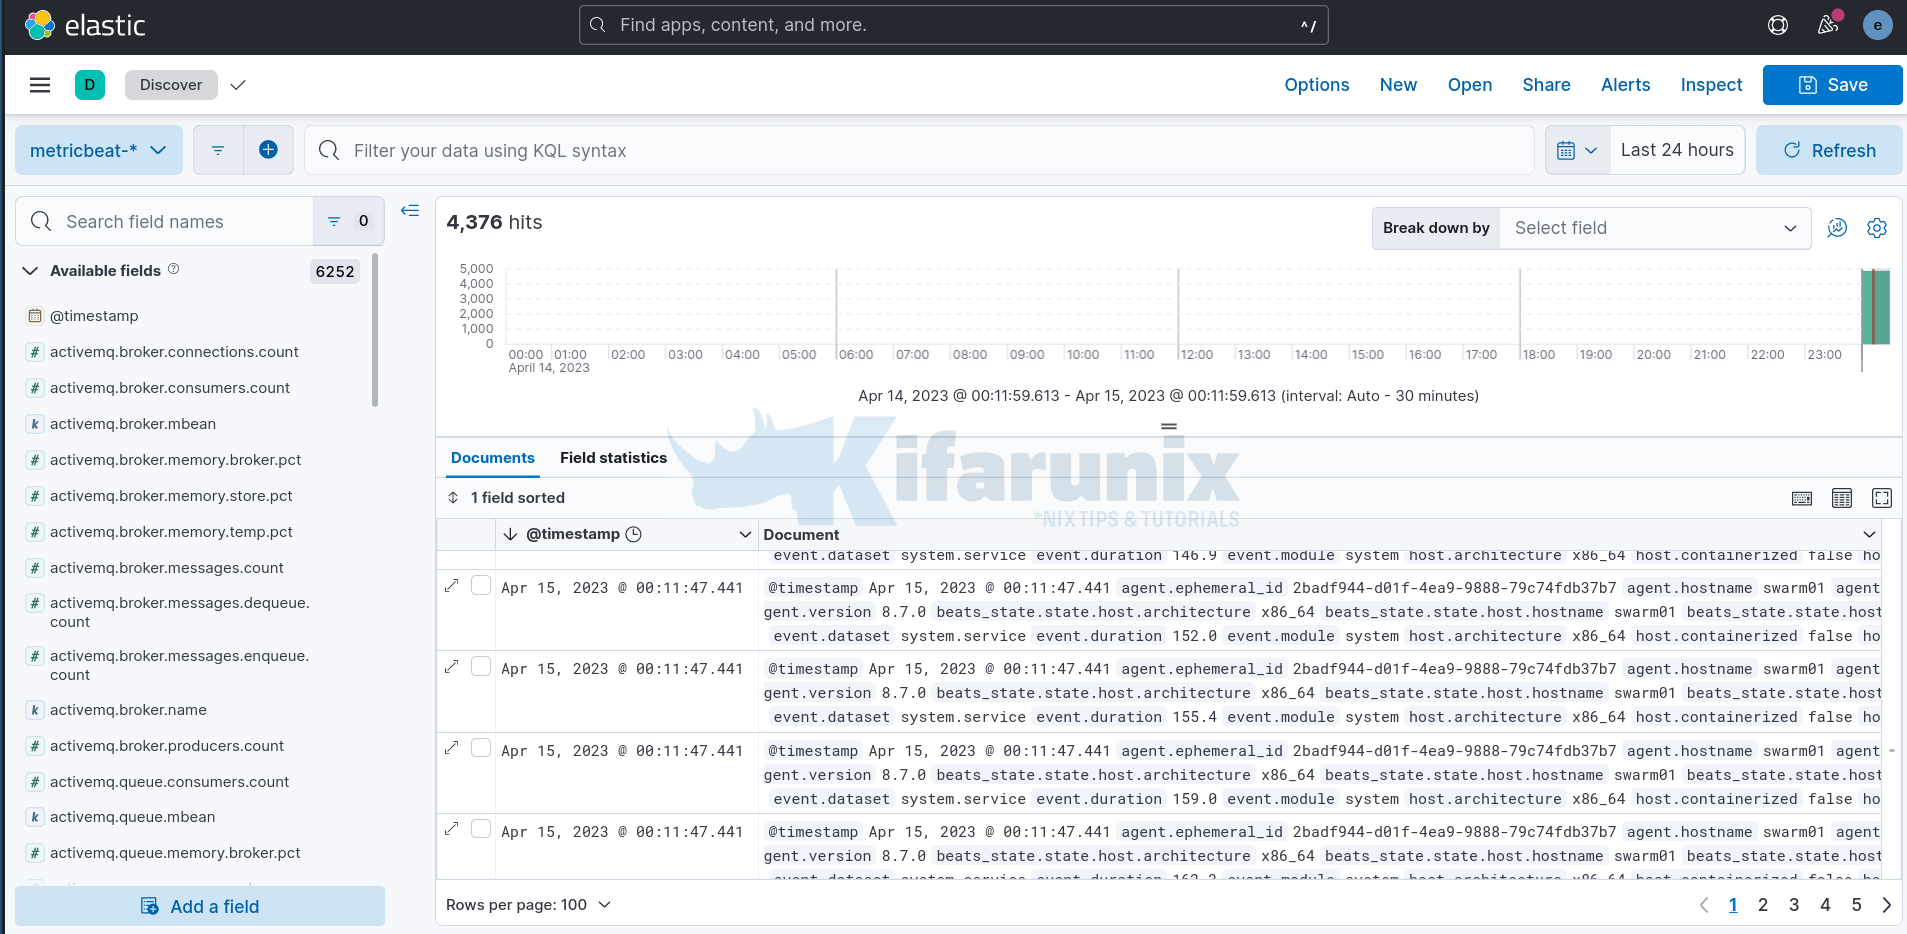
To see raw metrics data, navigate to Kibana Discover menu and select respective pattern;
Metricbeat Dashboards
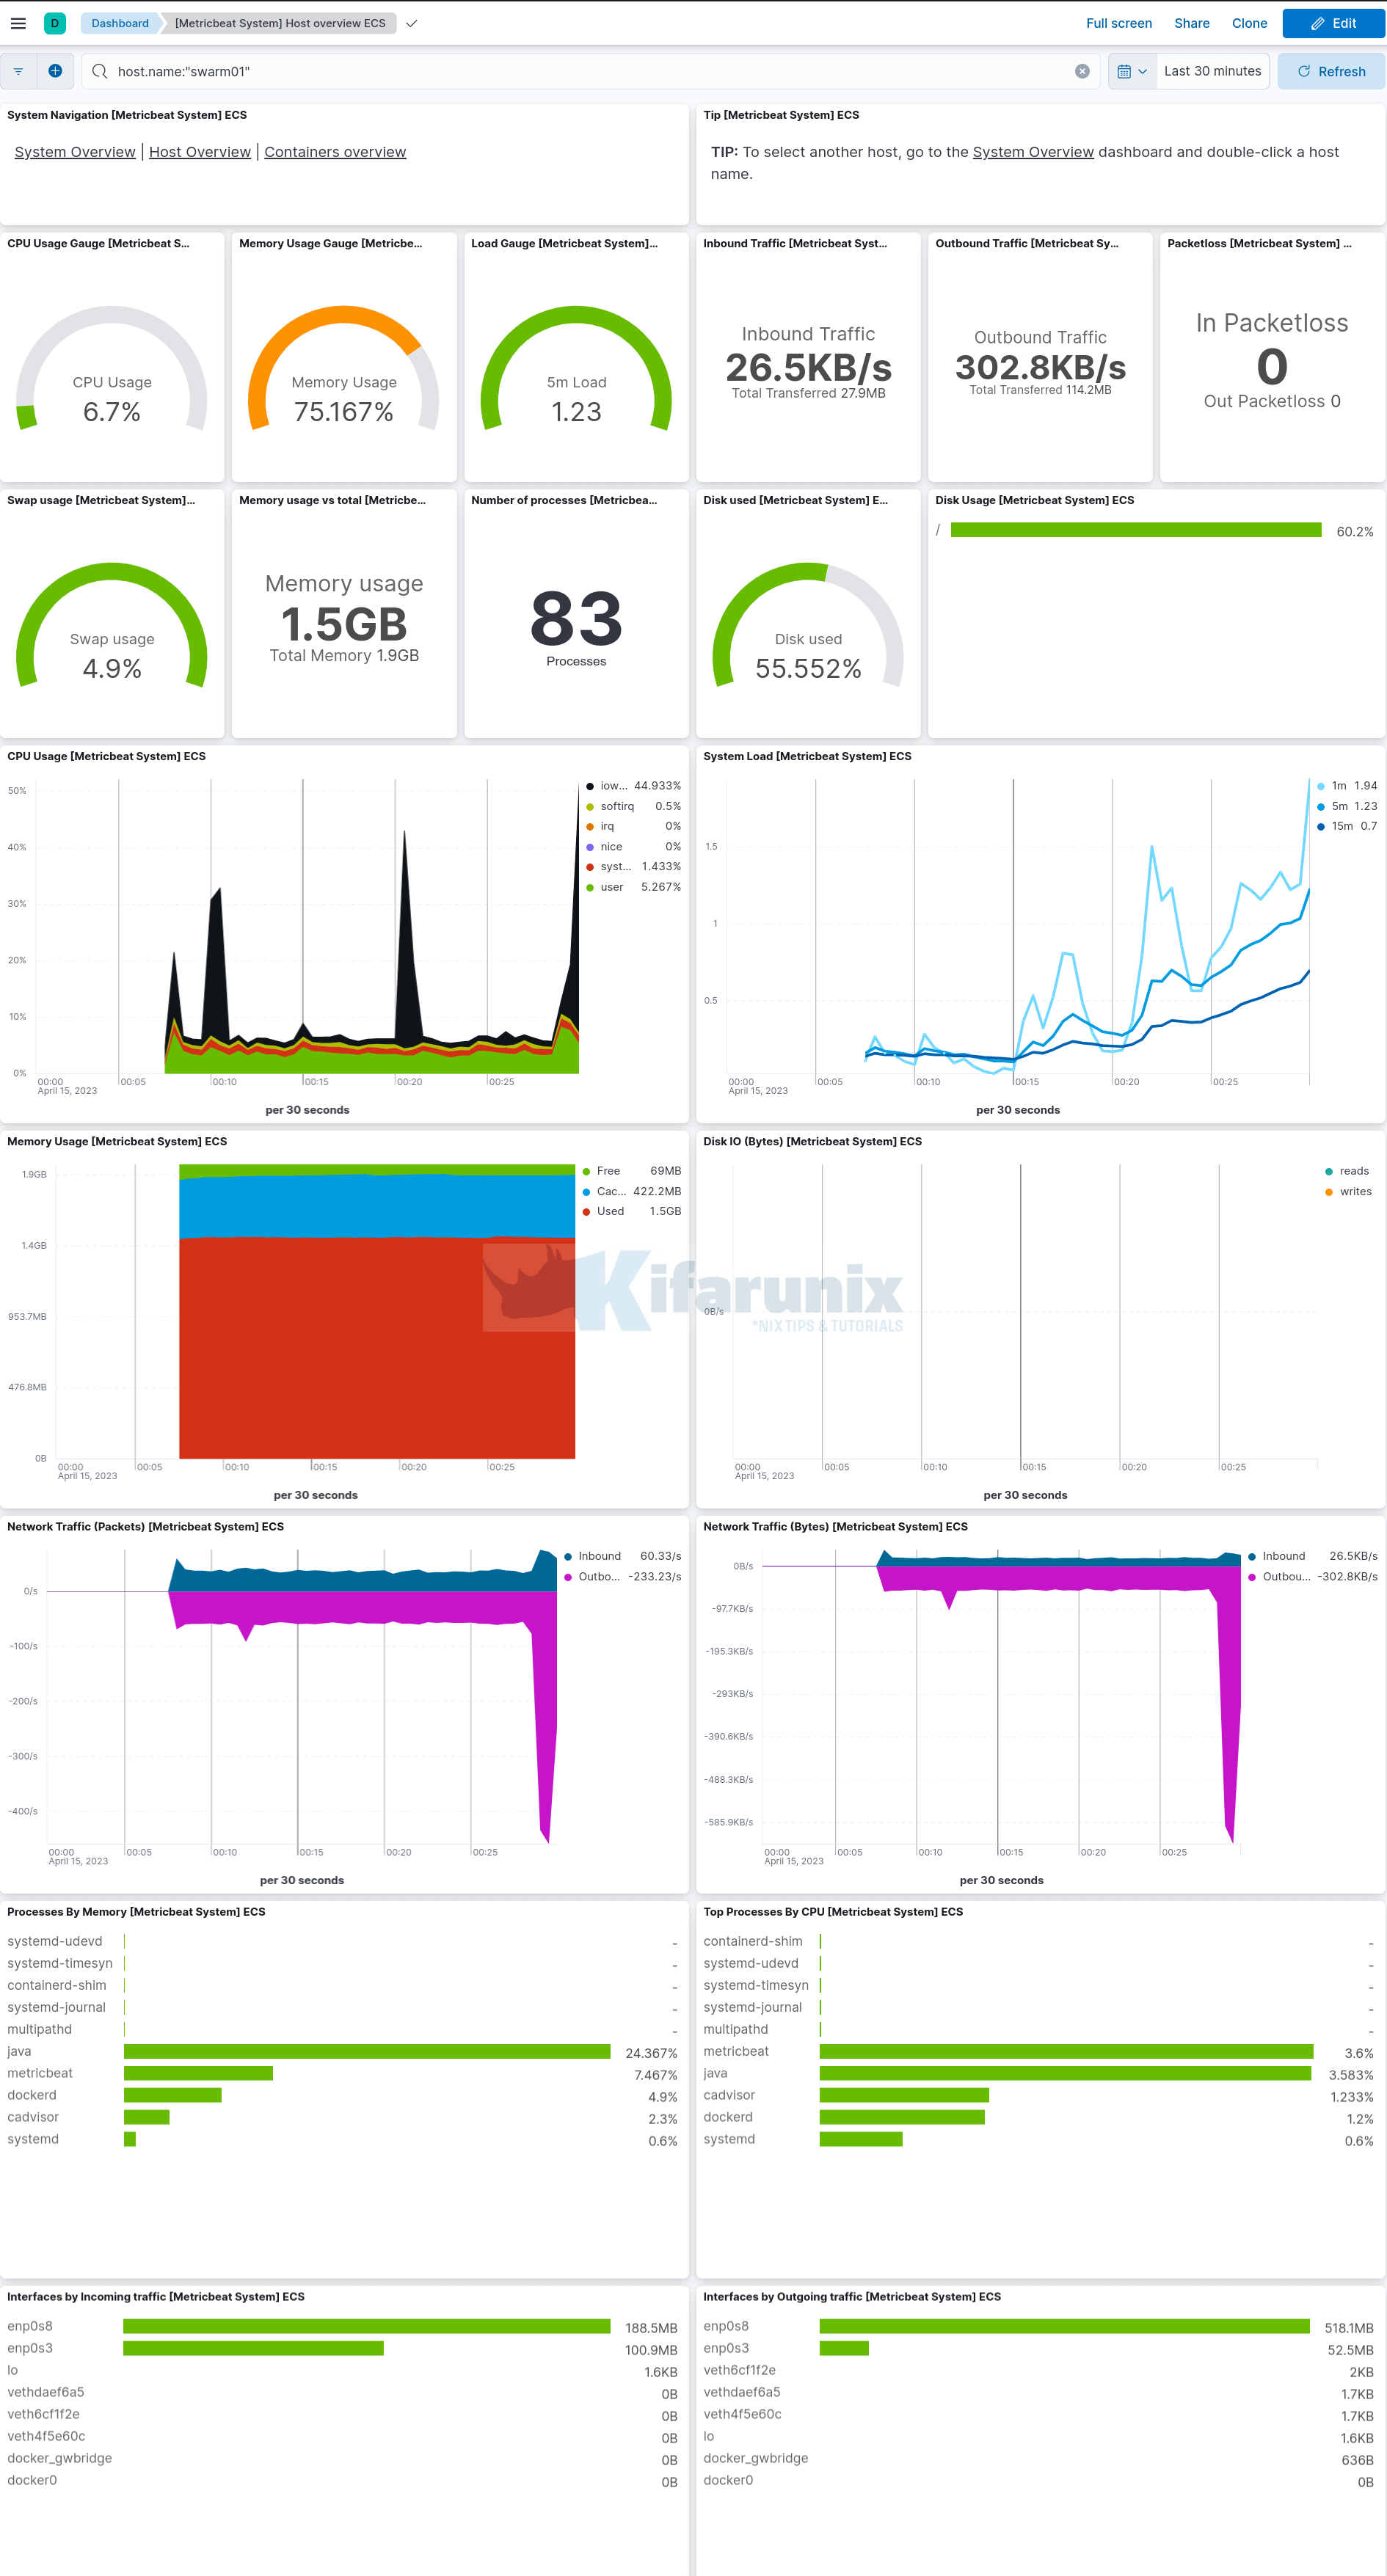
Metric System Dashboards sample;
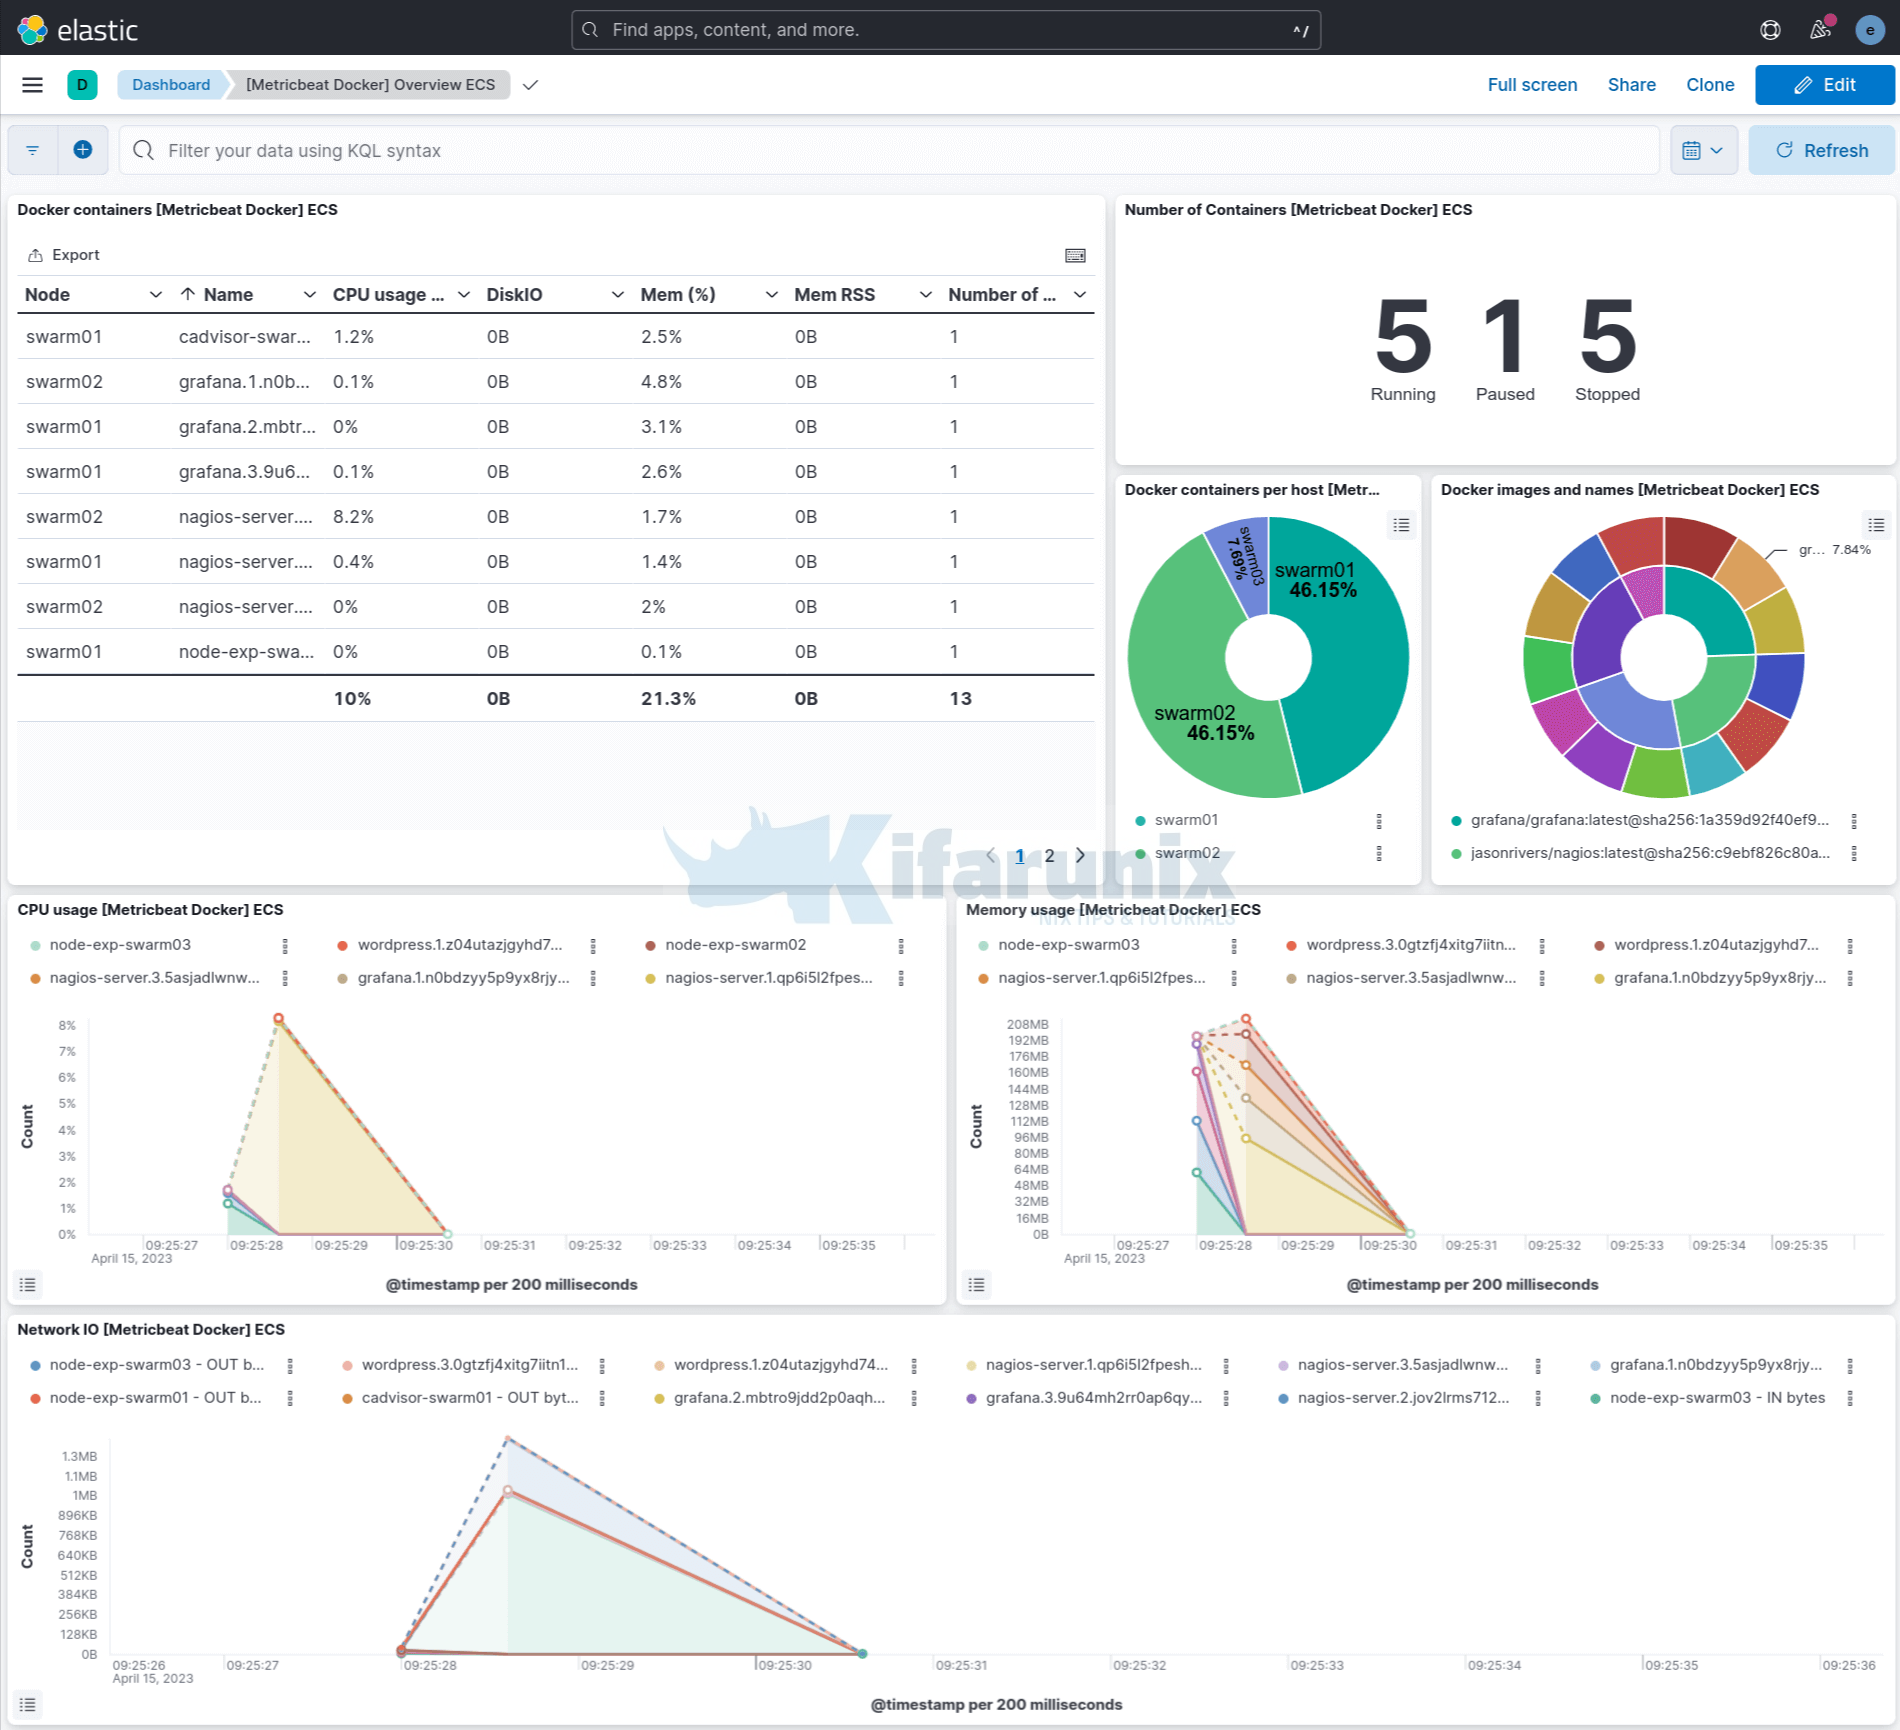
Docker overview metrics. You can filter by the agent name, e.g agent.name: "node-name" to display information about Docker containers running on each swarm node.
And that is it. You can create your own custom dashboards to suite you requirements.
That marks the end of our tutorial on how to monitoring Docker Swarm and container metrics using Metricbeat.


