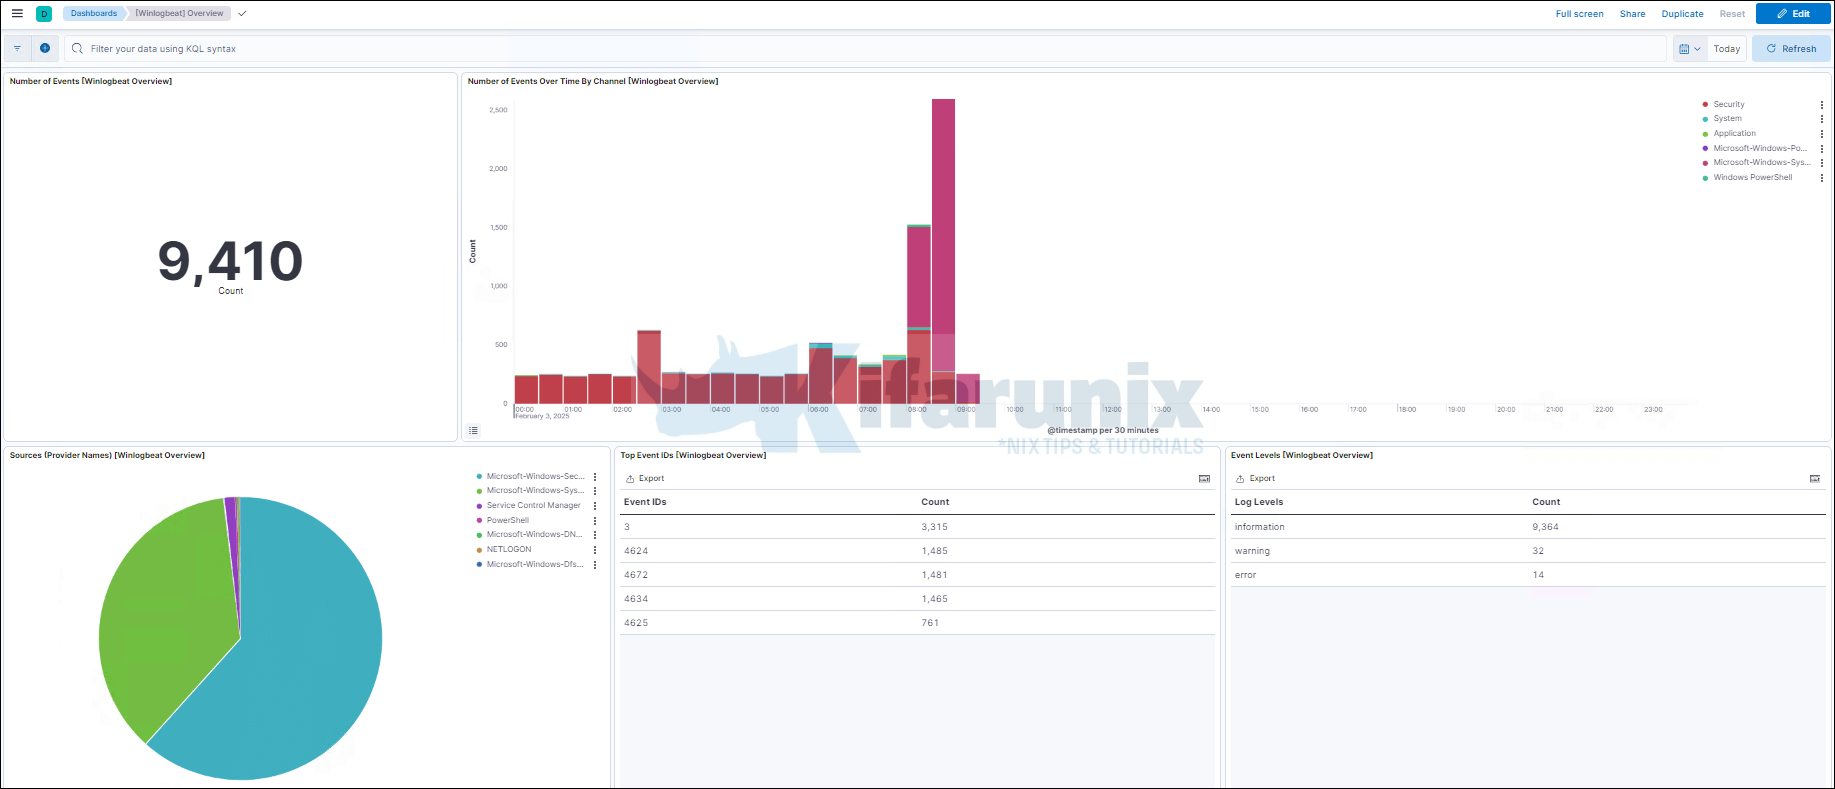
In this guide, we are going to learn how to send Windows logs to Elastic Stack using Winlogbeat and Sysmon. Winlogbeat is an Elastic Beat that is used to collect windows system application, security, system or hardware events. Sysmon (System Monitor) on the other hand is a windows application that is used to monitor and log system activity to the Windows event log. It provides detailed information about process creations, network connections, and changes to file creation time
Table of Contents
Send Windows Logs to Elastic Stack Using Winlogbeat and Sysmon
Install and Setup ELK Stack
In order to visualize and analyze the events collected by Winlogbeat/Sysmon, you need to have setup your Elastic Stack. See the links below on how to install and setup Elastic Stack on Fedora/CentOS/Ubuntu servers.
Install Winlogbeat on Windows
In this guide, we are going to use Windows Server 2022 as our Windows system. Therefore, you need to install both Winlogbeat and Sysmon on your Windows system in order to ship events to Elastic stack.
Navigate to Winlogbeat downloads page and download Winlogbeat zip file.
Once the download is done, extract the Winlogbeat zipped file. As of this guide update, the current version ELK and beats is v8.17. Hence, we have winlogbeat-8.17.1-windows-x86_64.zip.
When you extract, you should get a folder, winlogbeat-8.17.1-windows-x86_64.
Move the winlogbeat-8.17.1-windows-x86_64 directory to C:\Program Files and rename it to Winlogbeat. Your directory should look like as in below;
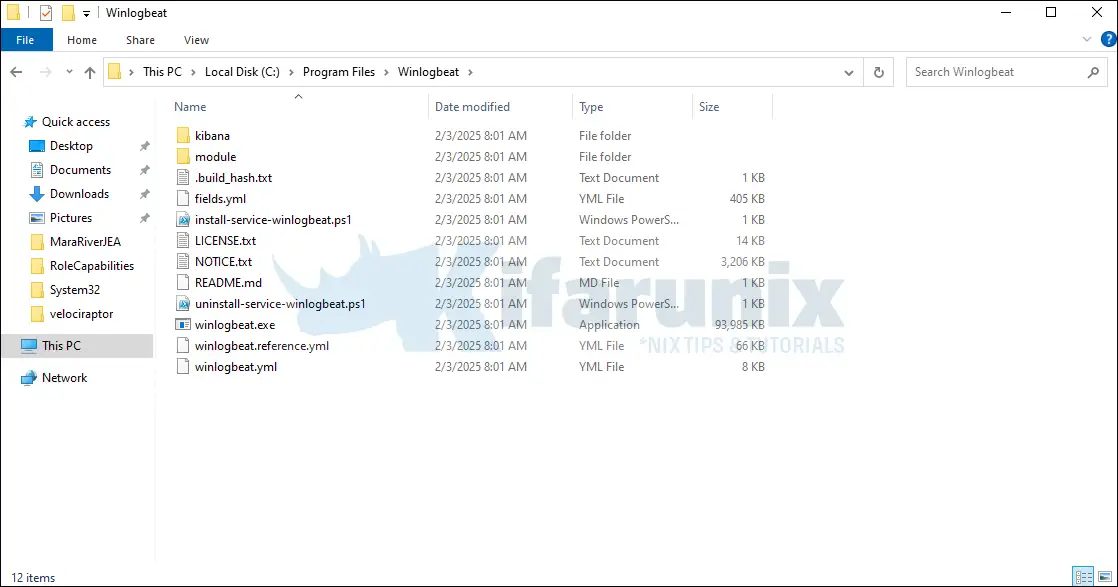
Next, to install Winlogbeat on Windows, you need to execute the install-service-winlogbeat.ps1 installation script.
Hence, open the Powershell as the administrator and change to Winlogbeat directory by executing the command below;
cd C:\'Program Files'\Winlogbeat
Next, run the Winlogbeat installer as shown below;
.\install-service-winlogbeat.ps1
If you get the error, cannot be loaded because the execution of scripts is disabled on this system, as shown below, you need to enable the script execution.
PS C:\Program Files\Winlogbeat> .\install-service-winlogbeat.ps1
File C:\Program Files\Winlogbeat\install-service-winlogbeat.ps1 cannot be loaded because the execution of scripts is disabled on this system. Please see "get-help about_signing" for more details.
At line:1 char:33
+ .\install-service-winlogbeat.ps1 <<<<
    + CategoryInfo          : NotSpecified: (:) [], PSSecurityException
    + FullyQualifiedErrorId : RuntimeException
As a result, you need to execute the Winlogbeat script with unrestricted execution policy as shown in the command below;
PowerShell.exe -ExecutionPolicy UnRestricted -File .\install-service-winlogbeat.ps1PS C:\Program Files\Winlogbeat> PowerShell.exe -ExecutionPolicy UnRestricted -File .\install-service-winlogbeat.ps1
Status Name DisplayName
------ ---- -----------
Stopped winlogbeat winlogbeat
Install Sysmon on Windows
Download Sysmon from the downloads page.
Once the download is complete, extract the contents of the zipped file to C:\Program Files directory.
Once the extraction is done, you folder should look like as in below;
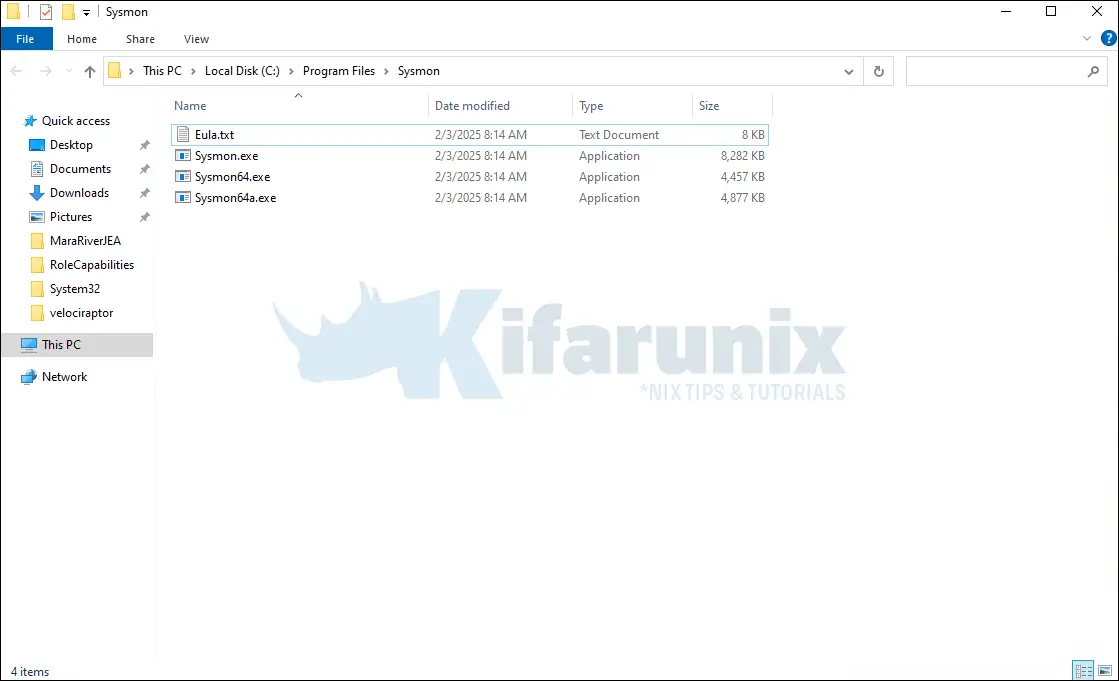
Install Sysmon with md5 and sha256 hashing of process created, log loading of modules and monitoring network connections, open a CMD as an administrator and navigate to C:\Program Files\Sysmon and execute the command below;
cd C:\'Program Files'\Sysmon
.\Sysmon64.exe -i -accepteula -h md5,sha256,imphash -l -n
System Monitor v15.15 - System activity monitor
By Mark Russinovich and Thomas Garnier
Copyright (C) 2014-2024 Microsoft Corporation
Using libxml2. libxml2 is Copyright (C) 1998-2012 Daniel Veillard. All Rights Reserved.
Sysinternals - www.sysinternals.com

Sysmon64 installed.
SysmonDrv installed.
Starting SysmonDrv.
SysmonDrv started.
Starting Sysmon64..
Sysmon64 started.
Configuring Winlogbeat
The main configuration file for Winlogbeat is C:\Program Files\Winlogbeat\winlogbeat.yml with the reference config file being C:\Program Files\Winlogbeat\winlogbeat.reference.yml.
To edit this file, you can use Notepad++ as administrator.
By default, Winlogbeat is set to monitor application, security, and system logs, and logs from Sysmon.
# ======================== Winlogbeat specific options =========================

# event_logs specifies a list of event logs to monitor as well as any
# accompanying options. The YAML data type of event_logs is a list of
# dictionaries.
#
# The supported keys are name, id, xml_query, tags, fields, fields_under_root,
# forwarded, ignore_older, level, event_id, provider, and include_xml.
# The xml_query key requires an id and must not be used with the name,
# ignore_older, level, event_id, or provider keys. Please visit the
# documentation for the complete details of each option.
# https://go.es.io/WinlogbeatConfig

winlogbeat.event_logs:
  - name: Application
    ignore_older: 72h

  - name: System

  - name: Security

  - name: Microsoft-Windows-Sysmon/Operational

  - name: Windows PowerShell
    event_id: 400, 403, 600, 800

  - name: Microsoft-Windows-PowerShell/Operational
    event_id: 4103, 4104, 4105, 4106

  - name: ForwardedEvents
    tags: [forwarded]

# ====================== Elasticsearch template settings =======================
If you need to see more event types, you can execute the command Get-EventLog * in PowerShell.
Under the general settings, you can optionally setup the name of the Beat and the Tags associated with the events.
...
#================================ General =====================================

# The name of the shipper that publishes the network data. It can be used to group
# all the transactions sent by a single shipper in the web interface.
name: winlogbeat

# The tags of the shipper are included in their own field with each
# transaction published.
#tags: ["service-X", "web-tier"]
tags: ["windows_systems"]

# Optional fields that you can specify to add additional information to the
# output.
#fields:
#  env: staging
...
We have used the default settings. That is a sample config if you want to set the name of the Beat.
Next, setup the Winlogbeat output. In this demo, we are sending the logs directly to Elasticsearch nodes. Elasticsearch 8 requires credential and connects via SSL.
Thus, get the CA cert from the Elasticsearch node;
cat /etc/elasticsearch/certs/http_ca.crtand store it on the Winlogbeat folder. We have stored it as C:\Program Files\Winlogbeat\http_ca.crt.
Next, update the ES connection details:
# ================================== Outputs ===================================

# Configure what output to use when sending the data collected by the beat.

# ---------------------------- Elasticsearch Output ----------------------------
output.elasticsearch:
  # Array of hosts to connect to.
  hosts: ["10.0.1.15:9200"]

  # Protocol - either `http` (default) or `https`.
  protocol: "https"
  ssl.certificate_authorities: ['C:\Program Files\Winlogbeat\http_ca.crt']

  # Authentication credentials - either API key or username/password.
  #api_key: "id:api_key"
  username: "elastic"
  password: "password"

  # Pipeline to route events to security, sysmon, or powershell pipelines.
  pipeline: "winlogbeat-%{[agent.version]}-routing"
If Elasticsearch and Kibana are not running on the same host and you want to use Kibana Winlogbeat dashboards, you can specify Kibana URL. Kibana must be reachable on non-loopback address. For example;
...
setup.kibana:

  # Kibana Host
  # Scheme and port can be left out and will be set to the default (http and 5601)
  # In case you specify and additional path, the scheme is required: http://localhost:5601/path
  # IPv6 addresses should always be defined as: https://[2001:db8::1]:5601
  #host: "localhost:5601"
  host: "192.168.43.104:5601"
...
Also, if you are using Logstash, you can comment out the Elasticsearch output and specify Logstash connection addresses.
...
#-------------------------- Elasticsearch output ------------------------------
#output.elasticsearch:
  # Array of hosts to connect to.
  #hosts: ["localhost:9200"]
  #hosts: ["192.168.43.104:9200", "192.168.43.105:9200", "192.168.43.106:9200"]

  # Optional protocol and basic auth credentials.
  #protocol: "https"
  #username: "elastic"
  #password: "changeme"

#----------------------------- Logstash output --------------------------------
output.logstash:
  # The Logstash hosts
  #hosts: ["localhost:5044"]
  hosts: ["192.168.43.104:5044"]
...
Winlogbeat configuration checks
Once done with configuration, save the file and run the configuration checks. To run the configuration checks, open Powershell as an administrator and execute the command below;
cd C:\'Program Files'\Winlogbeat
.\winlogbeat.exe test config -c .\winlogbeat.yml -e
If there is no error with the configuration, you should see the Config Ok.
{"log.level":"info","@timestamp":"2025-02-03T08:29:57.323Z","log.origin":{"function":"github.com/elastic/beats/v7/libbeat/cmd/instance.(*Beat).configure","file.name":"instance/beat.go","file.line":1062},"message":"Home path: [C:\\Program Files\\Winlogbeat] Config path: [C:\\Program Files\\Winlogbeat] Data path: [C:\\Program Files\\Winlogbeat\\data] Logs path: [C:\\Program Files\\Winlogbeat\\logs]","service.name":"winlogbeat","ecs.version":"1.6.0"}
{"log.level":"info","@timestamp":"2025-02-03T08:29:57.362Z","log.origin":{"function":"github.com/elastic/beats/v7/libbeat/cmd/instance.(*Beat).configure","file.name":"instance/beat.go","file.line":1070},"message":"Beat ID: 77e5fe93-2798-4218-bbd0-9a0fb4e3b63a","service.name":"winlogbeat","ecs.version":"1.6.0"}
{"log.level":"info","@timestamp":"2025-02-03T08:29:58.320Z","log.logger":"beat","log.origin":{"function":"github.com/elastic/beats/v7/libbeat/cmd/instance.(*Beat).createBeater","file.name":"instance/beat.go","file.line":570},"message":"Setup Beat: winlogbeat; Version: 8.17.1","service.name":"winlogbeat","ecs.version":"1.6.0"}
{"log.level":"info","@timestamp":"2025-02-03T08:29:58.345Z","log.logger":"beat","log.origin":{"function":"github.com/elastic/beats/v7/libbeat/cmd/instance.(*Beat).logSystemInfo","file.name":"instance/beat.go","file.line":1623},"message":"Beat info","service.name":"winlogbeat","system_info":{"beat":{"path":{"config":"C:\\Program Files\\Winlogbeat","data":"C:\\Program Files\\Winlogbeat\\data","home":"C:\\Program Files\\Winlogbeat","logs":"C:\\Program Files\\Winlogbeat\\logs"},"type":"winlogbeat","uuid":"77e5fe93-2798-4218-bbd0-9a0fb4e3b63a"},"ecs.version":"1.6.0"}}
{"log.level":"info","@timestamp":"2025-02-03T08:29:58.347Z","log.logger":"beat","log.origin":{"function":"github.com/elastic/beats/v7/libbeat/cmd/instance.(*Beat).logSystemInfo","file.name":"instance/beat.go","file.line":1632},"message":"Build info","service.name":"winlogbeat","system_info":{"build":{"commit":"424070e87d831d2d66a7514e1c1120ad540a86db","libbeat":"8.17.1","time":"2025-01-10T18:12:41.000Z","version":"8.17.1"},"ecs.version":"1.6.0"}}
{"log.level":"info","@timestamp":"2025-02-03T08:29:58.347Z","log.logger":"beat","log.origin":{"function":"github.com/elastic/beats/v7/libbeat/cmd/instance.(*Beat).logSystemInfo","file.name":"instance/beat.go","file.line":1635},"message":"Go runtime info","service.name":"winlogbeat","system_info":{"go":{"os":"windows","arch":"amd64","max_procs":1,"version":"go1.22.10"},"ecs.version":"1.6.0"}}
{"log.level":"info","@timestamp":"2025-02-03T08:29:58.350Z","log.logger":"beat","log.origin":{"function":"github.com/elastic/beats/v7/libbeat/cmd/instance.(*Beat).logSystemInfo","file.name":"instance/beat.go","file.line":1641},"message":"Host info","service.name":"winlogbeat","system_info":{"host":{"architecture":"x86_64","native_architecture":"x86_64","boot_time":"2025-02-02T20:15:56Z","name":"MARARIVER","ip":["fe80::9bed:c7f4:5713:2aad","10.0.1.12","::1","127.0.0.1"],"kernel_version":"10.0.20348.2694 (WinBuild.160101.0800)","mac":["0e:14:41:e7:ff:51"],"os":{"type":"windows","family":"windows","platform":"windows","name":"Windows Server 2022 Datacenter","version":"10.0","major":10,"minor":0,"patch":0,"build":"20348.2700"},"timezone":"UTC","timezone_offset_sec":0,"id":"de78e0b1-2fb5-4213-aef1-ae8f79794514"},"ecs.version":"1.6.0"}}
{"log.level":"info","@timestamp":"2025-02-03T08:29:58.353Z","log.logger":"beat","log.origin":{"function":"github.com/elastic/beats/v7/libbeat/cmd/instance.(*Beat).logSystemInfo","file.name":"instance/beat.go","file.line":1670},"message":"Process info","service.name":"winlogbeat","system_info":{"process":{"cwd":"C:\\Program Files\\Winlogbeat","exe":"C:\\Program Files\\Winlogbeat\\winlogbeat.exe","name":"winlogbeat.exe","pid":7400,"ppid":6576,"start_time":"2025-02-03T08:29:53.540Z"},"ecs.version":"1.6.0"}}
{"log.level":"info","@timestamp":"2025-02-03T08:29:58.378Z","log.logger":"esclientleg","log.origin":{"function":"github.com/elastic/beats/v7/libbeat/esleg/eslegclient.NewConnection","file.name":"eslegclient/connection.go","file.line":132},"message":"elasticsearch url: http://localhost:9200","service.name":"winlogbeat","ecs.version":"1.6.0"}
{"log.level":"info","@timestamp":"2025-02-03T08:29:58.383Z","log.logger":"publisher","log.origin":{"function":"github.com/elastic/beats/v7/libbeat/publisher/pipeline.LoadWithSettings","file.name":"pipeline/module.go","file.line":105},"message":"Beat name: MARARIVER","service.name":"winlogbeat","ecs.version":"1.6.0"}
{"log.level":"info","@timestamp":"2025-02-03T08:29:58.389Z","log.logger":"winlogbeat","log.origin":{"function":"github.com/elastic/beats/v7/winlogbeat/beater.New","file.name":"beater/winlogbeat.go","file.line":70},"message":"State will be read from and persisted to C:\\Program Files\\Winlogbeat\\data\\.winlogbeat.yml","service.name":"winlogbeat","ecs.version":"1.6.0"}
Config OK
Load Elasticsearch templates
If Winlogbeat has a direction connection and is using Elasticearch as the output, it will automatically load the template. However, if you are using Logstash as the output, you need to manually load the Elasticsearch template. See example command to load the Elasticsearch template manually below;
cd C:\'Program Files'\Winlogbeat
.\winlogbeat.exe setup --index-management -E output.logstash.enabled=false -E 'output.elasticsearch.hosts=["192.168.43.104:9200"]'
Setup Kibana Dashboards
To load Winlogbeat default visualization dashboards, you need to have created the index pattern. Hence, navigate to Kibana and create the Winlogbeat index pattern.
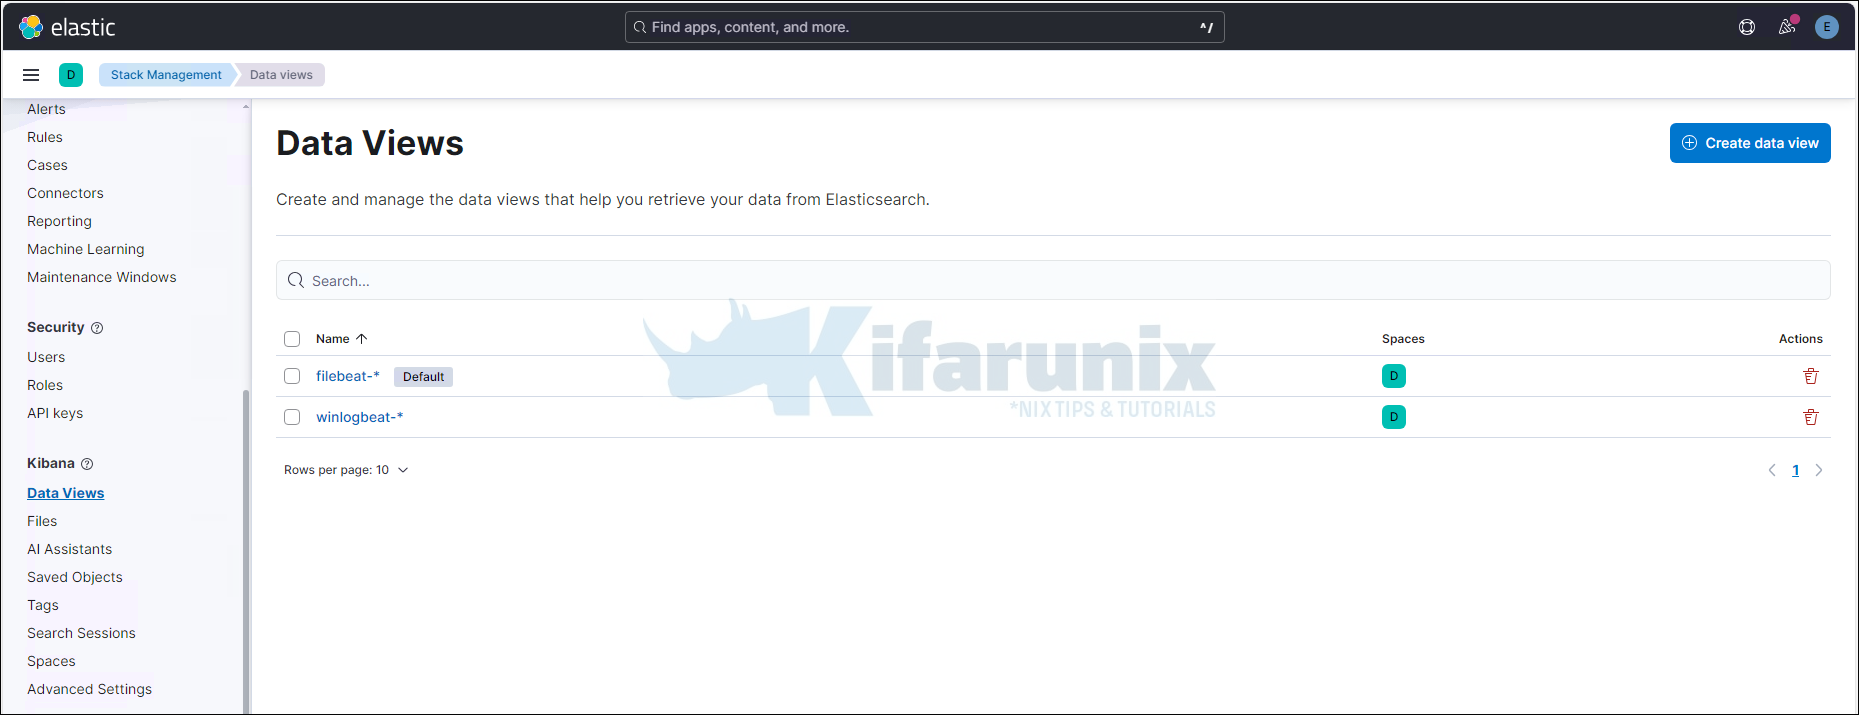
Otherwise, if you are using Elasticsearch as your output, you can load the dashboards by running the setup command or enabling dashboard loading in the winlogbeat.yml (setup.dashboards.enabled: true) configuration. This will automatically create the index pattern.
cd C:\'Program Files'\Winlogbeat
Replace <KIBANA-IP> accordingly.
.\winlogbeat.exe setup --dashboards -E setup.kibana.host='http://<KIBANA-IP>:5601'Loading dashboards (Kibana must be running and reachable)
Loaded dashboardsIf you are using Logstash as the output, run the command below to load the dashboards.
cd C:\'Program Files'\Winlogbeat>
.\winlogbeat.exe setup -e -E output.logstash.enabled=false -E output.elasticsearch.hosts=['192.168.43.104:9200']
Running Winlogbeat
To start or stop Winlogbeat, navigate to install directory and execute the commands below respectively.
cd C:\'Program Files'\Winlogbeat>Start-Service winlogbeat
To stop;
Stop-Service winlogbeat
You can also manage the Winlogbeat from system services.
View Winlogbeat Kibana Dashboard
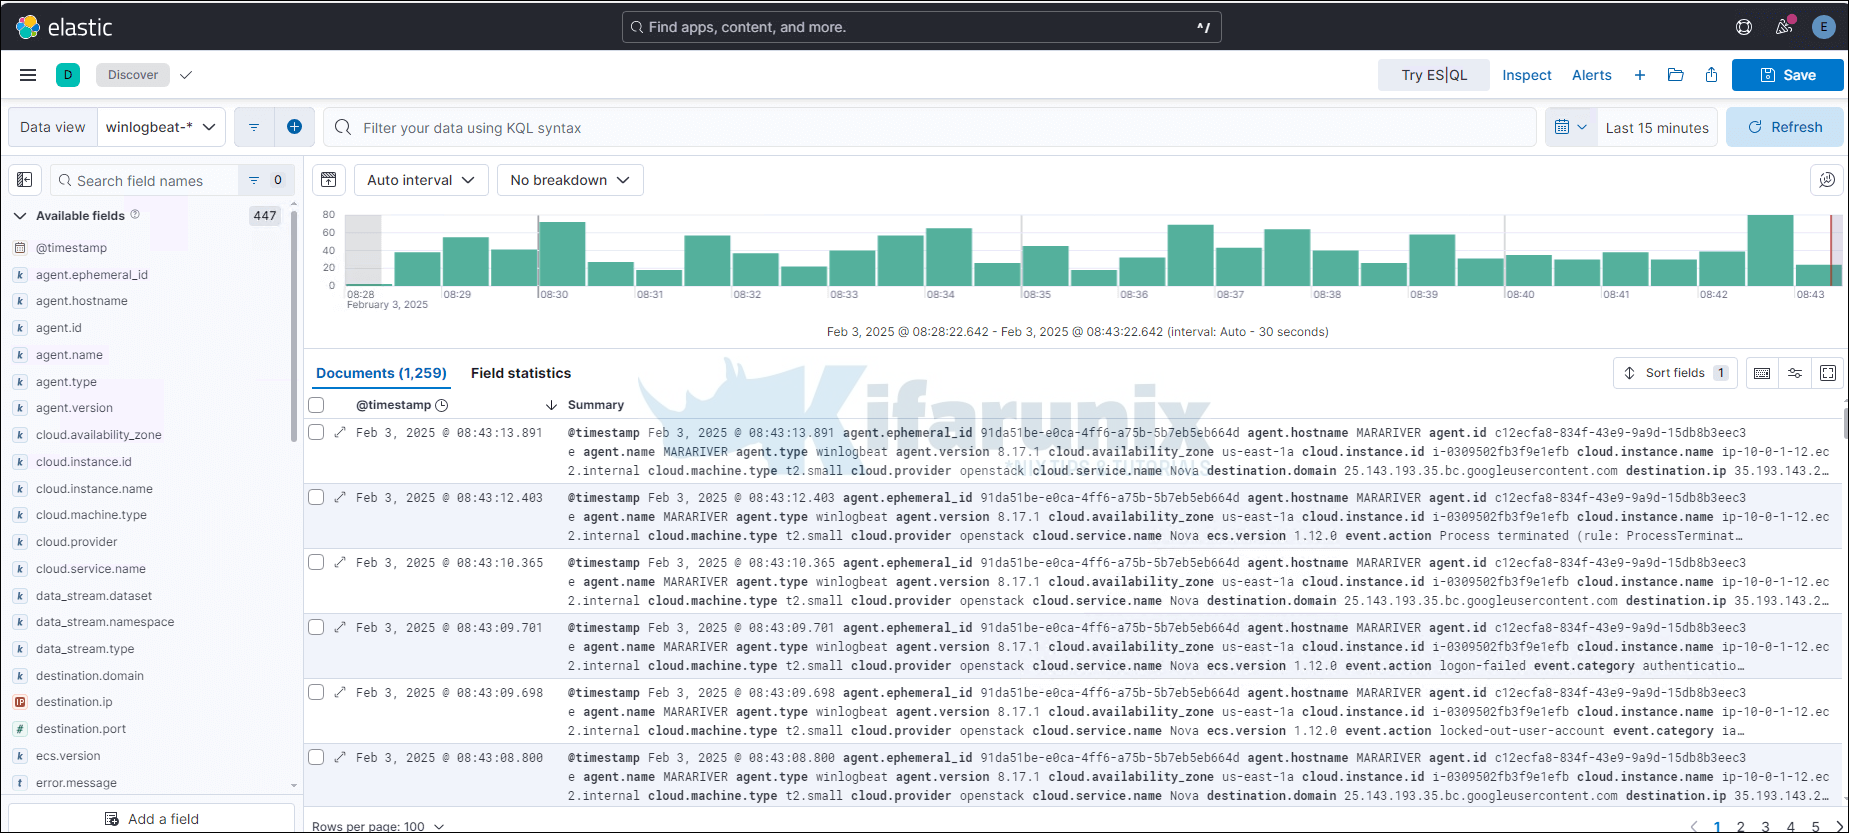
When Winlogbeat runs, you should now have the events and the dashboards.
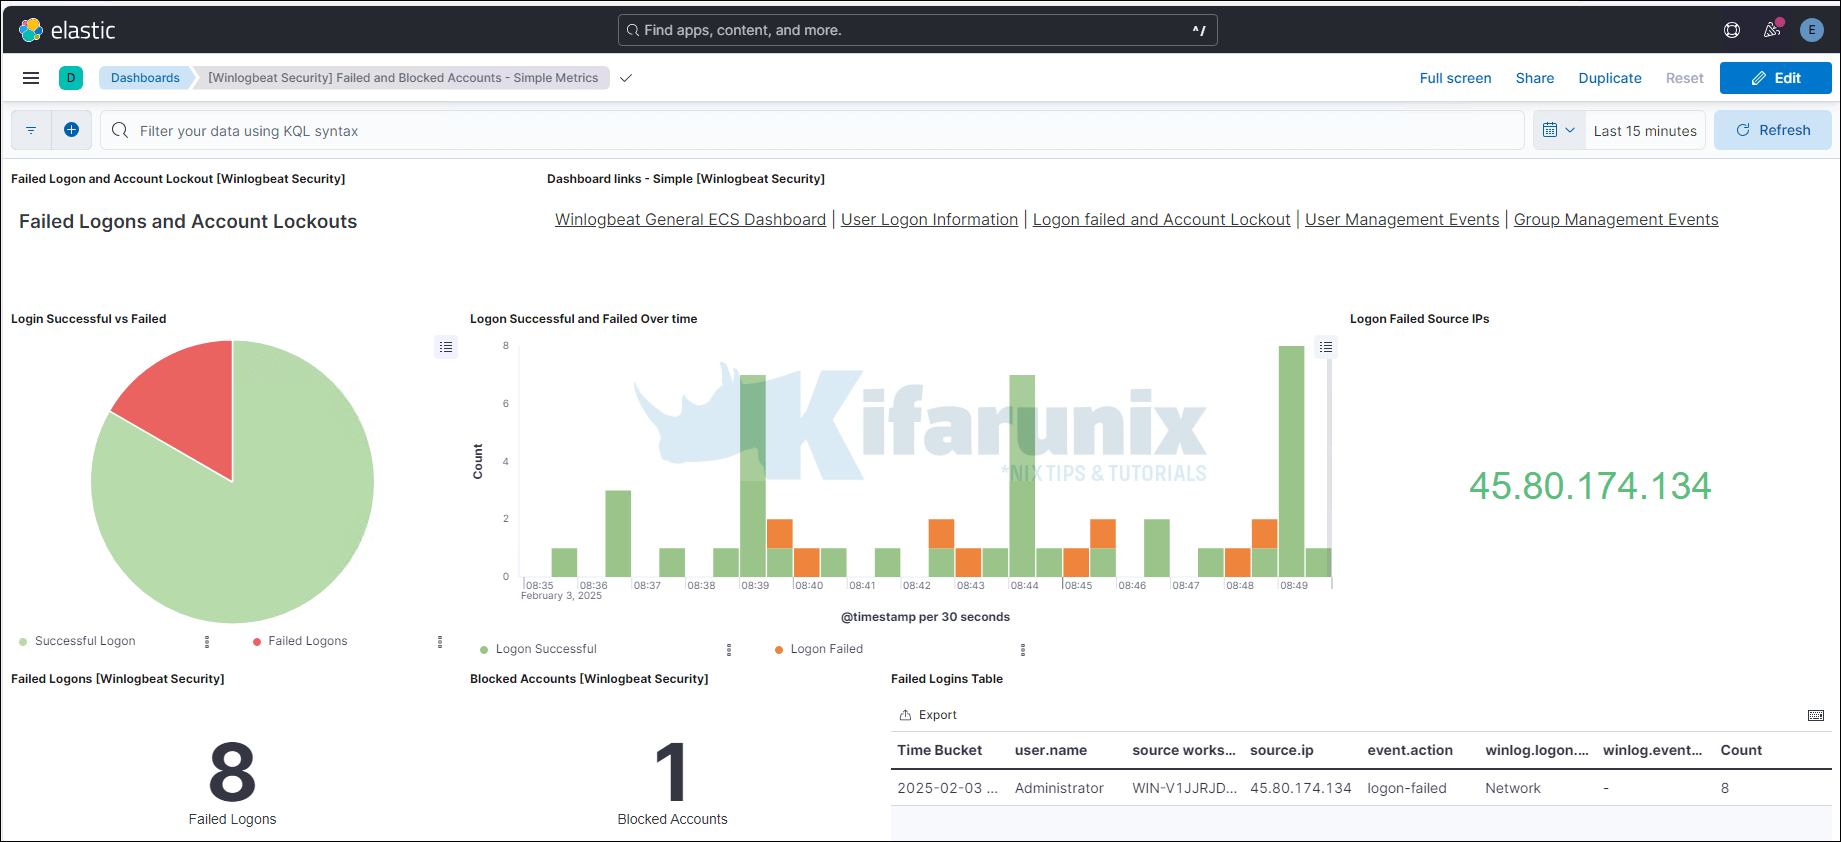
You can view Winlogbeat dashboards by navigating to Dashboards and select any Winlogbeat dashboard.
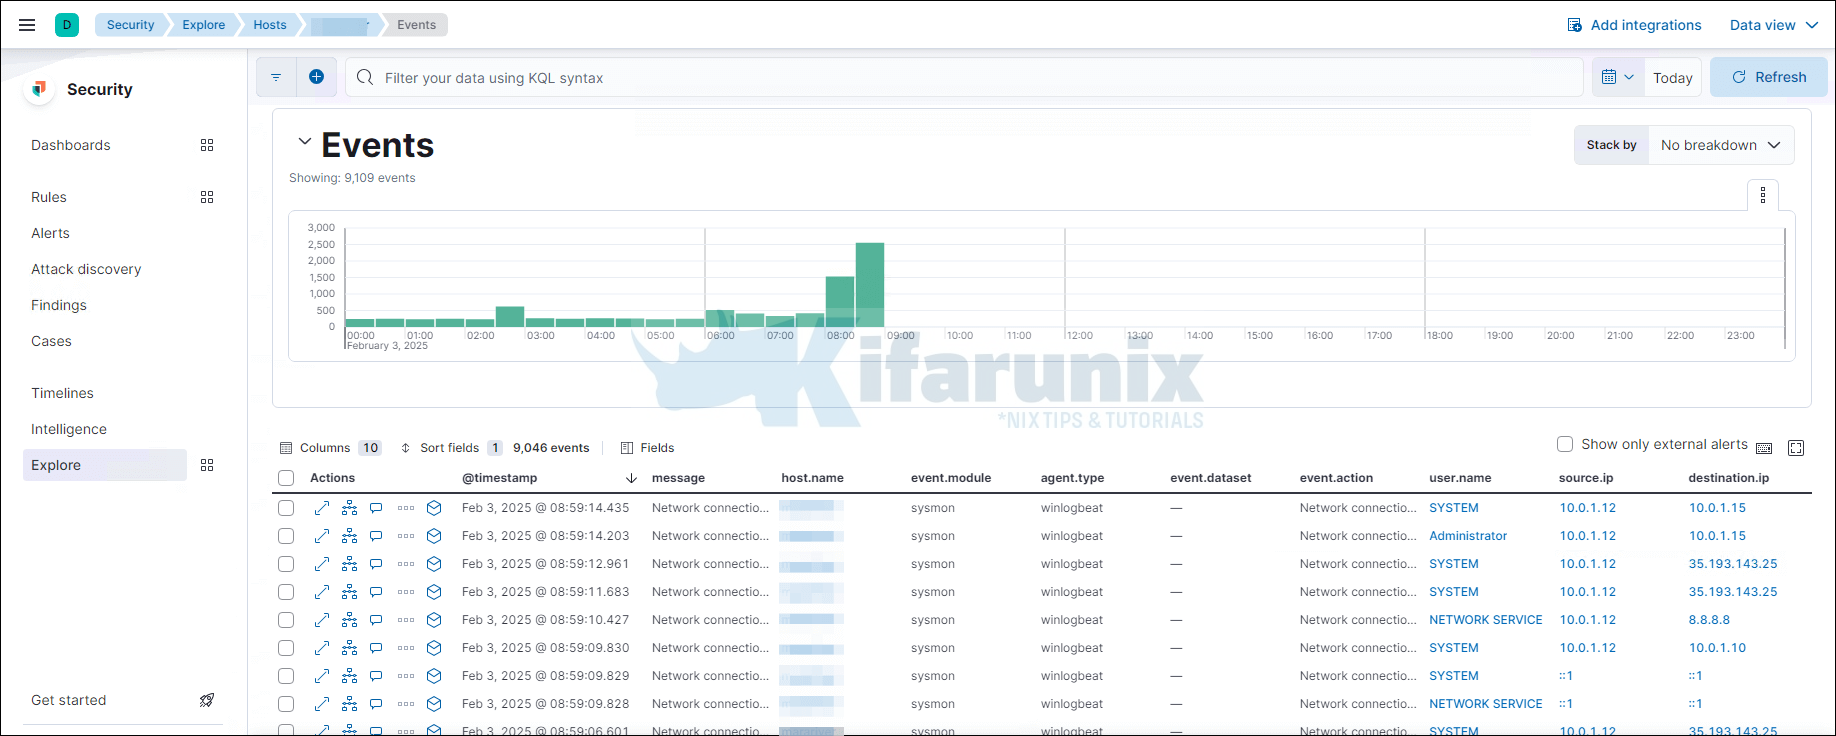
There you go. You can also check Winlogbeat events on Kibana SIEM (Security > Explore > Hosts > All Hosts > Your Windows Hosts).
That is all on how to send Windows logs to Elastic Stack using Winlogbeat and Sysmon. You can continue to explore Kibana SIEM and Winlogbeat dashboards to analyze your windows events. Enjoy.
Related Tutorials:
Setup Multi-node Elasticsearch 7.x Cluster on Fedora 30/Fedora 29/CentOS 7
Install and Configure Elastic Auditbeat on Ubuntu 18.04

