In this tutorial, you will learn how to visualize ClamAV scan logs on ELK stack Kibana. ClamAV is an opensource antivirus engine for detecting trojans, viruses, malware & other malicious threats. ELK on the other hand is a combination of opensource tools that can be used to collect, parse and visualize various system logs.
Table of Contents
Visualizing ClamAV Scan Logs on ELK Stack Kibana
Well, I have been scouring through the Internet lately trying to find tutorials on how to visualize ClamAV logs on Kibana and I hardly find any useful information. As such, I decided to find away out myself and what I achieved so far is what is presented in this guide.
Thus, NOTE that this is NOT an official tutorial on visualizing ClamAV scan logs on ELK stack Kibana but rather my own way of trying to ensure that I get ClamAV scan logs on the Kibana for visualization whenever the scan job is executed.
To proceed;
Install and Configure ELK Stack
You of course need to have ELK stack server already installed and up and running.
You can check our various tutorial on how to setup ELK stack;
How to install and Configure ELK Stack on Linux
Ensure that Logstash is installed!
Install ClamAV on your Linux System
Next, on the system where you want to be scanned, install and configure ClamAV to scan your respective directories.
Install and configure ClamAV on Linux
To ensure that your system is scanned at specific periods of time, consider setting the cron jobs.
In my workstation, the cron job below is used;
0 11 * * * /home/scripts/clamscan.shThe script is execute every day at 11:00 AM.
Configure ClamAV to Write Scan Results to Syslog
ClamAV, clamscan command line tool can be configured to log the scan results into a file using the -l FILE, or --log=FILE options.
However, the output of the report is always multiline.
This is a sample default report;
/home/kifarunix/Downloads/eicar_com.zip: Win.Test.EICAR_HDB-1 FOUND
/home/kifarunix/Downloads/wildfire-test-pe-file.exe: Win.Dropper.Bebloh-9954185-0 FOUND

----------- SCAN SUMMARY -----------
Known viruses: 8630735
Engine version: 0.103.6
Scanned directories: 63
Scanned files: 370
Infected files: 4
Data scanned: 74.59 MB
Data read: 35.62 MB (ratio 2.09:1)
Time: 32.894 sec (0 m 32 s)
Start Date: 2022:08:26 14:09:56
End Date:   2022:08:26 14:10:29
In order for us to be able to process and parse this kind of log, we used this command below in our script;
cat /home/scripts/clamscan.shcpulimit -z -e clamscan -l 20 &
clamscan -ir /home/kifarunix/ | grep -vE "^$|^-" | sed 's/ FOUND//' | tr "\n" " " | sed 's/$/\n/' | logger -t clamscan -p local0.info
To demystify this script/command;
cpulimit -z -e clamscan -l 20 &: Clamscan is a CPU intensive program. This part of the command basically launches the clamscan in the background and limit it to 20% CPU time. If thecpulimitcommand is not available, you can install it. cpulimit is the package name.clamscan -ir /home/kifarunix/: launches the clamscan and instructs it to recursively (-r) scan the home directory for the user kifarunix and print the infected files (-i) only to the report.|: this is a pipe. it takes the output of previous command and pass it to the next command.grep -vE "^$|^-": Exclude empty lines (^$) and lines beginning with – (^-) from the report.sed 's/ FOUND//': Removes the keyword FOUND on from the report.tr "\n" " ": replaces new line with space to make a single line event.sed 's/$/\n/': Add new line break at the end of the report line.logger -t clamscan -p local0.info: Send the report to message into syslog into facility local0 and level info. It then tags the report as from clamscan program (-t clamscan). Replace the facility accordingly if local0 is already being used.
Now, we need to send the Clamscan logs to a specific file, in our example is /var/log/clamav/clamscan.log.
Therefore, we need to configure Rsyslog to send logs written to local0.info to /var/log/clamav/clamscan.log.
echo -e "local0.info\t\t\t/var/log/clamav/clamscan.log" >> /etc/rsyslog.confCheck the Rsyslog syntax;
rsyslogd -N1If no error, restart Rsyslog;
systemctl restart rsyslogThe final Clamscan log file looks like this if infected files are found on the system;
Aug 27 05:26:00 debian10 clamscan: home/kifarunix/Downloads/eicar.com.txt: Win.Test.EICAR_HDB-1 /home/kifarunix/Downloads/fileb.txt: Eicar-Signature /home/kifarunix/Downloads/eicar_com.zip: Win.Test.EICAR_HDB-1 /home/kifarunix/Downloads/wildfire-test-pe-file.exe: Win.Dropper.Bebloh-9954185-0 Known viruses: 8630735 Engine version: 0.103.6 Scanned directories: 52 Scanned files: 83 Infected files: 4 Data scanned: 2.05 MB Data read: 1.34 MB (ratio 1.53:1) Time: 44.876 sec (0 m 44 s) Start Date: 2022:08:27 05:08:01 End Date: 2022:08:27 05:08:45
If no infected files are found on the system, the log will look like;
Aug 27 05:47:18 debian10 clamscan: Known viruses: 8630735 Engine version: 0.103.6 Scanned directories: 1 Scanned files: 0 Infected files: 0 Data scanned: 0.00 MB Data read: 0.00 MB (ratio 0.00:1) Time: 18.974 sec (0 m 18 s) Start Date: 2022:08:27 05:46:59 End Date: 2022:08:27 05:47:18
As you can see, the output has been converted into a single line event and in syslog format.
This makes it easy to read the file using Filebeat and sent the output to Logstash for filtering.
Create Logstash Grok Patterns to Process ClamAV Logs
Now that you have the ClamAV logs a single line per scan, you need to create Logstash grok pattern to process and extract various fields from the log.
Here is our grok pattern that we used to parse ClamAV logs;
%{SYSLOGTIMESTAMP}\s%{IPORHOST}\s%{PROG:program}:\s+((?<infected_files>.+.|)(\s+|))Known viruses:\s+(?<known_viruses>\d+)\s+Engine version:\s+(?<engine_version>\S+)\s+Scanned directories:\s+(?<scanned_directories>\d+)\s+Scanned files:\s+(?<scanned_files>\d+)\s+Infected files:\s+(?<infected_files_num>\d+)\s+Data scanned:\s+(?<scanned_data_size>\S+.+)\s+Data read:\s+(?<data_read_size>\S+.+)\s+Time:\s+(?<scan_time>\S+.+)\s+Start Date:\s+(?<scan_start_time>%{YEAR}:%{MONTHNUM}:%{MONTHDAY}\s+%{TIME})\s+End Date:\s+(?<scan_end_time>%{YEAR}:%{MONTHNUM}:%{MONTHDAY}\s+%{TIME})
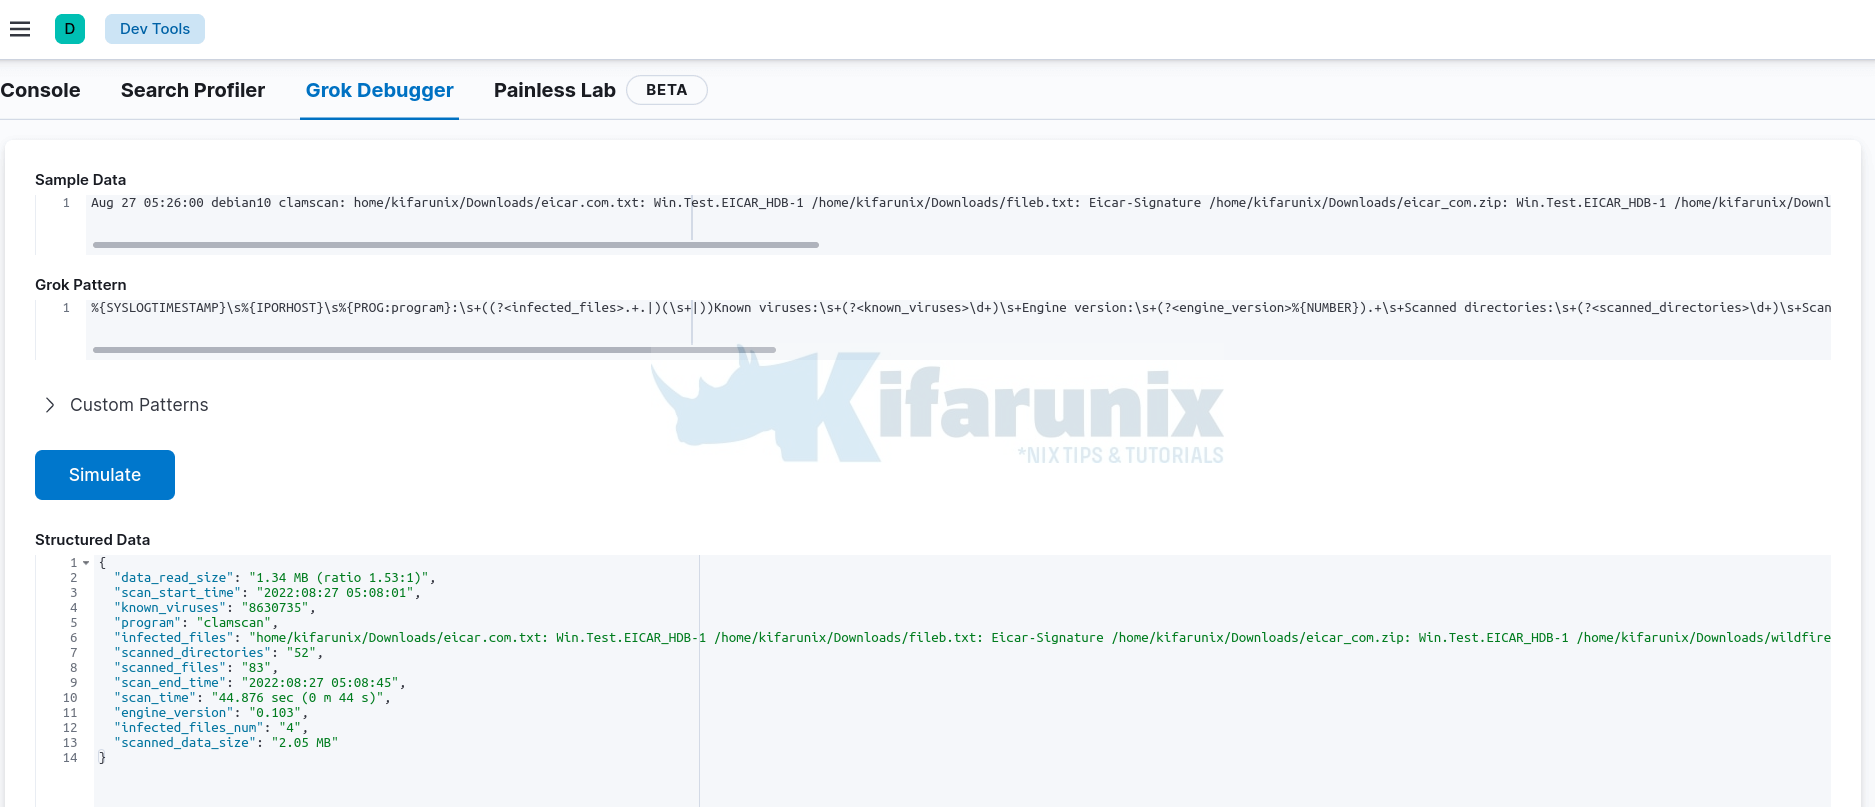
You can test the pattern using the online Grok debugger, or Kibana Grok debugger under Management > Dev Tools > Grok Debugger.
The grok pattern captures both the ClamAV log when and when not it contains the infected files path.
Configure Logstash to Process ClamAV Logs
Once you have the pattern, you can configure Logstash to process these logs and sent it to Elasticsearch;
Below is our sample configuration;
cat /etc/logstash/conf.d/clamscan.conf
input {
  beats {
    port => 5044
  }
}
filter {
    grok {
      match => { "message" => "%{SYSLOGTIMESTAMP}\s%{IPORHOST}\s%{PROG:program}:\s+((?<infected_files>.+.|)(\s+|))Known viruses:\s+(?<known_viruses>\d+)\s+Engine version:\s+(?<engine_version>\S+)\s+Scanned directories:\s+(?<scanned_directories>\d+)\s+Scanned files:\s+(?<scanned_files>\d+)\s+Infected files:\s+(?<infected_files_num>\d+)\s+Data scanned:\s+(?<scanned_data_size>\S+.+)\s+Data read:\s+(?<data_read_size>\S+.+)\s+Time:\s+(?<scan_time>\S+.+)\s+Start Date:\s+(?<scan_start_time>%{YEAR}:%{MONTHNUM}:%{MONTHDAY}\s+%{TIME})\s+End Date:\s+(?<scan_end_time>%{YEAR}:%{MONTHNUM}:%{MONTHDAY}\s+%{TIME})" }
    }
    mutate {
	gsub => [
	  "infected_files", " /", "
/"]
	remove_field => [ "message" ]
    }
}
output {
   elasticsearch {
     hosts => ["192.168.58.22:9200"]
     index => "clamscan-%{+YYYY.MM}"
   }
  # stdout { codec => rubydebug }

}
The Clamscan logs will be processed and written to clamscan-YYYY-MM index on Elasticsearch.
Running Logstash
Before you can start Logstash, ensure that the configuration syntax is okay. You can check the configuration using the command below;
sudo -u logstash /usr/share/logstash/bin/logstash -f /etc/logstash/conf.d/clamscan.conf --path.settings /etc/logstash/ -tIf all is good, you should see Configuration OK from the command output.
You can also check our tutorial on how to debug Logstash;
How to Debug Logstash Grok Filters
Then start logstash;
systemctl enable --now logstashConfirm that Logstash is running by checking if the port is already opened;
ss -atlnp | grep :5044LISTEN 0 4096 *:5044 *:* users:(("java",pid=2459,fd=112))Install Filebeat and Collect Clamscan Logs
You can check our various tutorials on how to install filebeat.
How to install filebeat on Linux systems
Configure Filebeat to collect collect Clamscan logs.
Remember on our scan script, we are logging the scan output in the file, /var/log/clamav/clamscan.log.
Thus, below is our filebeat configuration;
cat /etc/filebeat/filebeat.ymlfilebeat.inputs:
- type: filestream
enabled: true
paths:
- /var/log/clamav/clamscan.log
filebeat.config.modules:
path: ${path.config}/modules.d/*.yml
reload.enabled: false
setup.template.settings:
index.number_of_shards: 1
setup.kibana:
output.logstash:
hosts: ["192.168.58.22:5044"]
processors:
- add_host_metadata:
when.not.contains.tags: forwarded
- add_cloud_metadata: ~
- add_docker_metadata: ~
- add_kubernetes_metadata: ~
Test Filebeat configs;
filebeat test configConfig OKTest Filebeat Logstash output;
filebeat test outputlogstash: 192.168.58.22:5044...
connection...
parse host... OK
dns lookup... OK
addresses: 192.168.58.22
dial up... OK
TLS... WARN secure connection disabled
talk to server... OK
You can now start Filebeat;
systemctl enable --now filebeatInitiate the ClamAV scans and proceed to check if the logs are received on ELK stack.
Once the ClamAV has run, log will be written to clamscan-YYYY-MM index on Elasticsearch.
You can confirm by navigating to Kibana UI > Menu > Management > Stack Management > Data > Index Management.
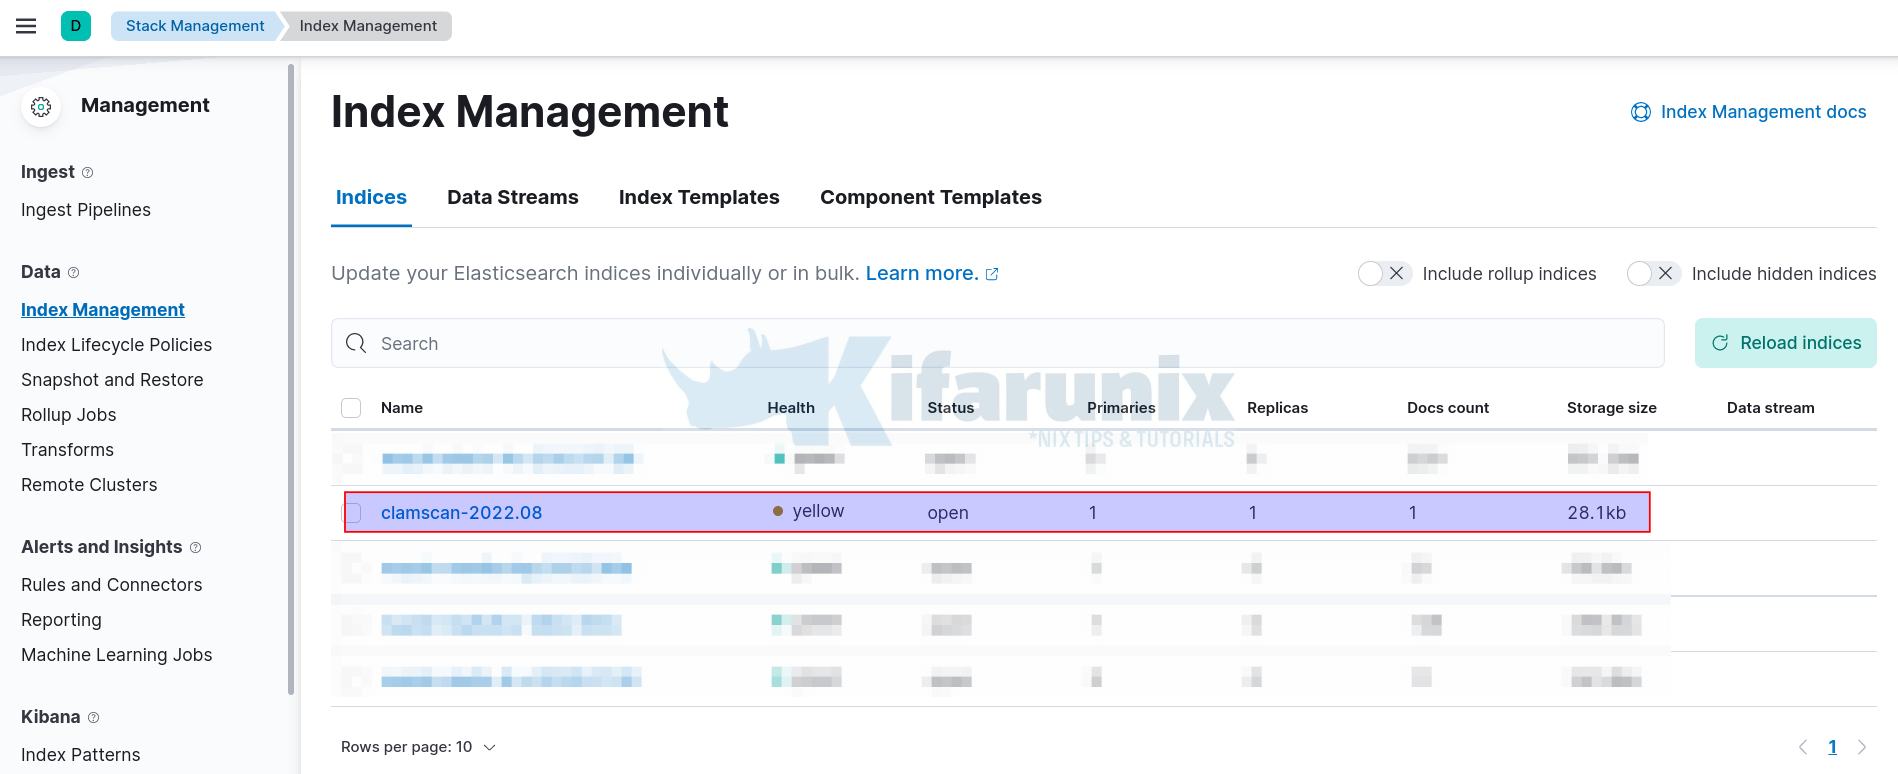
If the index is available already, then you need to create the index pattern on Kibana.
Thus;
- Navigate to the Menu > Management > Stack Management > Kibana > Index Patterns
- Create Index Pattern
- Enter the name of the index pattern, e.g clamscan-*
- Select timestamp field: @timestamp
- Create Index Pattern
Visualizing ClamAV Scan Logs on ELK Stack Kibana
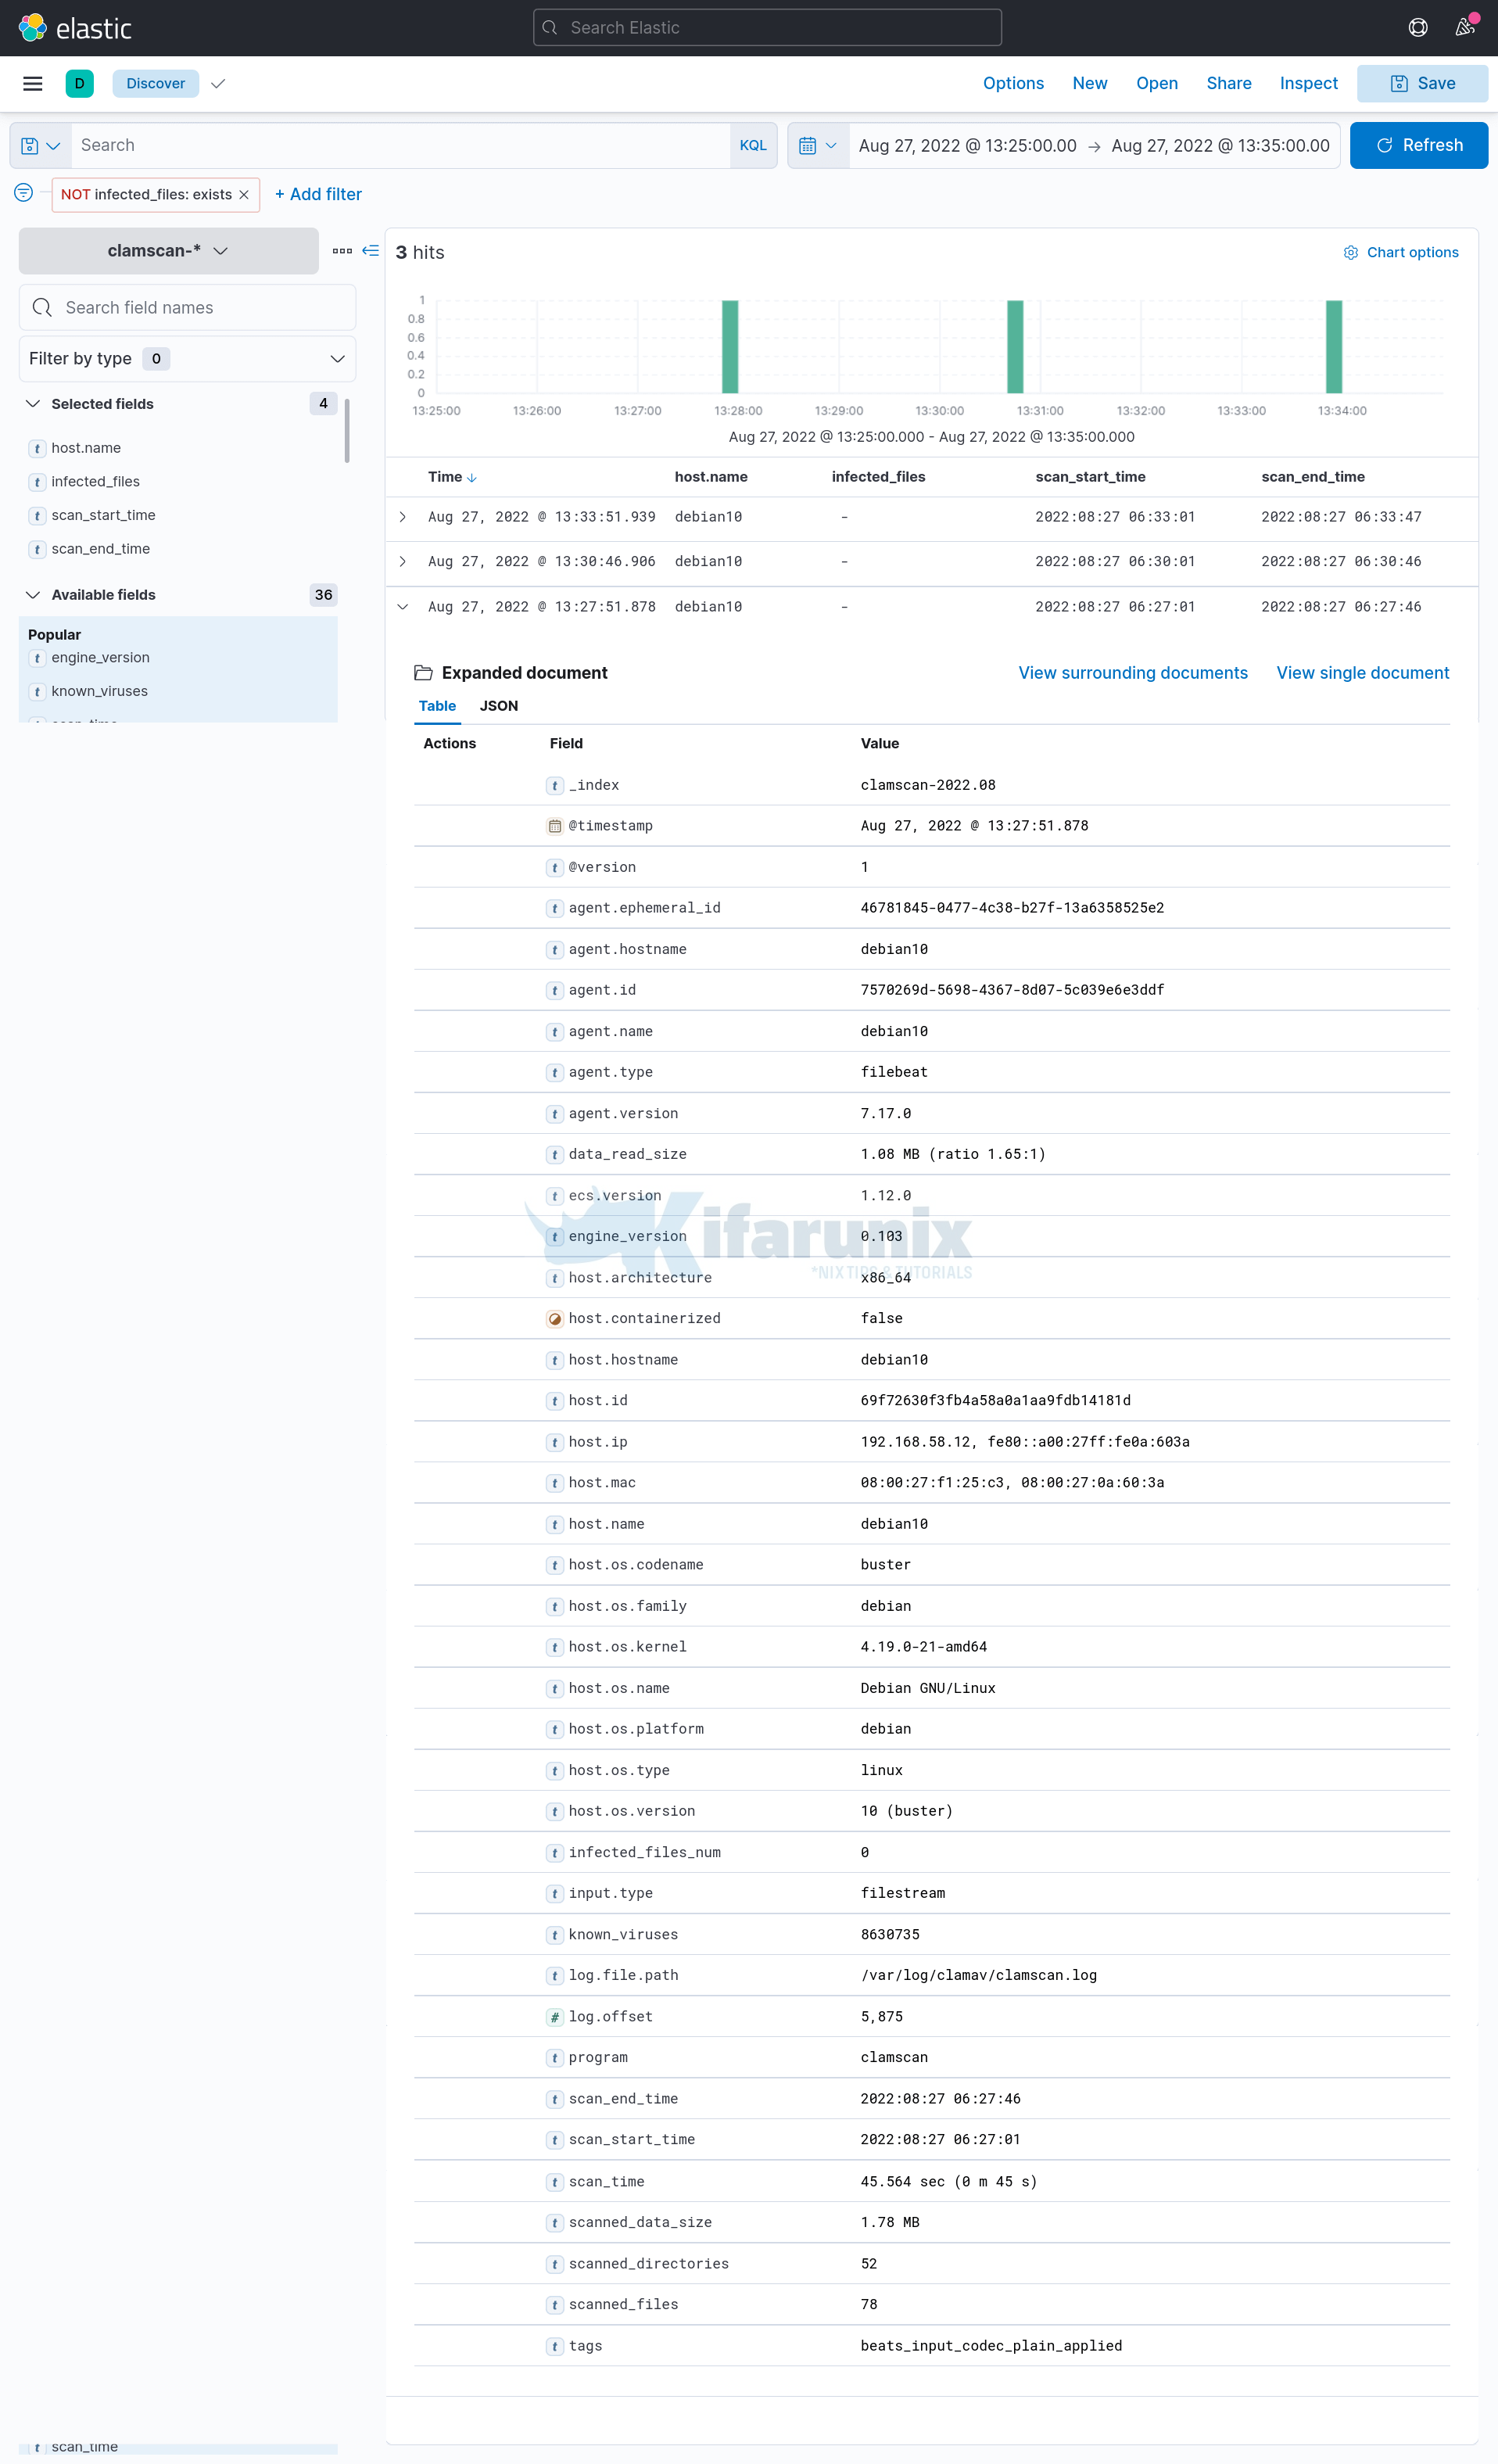
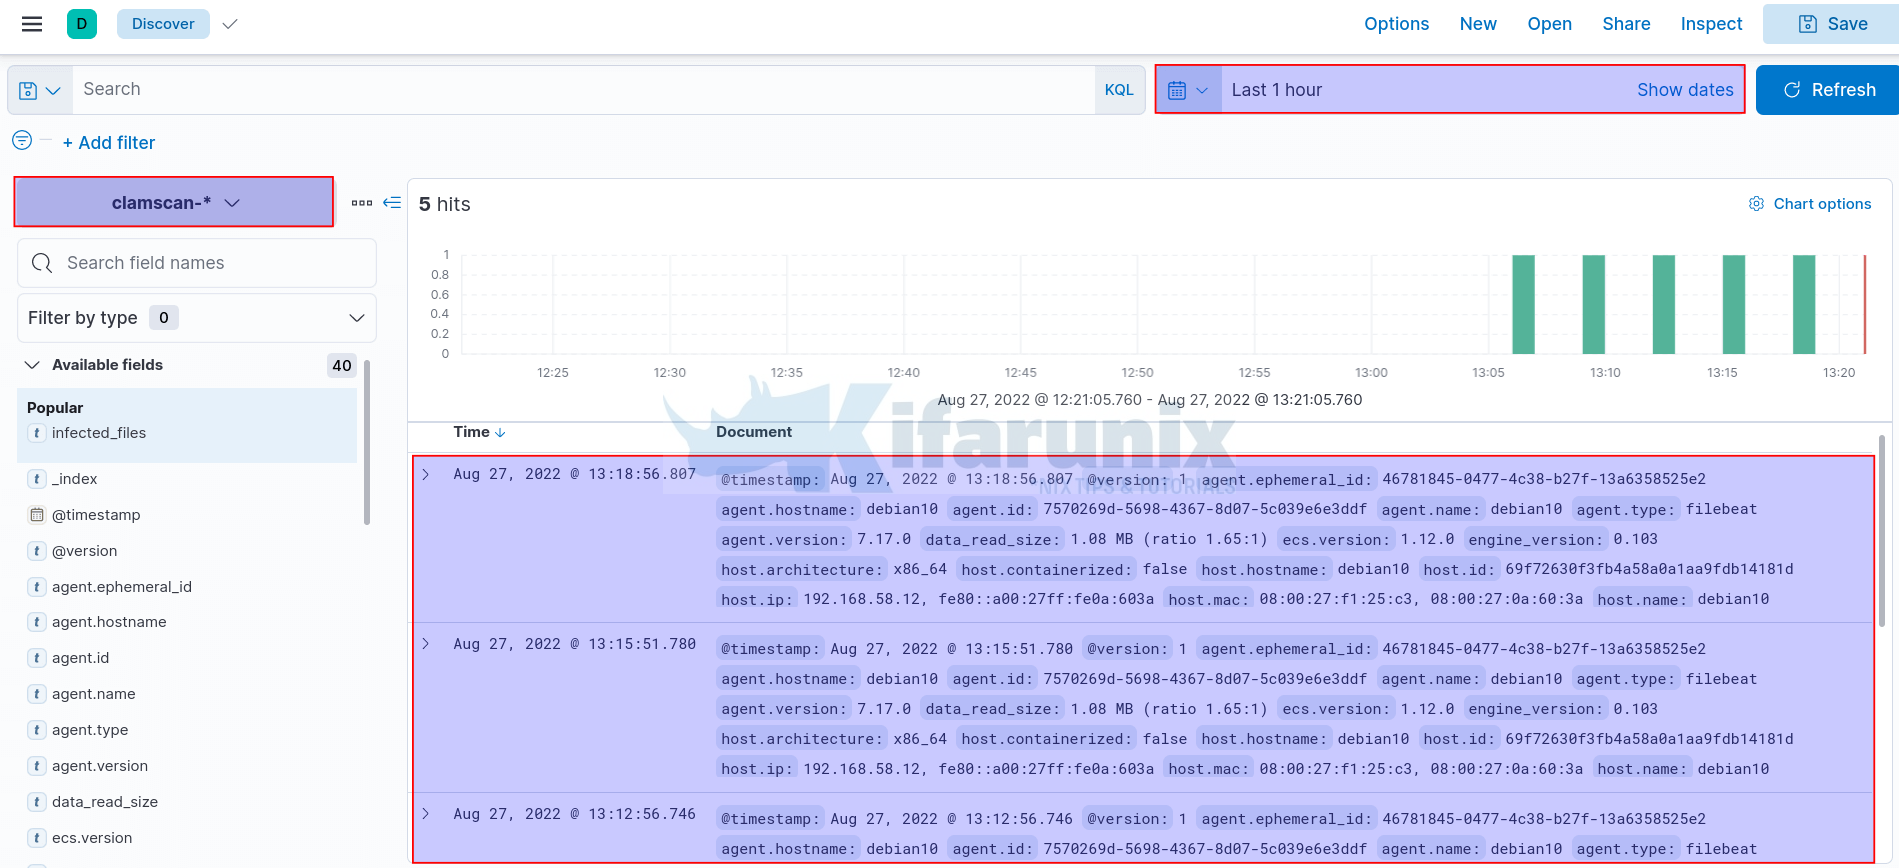
On Kibana Menu, navigate to Discover and select clamscan-* index to view Clamscan report.
Adjust the timeframe appropriately.
Expanding some events to view more information;
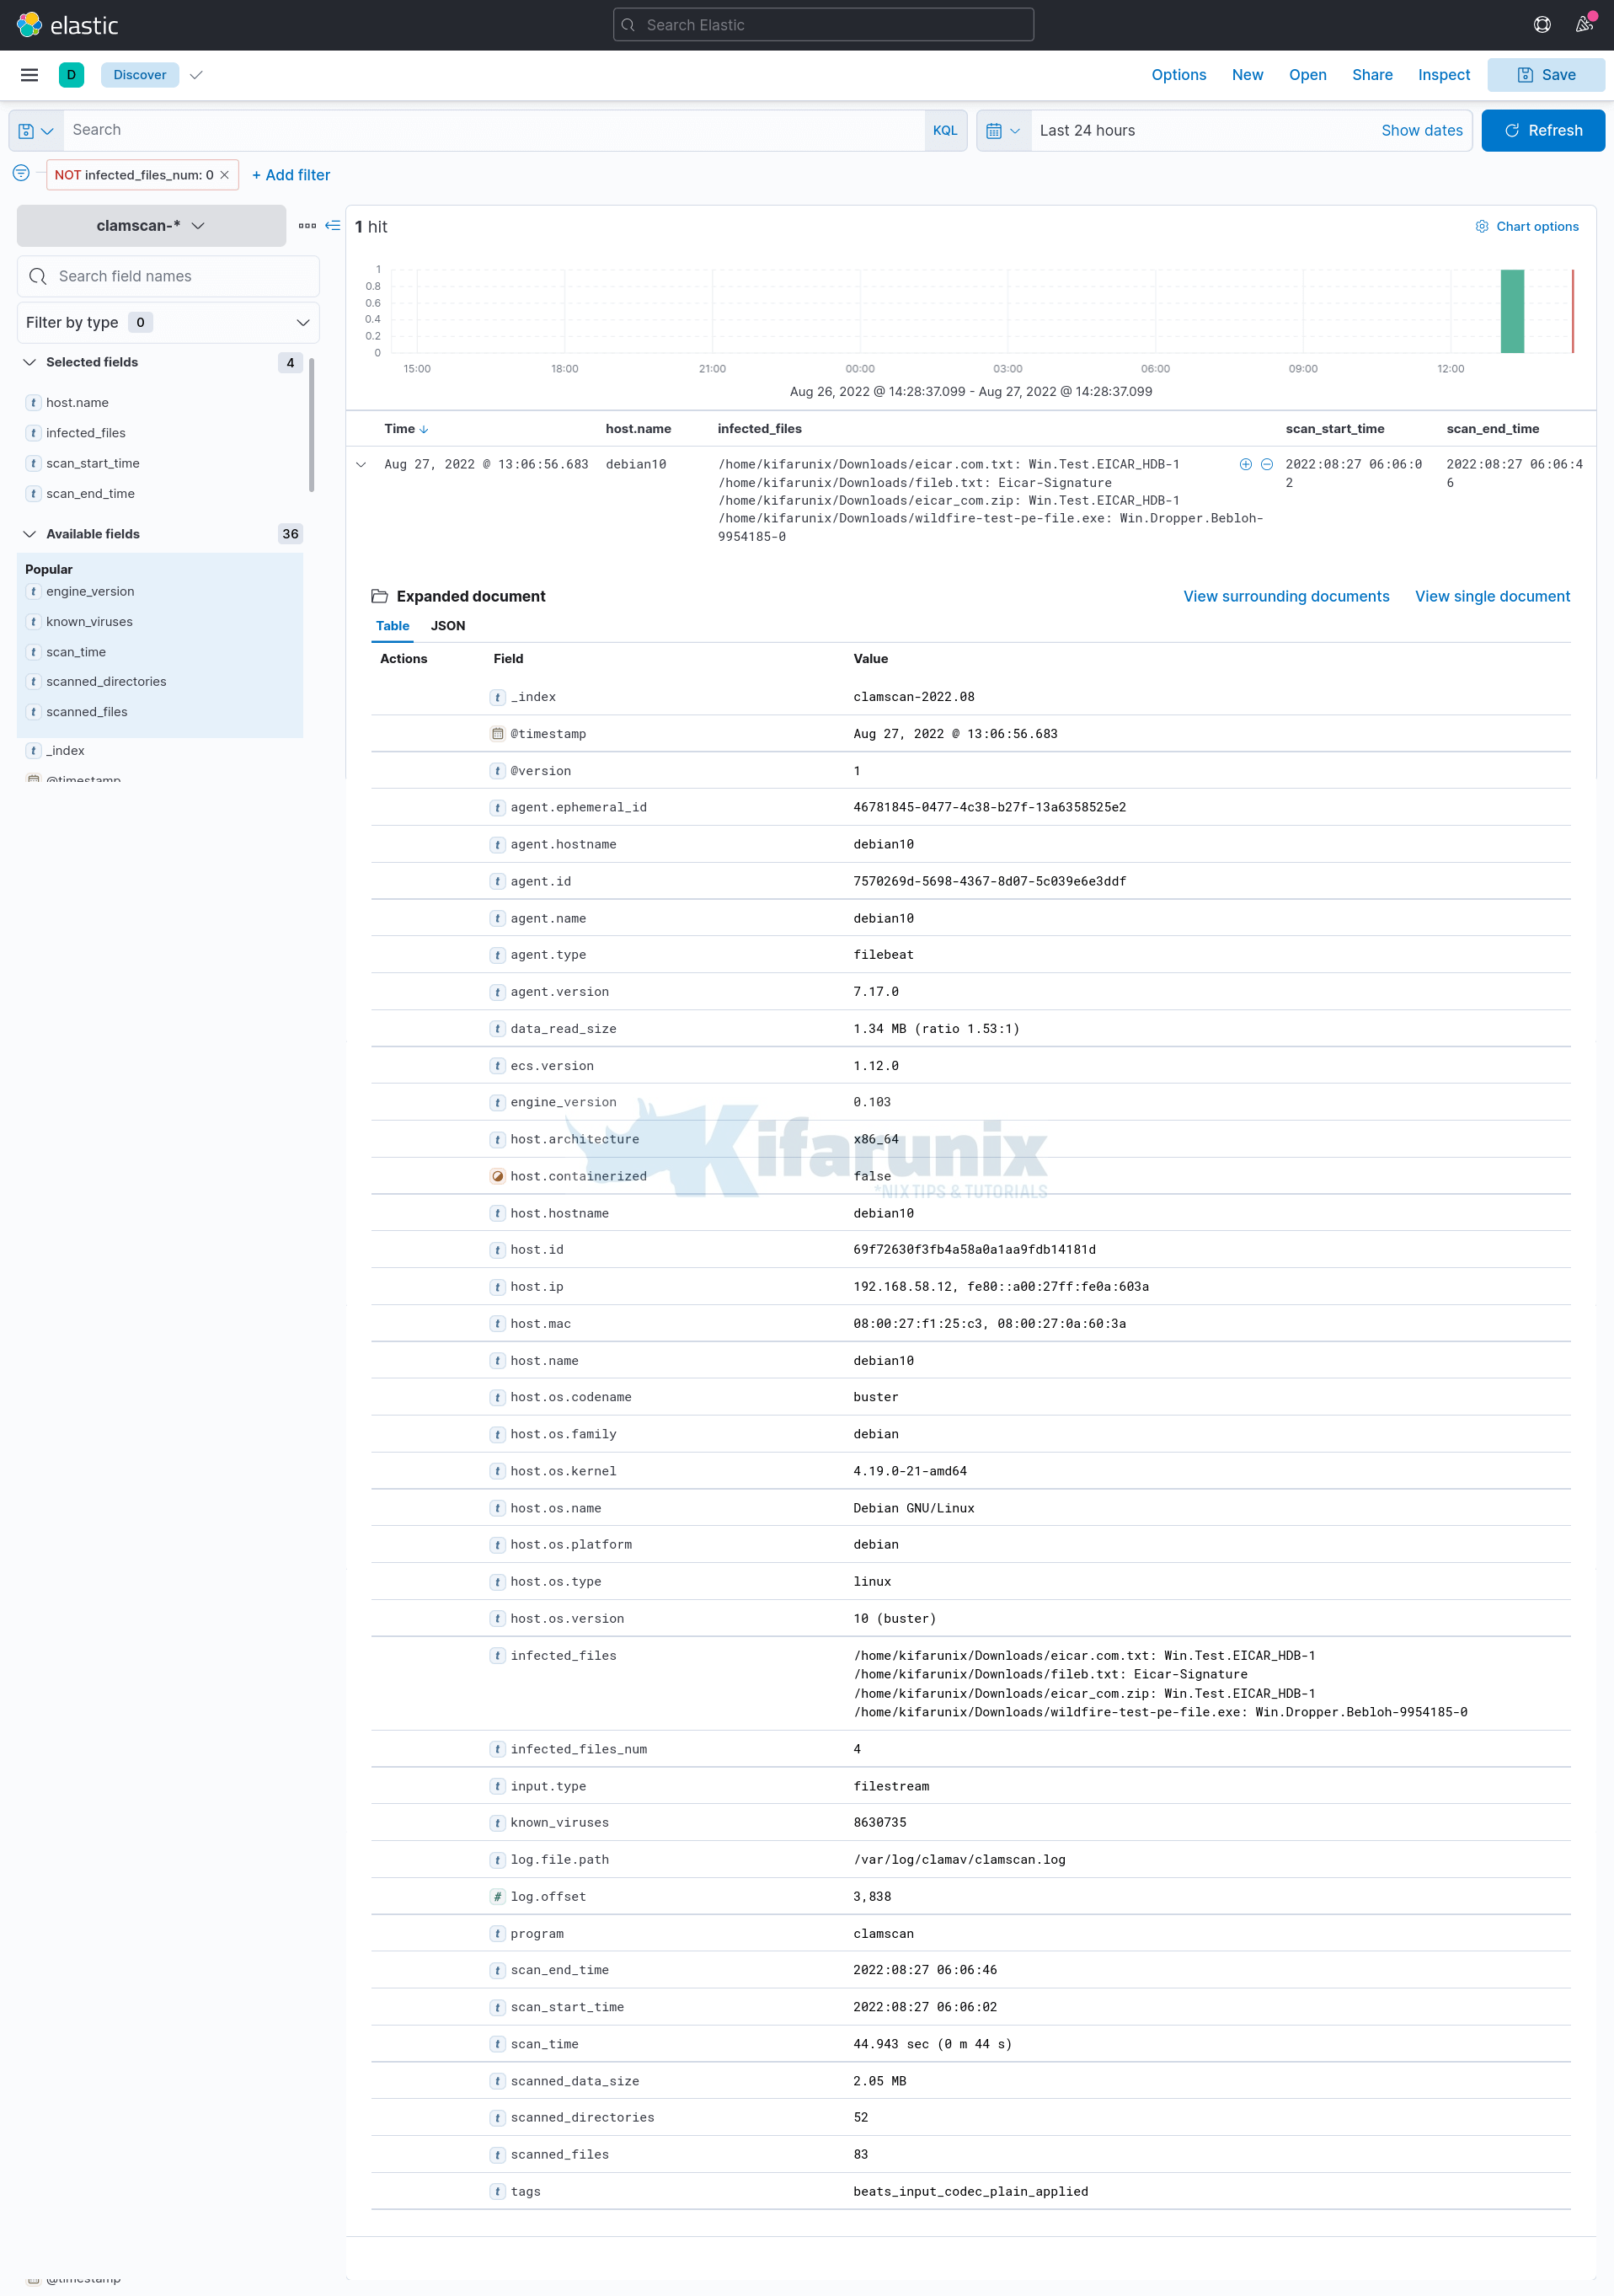
Filtering Events with Infected files found;
Use the filter: infected_files_num is not 0.

Event details;
And that is all on visualizing ClamAV scan logs on ELK stack Kibana.
If you want, you can play around with the formatting of the logs to make it appear the way you want. Otherwise, that is it from us for now.
Other Tutorials

