In this tutorial, you will learn how to install ELK stack 8.x on Ubuntu 24.04/Ubuntu 22.04 systems. Elastic/ELK stack 8.x has been released making it another major version release after Elastic 7.0. Elastic 8.x comes with a lot of improvements including;
- compatibility with 7.x REST API
- security features enabled and configured by default (HTTPS and Authentication)
- Better protection for system indices
- New k-nearest neighbor (kNN) API
- Read more on the Elastic 8.0 release highlights page.
Table of Contents
Install ELK Stack 8.x on Ubuntu 24.04/Ubuntu 22.04
You can run Elastic Stack 8.x as a docker container or run it on your system as a package. We will be installing it as a package in this tutorial.
Set system Hostname
Begin by setting your system hostname;
sudo su -hostnamectl set-hostname elk.kifarunix-demo.comUpdate DNS records locally on hosts file if you don’t have DNS server;
echo "192.168.122.149 elk.kifarunix-demo.com elk" >> /etc/hostsInstall Elastic Stack 8.x Repositories
To install Elastic Stack 8.x on Ubuntu, you need to install Elastic Stack 8.x repositories as follows.
Install Elastic stack 8.x repository signing key.
apt install gnupg2wget -qO - https://artifacts.elastic.co/GPG-KEY-elasticsearch | \
gpg --dearmor -o /etc/apt/trusted.gpg.d/elastic.gpgInstall the Elastic Stack 8.x repository;
echo "deb https://artifacts.elastic.co/packages/8.x/apt stable main" > /etc/apt/sources.list.d/elastic-8.x.listRun system update;
apt updateInstall ELK Stack 8.x
Elastic stack is made up of various opensource tools; Elasticsearch, Logstash, Kibana, and Beats.
In this setup, I will only install the Kibana and Elasticsearch. Since I do not require any special data processing on data, Logstash wont be necessary.
Install Elasticsearch 8.x on Ubuntu
You can install Elasticsearch 8.x automatically from Elastic repos installed above by executing the command below;
apt install elasticsearch -yDuring the installation, the Security features will be enabled by default;
- Authentication and authorization are enabled.
- TLS for the transport and HTTP layers is enabled and configured.
- Elastic super user account (elastic) and its password is created.
Reading package lists... Done
Building dependency tree... Done
Reading state information... Done
The following NEW packages will be installed:
  elasticsearch
0 upgraded, 1 newly installed, 0 to remove and 156 not upgraded.
Need to get 631 MB of archives.
After this operation, 1,317 MB of additional disk space will be used.
Get:1 https://artifacts.elastic.co/packages/8.x/apt stable/main amd64 elasticsearch amd64 8.11.3 [631 MB]
Fetched 65.0 MB in 4s (17.7 MB/s)
Selecting previously unselected package elasticsearch.
(Reading database ... 74004 files and directories currently installed.)
Preparing to unpack .../elasticsearch_8.11.3_amd64.deb ...
Creating elasticsearch group... OK
Creating elasticsearch user... OK
Unpacking elasticsearch (8.11.3) ...
Setting up elasticsearch (8.11.3) ...
--------------------------- Security autoconfiguration information ------------------------------

Authentication and authorization are enabled.
TLS for the transport and HTTP layers is enabled and configured.

The generated password for the elastic built-in superuser is : 57eAxSaLpBWhR465FvzZ

If this node should join an existing cluster, you can reconfigure this with
'/usr/share/elasticsearch/bin/elasticsearch-reconfigure-node --enrollment-token '
after creating an enrollment token on your existing cluster.

You can complete the following actions at any time:

Reset the password of the elastic built-in superuser with
'/usr/share/elasticsearch/bin/elasticsearch-reset-password -u elastic'.

Generate an enrollment token for Kibana instances with
 '/usr/share/elasticsearch/bin/elasticsearch-create-enrollment-token -s kibana'.

Generate an enrollment token for Elasticsearch nodes with
'/usr/share/elasticsearch/bin/elasticsearch-create-enrollment-token -s node'.

-------------------------------------------------------------------------------------------------
### NOT starting on installation, please execute the following statements to configure elasticsearch service to start automatically using systemd
 sudo systemctl daemon-reload
 sudo systemctl enable elasticsearch.service
### You can start elasticsearch service by executing
 sudo systemctl start elasticsearch.service
Scanning processes...
Scanning linux images...

Running kernel seems to be up-to-date.

No services need to be restarted.

No containers need to be restarted.

No user sessions are running outdated binaries.
Configure Elasticsearch 8.x on Ubuntu
Since we are running a basic setup single node cluster, we will go with the default settings.
If you check the Elasticsearch configuration file,/etc/elasticsearch/elasticsearch.yml, you will see the security setting enabled;
#----------------------- BEGIN SECURITY AUTO CONFIGURATION -----------------------
#
# The following settings, TLS certificates, and keys have been automatically
# generated to configure Elasticsearch security features on 11-01-2024 08:08:17
#
# --------------------------------------------------------------------------------

# Enable security features
xpack.security.enabled: true

xpack.security.enrollment.enabled: true

# Enable encryption for HTTP API client connections, such as Kibana, Logstash, and Agents
xpack.security.http.ssl:
  enabled: true
  keystore.path: certs/http.p12

# Enable encryption and mutual authentication between cluster nodes
xpack.security.transport.ssl:
  enabled: true
  verification_mode: certificate
  keystore.path: certs/transport.p12
  truststore.path: certs/transport.p12
# Create a new cluster with the current node only
# Additional nodes can still join the cluster later
cluster.initial_master_nodes: ["elk.kifarunix-demo.com"]

# Allow HTTP API connections from anywhere
# Connections are encrypted and require user authentication
http.host: 0.0.0.0

# Allow other nodes to join the cluster from anywhere
# Connections are encrypted and mutually authenticated
#transport.host: 0.0.0.0

#----------------------- END SECURITY AUTO CONFIGURATION -------------------------
Without comment lines, this is how the default Elasticsearch 8.0 configuration looks like;
grep -Ev '^#|^$' /etc/elasticsearch/elasticsearch.ymlpath.data: /var/lib/elasticsearch
path.logs: /var/log/elasticsearch
xpack.security.enabled: true
xpack.security.enrollment.enabled: true
xpack.security.http.ssl:
enabled: true
keystore.path: certs/http.p12
xpack.security.transport.ssl:
enabled: true
verification_mode: certificate
keystore.path: certs/transport.p12
truststore.path: certs/transport.p12
cluster.initial_master_nodes: ["elk.kifarunix-demo.com"]
http.host: 0.0.0.0
Of course you can update the cluster name, node name, the host and the port details.
Adjust Elasticsearch JVM Settings
Elasticsearch typically configures its JVM heap size automatically based on the node’s roles and total memory. For most production setups, it’s advisable to stick with these default settings.
However, if you need to change the default heap size, you can do so by setting the minimum (Xms) and maximum (Xmx) heap size. It’s important to note that Xms and Xmx should have the same values.
When adjusting the heap size, consider the available RAM. Keep Xms and Xmx below 50% of your total memory.
For example, in our setup, our test server has 8G RAM and we set the heap size is set to 2048M for both maximum and minimum sizes.
echo "-Xms2g
-Xmx2g" > /etc/elasticsearch/jvm.options.d/jvm-heap.options
Update the heap size as per your resource allocated to the system.
That sums up our configurations for Elasticsearch.You can check other Important system configurations.
Running Elasticsearch
Start and enable Elasticsearchto run on system boot;
systemctl daemon-reloadsystemctl enable --now elasticsearchTo check the status;
systemctl status elasticsearch● elasticsearch.service - Elasticsearch
Loaded: loaded (/usr/lib/systemd/system/elasticsearch.service; enabled; preset: enabled)
Active: active (running) since Thu 2024-02-29 05:29:47 UTC; 1s ago
Docs: https://www.elastic.co
Main PID: 2382 (java)
Tasks: 88 (limit: 9407)
Memory: 2.4G (peak: 2.4G)
CPU: 29.772s
CGroup: /system.slice/elasticsearch.service
├─2382 /usr/share/elasticsearch/jdk/bin/java -Xms4m -Xmx64m -XX:+UseSerialGC -Dcli.name=server -Dcli.script=/usr/share/elasticsearch/bin/elasticsearch -Dcli.li>
├─2441 /usr/share/elasticsearch/jdk/bin/java -Des.networkaddress.cache.ttl=60 -Des.networkaddress.cache.negative.ttl=10 -Djava.security.manager=allow -XX:+Alwa>
└─2464 /usr/share/elasticsearch/modules/x-pack-ml/platform/linux-x86_64/bin/controller
Feb 29 05:29:37 elk.kifarunix-demo.com systemd[1]: Starting elasticsearch.service - Elasticsearch...
Feb 29 05:29:38 elk.kifarunix-demo.com systemd-entrypoint[2441]: CompileCommand: exclude org/apache/lucene/util/MSBRadixSorter.computeCommonPrefixLengthAndBuildHistogram bo>
Feb 29 05:29:38 elk.kifarunix-demo.com systemd-entrypoint[2441]: CompileCommand: exclude org/apache/lucene/util/RadixSelector.computeCommonPrefixLengthAndBuildHistogram boo>
Feb 29 05:29:38 elk.kifarunix-demo.com systemd-entrypoint[2382]: Feb 29, 2024 5:29:38 AM sun.util.locale.provider.LocaleProviderAdapter
Feb 29 05:29:38 elk.kifarunix-demo.com systemd-entrypoint[2382]: WARNING: COMPAT locale provider will be removed in a future release
Feb 29 05:29:47 elk.kifarunix-demo.com systemd[1]: Started elasticsearch.service - Elasticsearch.
You can as well verify ES status using curl command. Replace the IP/hostname/domain name accordingly.
curl https://elk.kifarunix-demo.com:9200 --cacert /etc/elasticsearch/certs/http_ca.crt -u elasticWhen prompted, enter the Elasticsearch password generated during installation of Elasticsearch;
The generated password for the elastic built-in superuser is : aHOvDjbr-h1yIQ8dVOEOIf you get such an output, then all is well.
{
  "name" : "elk.kifarunix-demo.com",
  "cluster_name" : "elasticsearch",
  "cluster_uuid" : "Y1Jg3Rn6Rce2HwD8AYXioA",
  "version" : {
    "number" : "8.12.2",
    "build_flavor" : "default",
    "build_type" : "deb",
    "build_hash" : "48a287ab9497e852de30327444b0809e55d46466",
    "build_date" : "2024-02-19T10:04:32.774273190Z",
    "build_snapshot" : false,
    "lucene_version" : "9.9.2",
    "minimum_wire_compatibility_version" : "7.17.0",
    "minimum_index_compatibility_version" : "7.0.0"
  },
  "tagline" : "You Know, for Search"
}
Also, check the ports are opened, both HTTP and transport ports;
ss -altnp | grep -E "9200|9300"LISTEN 0 4096 *:9200 *:* users:(("java",pid=2441,fd=450))
LISTEN 0 4096 [::1]:9300 [::]:* users:(("java",pid=2441,fd=444))
LISTEN 0 4096 [::ffff:127.0.0.1]:9300 *:* users:(("java",pid=2441,fd=445))
Check Elasticsearch Logs
Elasticsearch writes logs under /var/log/elasticsearch path. The logs that you might need to check if there is any issue with your Elasticsearch instance is /var/log/elasticsearch/$CLUSTER_NAME.log.
Where $CLUSTER_NAME is the value of the cluster.name option in the elasticsearch.yaml file. If you didn’t change the value, then it defaults to, elasticsearch and hence, the log file should be, /var/log/elasticsearch/elasticsearch.log
tail -f /var/log/elasticsearch/elasticsearch.logSample logs;
[2024-02-29T05:29:48,645][INFO ][o.e.x.i.a.TransportPutLifecycleAction] [elk.kifarunix-demo.com] adding index lifecycle policy [.fleet-actions-results-ilm-policy]
[2024-02-29T05:29:48,694][INFO ][o.e.x.i.a.TransportPutLifecycleAction] [elk.kifarunix-demo.com] adding index lifecycle policy [.fleet-file-fromhost-meta-ilm-policy]
[2024-02-29T05:29:48,742][INFO ][o.e.x.i.a.TransportPutLifecycleAction] [elk.kifarunix-demo.com] adding index lifecycle policy [.fleet-file-fromhost-data-ilm-policy]
[2024-02-29T05:29:48,795][INFO ][o.e.x.i.a.TransportPutLifecycleAction] [elk.kifarunix-demo.com] adding index lifecycle policy [.fleet-file-tohost-meta-ilm-policy]
[2024-02-29T05:29:48,920][INFO ][o.e.h.n.s.HealthNodeTaskExecutor] [elk.kifarunix-demo.com] Node [{elk.kifarunix-demo.com}{t4ZXgoxGTF2QZB38NAggBg}] is selected as the current health node.
[2024-02-29T05:29:48,988][INFO ][o.e.x.s.a.Realms         ] [elk.kifarunix-demo.com] license mode is [basic], currently licensed security realms are [reserved/reserved,file/default_file,native/default_native]
[2024-02-29T05:29:48,990][INFO ][o.e.l.ClusterStateLicenseService] [elk.kifarunix-demo.com] license [44fc78b6-1189-40d2-8127-153369d4bcd8] mode [basic] - valid
[2024-02-29T05:31:23,055][INFO ][o.e.x.s.s.SecurityIndexManager] [elk.kifarunix-demo.com] security index does not exist, creating [.security-7] with alias [.security]
[2024-02-29T05:31:23,087][INFO ][o.e.c.m.MetadataCreateIndexService] [elk.kifarunix-demo.com] [.security-7] creating index, cause [api], templates [], shards [1]/[0]
[2024-02-29T05:31:23,320][INFO ][o.e.c.r.a.AllocationService] [elk.kifarunix-demo.com] current.health="GREEN" message="Cluster health status changed from [YELLOW] to [GREEN] (reason: [shards started [[.security-7][0]]])." previous.health="YELLOW" reason="shards started [[.security-7][0]]"
Install Kibana 8.x on Ubuntu 24.04/Ubuntu 22.04
Since we already setup Elastic repos, simply install Kibana 8 by running the command;
apt install kibanaBuilding dependency tree
Reading state information... Done
The following NEW packages will be installed:
kibana
0 upgraded, 1 newly installed, 0 to remove and 157 not upgraded.
Need to get 281 MB of archives.
After this operation, 761 MB of additional disk space will be used.
Get:1 https://artifacts.elastic.co/packages/8.x/apt stable/main amd64 kibana amd64 8.0.0 [281 MB]
Fetched 281 MB in 2min 3s (2282 kB/s)
Selecting previously unselected package kibana.
(Reading database ... 71317 files and directories currently installed.)
Preparing to unpack .../kibana_8.0.0_amd64.deb ...
Unpacking kibana (8.0.0) ...
Setting up kibana (8.0.0) ...
Creating kibana group... OK
Creating kibana user... OK
Created Kibana keystore in /etc/kibana/kibana.keystore
Configure Kibana on Ubuntu 24.04/Ubuntu 22.04
Configure Kibana to Listen on Non-Loopback Interface
Kibana is set to run on localhost:5601 by default. To allow external access, edit the configuration file and replace the value of server.host with an interface IP.
vim /etc/kibana/kibana.yml# Kibana is served by a back end server. This setting specifies the port to use.
server.port: 5601
...
# To allow connections from remote users, set this parameter to a non-loopback address.
#server.host: "localhost"
server.host: "192.168.122.149"
Those are the only changes we will make for now since we are just running a basic single node cluster.
Generate Kibana-Elasticsearch Enrollment Token
Enrollment token is required to configure Kibana instance to communicate with an existing Elasticsearch cluster that has security features enabled. You can generate an enrollment token for Kibana using the command below;
/usr/share/elasticsearch/bin/elasticsearch-create-enrollment-token -s kibanaeyJ2ZXIiOiI4LjEyLjIiLCJhZHIiOlsiMTkyLjE2OC4xMjIuMTQ5OjkyMDAiXSwiZmdyIjoiYmRkZDFkYmIwOTRmNjI3NWFmMjEzYjQyYmFjMWYxMzg0NDA4NTJhZTZhMzZmMjY4NzIwZjk1NGRkNjEyNjQ2NCIsImtleSI6ImZoUmQ4NDBCbVp6UGpxN094MmR0OmlYNnBBa3FOU2hTQnVLaFpXbk1ZYmcifQ==Generate Kibana Encryption Keys
Kibana uses encryption keys in several areas, ranging from encrypting data in Kibana associated indices to storing session information. The keys required are:
xpack.encryptedSavedObjects.encryptionKey: Used to encrypt stored objects such as dashboards and visualizationsxpack.reporting.encryptionKey: Used to encrypt saved reportsxpack.security.encryptionKey: Used to encrypt session information
These can be generated using the command below;
/usr/share/kibana/bin/kibana-encryption-keys generatexpack.encryptedSavedObjects.encryptionKey: 706c88e045c127e21b81c902425cdb54
xpack.reporting.encryptionKey: d67296d7d4958bdd1594e965e6b97ab9
xpack.security.encryptionKey: d496d7cb6a5983c213f7902767069744Insert these lines into Kibana config file, kibana.yml.
echo -e "xpack.encryptedSavedObjects.encryptionKey: 706c88e045c127e21b81c902425cdb54
xpack.reporting.encryptionKey: d67296d7d4958bdd1594e965e6b97ab9
xpack.security.encryptionKey: d496d7cb6a5983c213f7902767069744" >> /etc/kibana/kibana.ymlWith all comment lines removed, this is how our Kibana configuration looks like;
grep -Ev '^#|^$' /etc/kibana/kibana.ymlserver.port: 5601
server.host: "192.168.122.149"
elasticsearch.hosts: ["http://localhost:9200"]
logging:
appenders:
file:
type: file
fileName: /var/log/kibana/kibana.log
layout:
type: json
root:
appenders:
- default
- file
pid.file: /run/kibana/kibana.pid
xpack.encryptedSavedObjects.encryptionKey: 706c88e045c127e21b81c902425cdb54
xpack.reporting.encryptionKey: d67296d7d4958bdd1594e965e6b97ab9
xpack.security.encryptionKey: d496d7cb6a5983c213f7902767069744
If you need to secure Kibana 8 by proxying it with Nginx, you can check how to on our previous by following the link below;
Configure Nginx with SSL to Proxy Kibana
Running Kibana
Once the installation is done, start and enable Kibana 8.0 to run on system boot.
systemctl enable --now kibanaConfirm Kibana status;
systemctl status kibana● kibana.service - Kibana
Loaded: loaded (/usr/lib/systemd/system/kibana.service; enabled; preset: enabled)
Active: active (running) since Thu 2024-02-29 05:38:22 UTC; 28s ago
Docs: https://www.elastic.co
Main PID: 2836 (node)
Tasks: 11 (limit: 9407)
Memory: 333.0M (peak: 333.6M)
CPU: 8.274s
CGroup: /system.slice/kibana.service
└─2836 /usr/share/kibana/bin/../node/bin/node /usr/share/kibana/bin/../src/cli/dist
Feb 29 05:38:29 elk.kifarunix-demo.com kibana[2836]: [2024-02-29T05:38:29.241+00:00][INFO ][plugins-service] Plugin "securitySolutionServerless" is disabled.
Feb 29 05:38:29 elk.kifarunix-demo.com kibana[2836]: [2024-02-29T05:38:29.242+00:00][INFO ][plugins-service] Plugin "serverless" is disabled.
Feb 29 05:38:29 elk.kifarunix-demo.com kibana[2836]: [2024-02-29T05:38:29.242+00:00][INFO ][plugins-service] Plugin "serverlessObservability" is disabled.
Feb 29 05:38:29 elk.kifarunix-demo.com kibana[2836]: [2024-02-29T05:38:29.242+00:00][INFO ][plugins-service] Plugin "serverlessSearch" is disabled.
Feb 29 05:38:29 elk.kifarunix-demo.com kibana[2836]: [2024-02-29T05:38:29.576+00:00][INFO ][http.server.Preboot] http server running at http://192.168.122.149:5601
Feb 29 05:38:29 elk.kifarunix-demo.com kibana[2836]: [2024-02-29T05:38:29.686+00:00][INFO ][plugins-system.preboot] Setting up [1] plugins: [interactiveSetup]
Feb 29 05:38:29 elk.kifarunix-demo.com kibana[2836]: [2024-02-29T05:38:29.699+00:00][INFO ][preboot] "interactiveSetup" plugin is holding setup: Validating Elasticsearch co>
Feb 29 05:38:29 elk.kifarunix-demo.com kibana[2836]: [2024-02-29T05:38:29.717+00:00][INFO ][root] Holding setup until preboot stage is completed.
Feb 29 05:38:29 elk.kifarunix-demo.com kibana[2836]: i Kibana has not been configured.
Feb 29 05:38:29 elk.kifarunix-demo.com kibana[2836]: Go to http://192.168.122.149:5601/?code=242398 to get started.
From the status output, you will see such lines;
Kibana has not been configured.Go to http://192.168.122.149:5601/?code=242398 to get started.Use the provided Kibana URL on browser to complete the setup.
Similarly, Kibana logs are available under /var/log/kibana/kibana.log and /var/log/syslog.
Access Kibana 8 Dashboard
You can now access Kibana 8.0 from your browser using the url provided above, http://192.168.122.149:5601/?code=242398. It could be different for you.
If UFW is running, open Kibana port;
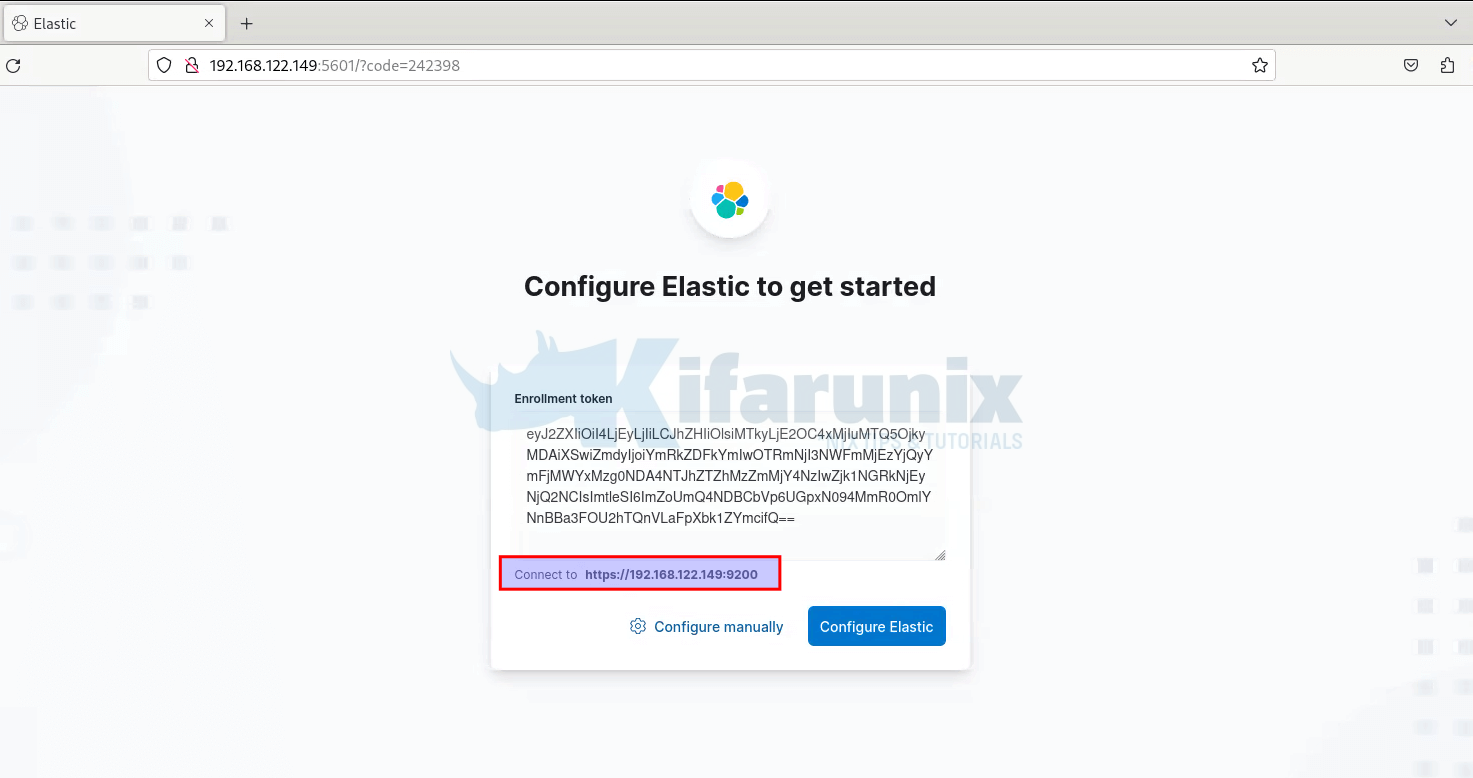
ufw allow 5601/tcpUpon accessing Kibana 8 interface, on the welcome page, you will be required to configure Elastic to get started.
So just copy the Kibana token generated using the /usr/share/elasticsearch/bin/elasticsearch-create-enrollment-token -s kibana, command and paste on the box.

Once you past the token, you will see Kibana automatically connects to Elasticsearch. Thus, click Configure Elastic. This will then save the settings, configure and restart Elasticsearch.

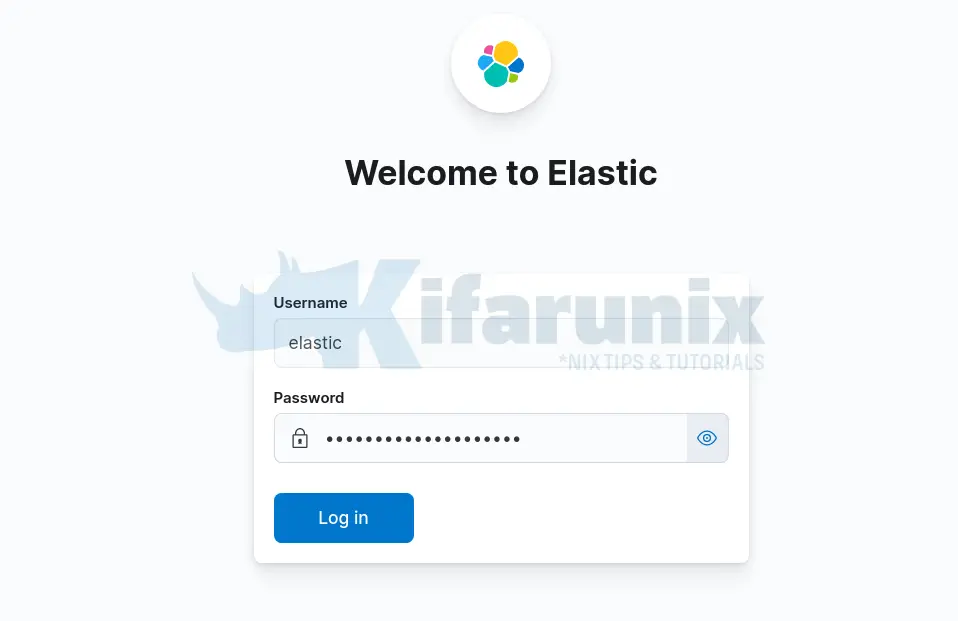
You are then taken to Login page. Login using the generated Elastic user credentials.

On the welcome page, click Explore on my own to proceed to Kibana 8.0 dashboard.

And this is how you can install ELK Stack 8.x. You can now explore further.
How to Install Logstash 8 and Connect it to Elasticsearch 8
If you want to use Logstah to further process your event log, then consider installing Logstash. Follow the link below to access a comprehensive guide on how to install Logstash 8 on Ubuntu/Debian Linux;
Install Logstash 8 on Ubuntu/Debian
Install Filebeat 8
You can also check our sample Filebeat 8 guide;
Install Filebeat 8 on Debian 12
Other Tutorials
Configure Logstash Elasticsearch Basic Authentication


Hi,
After I installed elasticsearch, howcome in elasticsearch.yml I only had http.host: [_local_] not http.host: [_local_, _site_]?
Hi,
Mayby you show how to send syslog via logstash without filebeat because i try but without effect.
Regards,
Adrian
Hi Adrian, you want to sent syslog logs directly to logstash? In the meantime, check about logstash file/syslog input plugin. The team will try to create a tutorial on this. thank
Hi,
Yes, I want to sent syslog to logstash.
I use this:
https://www.elastic.co/guide/en/logstash/current/config-examples.html#_processing_syslog_messages
It’s working but only on localhost, not accept logs with remote servers.
Ok it’s working. My logstash listen on udp 🙂 I change rsyslog in remoete server on udp and is ok. But Your team will try to create a this tutorial, mayby you have better idea.
Glad you got it working!
bruh i need help, how to configure&connect logstash to elasticsearch v8.1.2 , i try sent log via filebeat to logstash success but logstash can’t connect/sent log to elasticsearch.
Thank you
Hi,
i want connect logstash v8.1.2 to elasticsearch 8.1.2 for sent log,
i try sent log to logstash via filebeat success check in tcpdump but logstash fail connect to elastisearch.
cat logstash-plain.log
[2022-04-13T01:38:04,072][INFO ][logstash.runner ] Log4j configuration path used is: /etc/logstash/log4j2.properties
[2022-04-13T01:38:04,099][INFO ][logstash.runner ] Starting Logstash {“logstash.version”=>”8.1.2”, “jruby.version”=>”jruby 9.2.20.1 (2.5.8) 2021-11-30 2a2962fbd1 OpenJDK 64-Bit Server VM 11.0.14.1+1 on 11.0.14.1+1 +indy +jit [linux-x86_64]”}
[2022-04-13T01:38:04,102][INFO ][logstash.runner ] JVM bootstrap flags: [-Xms2g, -Xmx2g, -XX:+UseConcMarkSweepGC, -XX:CMSInitiatingOccupancyFraction=75, -XX:+UseCMSInitiatingOccupancyOnly, -Djava.awt.headless=true, -Dfile.encoding=UTF-8, -Djruby.compile.invokedynamic=true, -Djruby.jit.threshold=0, -Djruby.regexp.interruptible=true, -XX:+HeapDumpOnOutOfMemoryError, -Djava.security.egd=file:/dev/urandom, -Dlog4j2.isThreadContextMapInheritable=true, –add-opens=java.base/java.security=ALL-UNNAMED, –add-opens=java.base/java.io=ALL-UNNAMED, –add-opens=java.base/java.nio.channels=ALL-UNNAMED, –add-opens=java.base/sun.nio.ch=ALL-UNNAMED, –add-opens=java.management/sun.management=ALL-UNNAMED]
[2022-04-13T01:38:06,321][INFO ][logstash.agent ] Successfully started Logstash API endpoint {:port=>9600, :ssl_enabled=>false}
[2022-04-13T01:38:07,318][INFO ][org.reflections.Reflections] Reflections took 193 ms to scan 1 urls, producing 120 keys and 419 values
[2022-04-13T01:38:07,921][WARN ][logstash.outputs.elasticsearch] You are using a deprecated config setting “document_type” set in elasticsearch. Deprecated settings will continue to work, but are scheduled for removal from logstash in the future. Document types are being deprecated in Elasticsearch 6.0, and removed entirely in 7.0. You should avoid this feature If you have any questions about this, please visit the #logstash channel on freenode irc. {:name=>”document_type”, :plugin=>, hosts=>[//10.194.11.67:9200], index=>”%{[@metadata][beat]}-%{+YYYY.MM.dd}”, manage_template=>false, id=>”4ec5c955af0390277662aea57f0df94bf6709a2d8efa7289d3481c6a21df04df”, user=>”elastic”, document_type=>”%{[@metadata][type]}”, enable_metric=>true, codec=>”plain_1229c450-ce33-427a-b841-3f47000aa316″, enable_metric=>true, charset=>”UTF-8″>, workers=>1, ssl_certificate_verification=>true, sniffing=>false, sniffing_delay=>5, timeout=>60, pool_max=>1000, pool_max_per_route=>100, resurrect_delay=>5, validate_after_inactivity=>10000, http_compression=>false, retry_initial_interval=>2, retry_max_interval=>64, data_stream_type=>”logs”, data_stream_dataset=>”generic”, data_stream_namespace=>”default”, data_stream_sync_fields=>true, data_stream_auto_routing=>true, template_overwrite=>false, doc_as_upsert=>false, script_type=>”inline”, script_lang=>”painless”, script_var_name=>”event”, scripted_upsert=>false, retry_on_conflict=>1, ilm_enabled=>”auto”, ilm_pattern=>”{now/d}-000001″, ilm_policy=>”logstash-policy”>}
[2022-04-13T01:38:07,981][INFO ][logstash.javapipeline ] Pipeline `main` is configured with `pipeline.ecs_compatibility: v8` setting. All plugins in this pipeline will default to `ecs_compatibility => v8` unless explicitly configured otherwise.
[2022-04-13T01:38:08,040][INFO ][logstash.outputs.elasticsearch][main] New Elasticsearch output {:class=>”LogStash::Outputs::ElasticSearch”, :hosts=>[“//10.194.11.67:9200″]}
[2022-04-13T01:38:08,474][INFO ][logstash.outputs.elasticsearch][main] Elasticsearch pool URLs updated {:changes=>{:removed=>[], :added=>[http://elastic:[email protected]:9200/]}}
[2022-04-13T01:38:18,785][WARN ][logstash.outputs.elasticsearch][main] Attempted to resurrect connection to dead ES instance, but got an error {:url=>”http://elastic:[email protected]:9200/”, :exception=>LogStash::Outputs::ElasticSearch::HttpClient::Pool::HostUnreachableError, :message=>”Elasticsearch Unreachable: [http://10.194.11.67:9200/][Manticore::ConnectTimeout] Connect to 10.194.11.67:9200 [/10.194.11.67] failed: connect timed out”}
[2022-04-13T01:38:18,839][INFO ][logstash.outputs.elasticsearch][main] Config is not compliant with data streams. `data_stream => auto` resolved to `false`
[2022-04-13T01:38:18,841][WARN ][logstash.outputs.elasticsearch][main] Elasticsearch Output configured with `ecs_compatibility => v8`, which resolved to an UNRELEASED preview of version 8.0.0 of the Elastic Common Schema. Once ECS v8 and an updated release of this plugin are publicly available, you will need to update this plugin to resolve this warning.
[2022-04-13T01:38:18,911][INFO ][logstash.javapipeline ][main] Starting pipeline {:pipeline_id=>”main”, “pipeline.workers”=>2, “pipeline.batch.size”=>125, “pipeline.batch.delay”=>50, “pipeline.max_inflight”=>250, “pipeline.sources”=>[“/etc/logstash/conf.d/beats-input.conf”, “/etc/logstash/conf.d/output-beats.conf”], :thread=>”#”}
[2022-04-13T01:38:19,978][INFO ][logstash.javapipeline ][main] Pipeline Java execution initialization time {“seconds”=>1.06}
[2022-04-13T01:38:20,007][INFO ][logstash.inputs.beats ][main] Starting input listener {:address=>”0.0.0.0:5044”}
[2022-04-13T01:38:20,052][INFO ][logstash.javapipeline ][main] Pipeline started {“pipeline.id”=>”main”}
[2022-04-13T01:38:20,093][INFO ][logstash.agent ] Pipelines running {:count=>1, :running_pipelines=>[:main], :non_running_pipelines=>[]}
[2022-04-13T01:38:20,553][INFO ][org.logstash.beats.Server][main][69a7cc169787e9b27734431cc405cbb3d27be74fbe600b04e1e85e8e43bc4242] Starting server on port: 5044
[2022-04-13T01:38:33,857][WARN ][logstash.outputs.elasticsearch][main] Attempted to resurrect connection to dead ES instance, but got an error {:url=>”http://elastic:[email protected]:9200/”, :exception=>LogStash::Outputs::ElasticSearch::HttpClient::Pool::HostUnreachableError, :message=>”Elasticsearch Unreachable: [http://10.194.11.67:9200/][Manticore::ConnectTimeout] Connect to 10.194.11.67:9200 [/10.194.11.67] failed: connect timed out”}
[2022-04-13T01:38:44,908][WARN ][logstash.outputs.elasticsearch][main] Attempted to resurrect connection to dead ES instance, but got an error {:url=>”http://elastic:[email protected]:9200/”, :exception=>LogStash::Outputs::ElasticSearch::HttpClient::Pool::HostUnreachableError, :message=>”Elasticsearch Unreachable: [http://10.194.11.67:9200/][Manticore::ConnectTimeout] Connect to 10.194.11.67:9200 [/10.194.11.67] failed: connect timed out”}
[2022-04-13T01:38:55,958][WARN ][logstash.outputs.elasticsearch][main] Attempted to resurrect connection to dead ES instance, but got an error {:url=>”http://elastic:[email protected]:9200/”, :exception=>LogStash::Outputs::ElasticSearch::HttpClient::Pool::HostUnreachableError, :message=>”Elasticsearch Unreachable: [http://10.194.11.67:9200/][Manticore::ConnectTimeout] Connect to 10.194.11.67:9200 [/10.194.11.67] failed: connect timed out”}
[2022-04-13T01:39:07,000][WARN ][logstash.outputs.elasticsearch][main] Attempted to resurrect connection to dead ES instance, but got an error {:url=>”http://elastic:[email protected]:9200/”, :exception=>LogStash::Outputs::ElasticSearch::HttpClient::Pool::HostUnreachableError, :message=>”Elasticsearch Unreachable: [http://10.194.11.67:9200/][Manticore::ConnectTimeout] Connect to 10.194.11.67:9200 [/10.194.11.67] failed: connect timed out”}
Regards,
Hello, Seems your Elasticsearch is not reachable, from the logs;
error {:url=>”http://elastic:[email protected]:9200/”, :exception=>LogStash::Outputs::ElasticSearch::HttpClient::Pool::HostUnreachableError, :message=>”Elasticsearch Unreachable: [http://10.194.11.67:9200/][Manticore::ConnectTimeout] Connect to 10.194.11.67:9200 [/10.194.11.67] failed: connect timed out”}Please counter check the port is opened on firewall.
Hi fikri
You remember that from version 8.1.2 elastic run on deafult on ssl in logstash config should by look like:
output {
elasticsearch { hosts => [“https://XXX.XXX.XXX.XXX:9200”]
index => “your-index-ls”
action => “create”
user => “your_user”
password => “your_pass”
cacert => “/your/path/http_ca.crt”
}
I using cert automated genereted via elastic at instalation.
Its work for me.
FYI: The acronym “ELK” stands for “Elasticsearch, Logstash, Kibana”. You’ve created a valuable document that does a great service to those of use that are having issues installing the latest version of the E and the K packages. Without your guidance in this post, I’d be lost. But, where is the L (“Logstash”) part of this deployment?
Hi. You can install Logstash 8 and try to follow the guide this guide Configure Logstash Elasticsearch Basic Authentication see if it can help.