This tutorial will show you how you can easily configure Logstash Elasticsearch Basic authentication. If you have secured your Elasticsearch cluster with authentication/authorization, then for Logstash to be able to publish the events to the Elasticsearch cluster, it must provided valid user credentials that is authorized to publish events to specific indices.
Table of Contents
In our previous guides, we learnt how to enable Filebeat/Elasticsearch authentication. Check the link below;
Configure Filebeat-Elasticsearch Authentication
You may also want to check;
Enable HTTPS Connection Between Elasticsearch Nodes
Easy way to configure Filebeat-Logstash SSL/TLS Connection
Configuring Logstash Elasticsearch Authentication
Create Required Publishing Roles
To configure Logstash Elasticsearch authentication, you first have to create users and assign necessary roles so as to enable Logstash to manage index templates, create indices, and write and delete documents in the indices it creates on Elasticsearch.
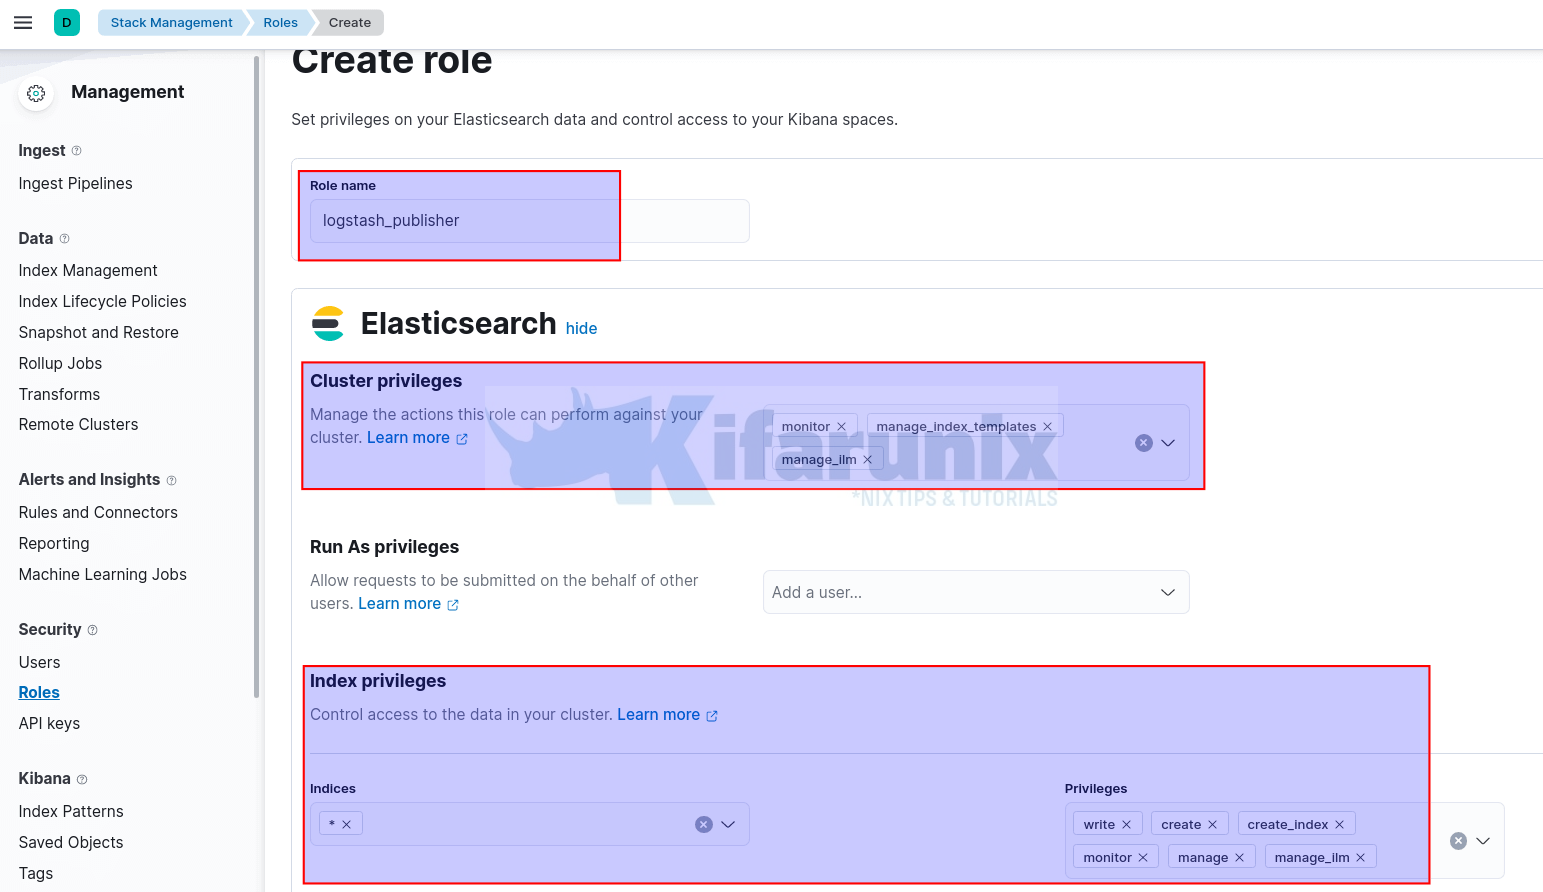
Thus, login to Kibana and navigate Management > Stack Management > Security > Roles to create a publishing role.
On the roles page, click Create role and;
- Set the name of the role, e.g
logstash_publisher. Cluster privileges: If you are running ELK cluster, you need to define the cluster privileges such as;monitor: provides all cluster read-only operations, like cluster health and state, hot threads, node info, node and cluster stats, and pending cluster tasks.manage_index_template: All operations on index templates.manage_ilm: All index lifecycle management operations related to managing policies.- See example cluster privileges on the Security privileges page.
Run As privileges: this defines a user that is allowed to submit requests on behalf of other users. We wont use this in our setup.Index Privileges:- Indices: Select specific index from the list or simply enter the wildcard name of your index (eg logstash-*) and press ENTER.
- We used * (asterisk to specify any index).
- Privileges: Define the privileges that allows a user to publish events on the specific index. Such privileges can include;
monitor: enables the user to retrieve cluster detailscreate_index: enables a user create an index or data stream.create_doc: enables a user to write events into an indexview_index_metadata: enables a user to check for alias when connecting to clusters that support ILM.manage: Allmonitorprivileges plus index and data stream administration (aliases, analyze, cache clear, close, delete, exists, flush, mapping, open, field capabilities, force merge, refresh, settings, search shards, validate query).manage_ilm: gives a user all index lifecycle management operations relating to managing the execution of policies of an index or data stream.
- Read more on Index Privileges page.
- Indices: Select specific index from the list or simply enter the wildcard name of your index (eg logstash-*) and press ENTER.
- If you want to set specific privileges for specific index, then click Add Index privilege and define your index and respective privileges.

- Click Create role once done defining the index/cluster privileges.
Create Indexing User and Assign Respective Roles
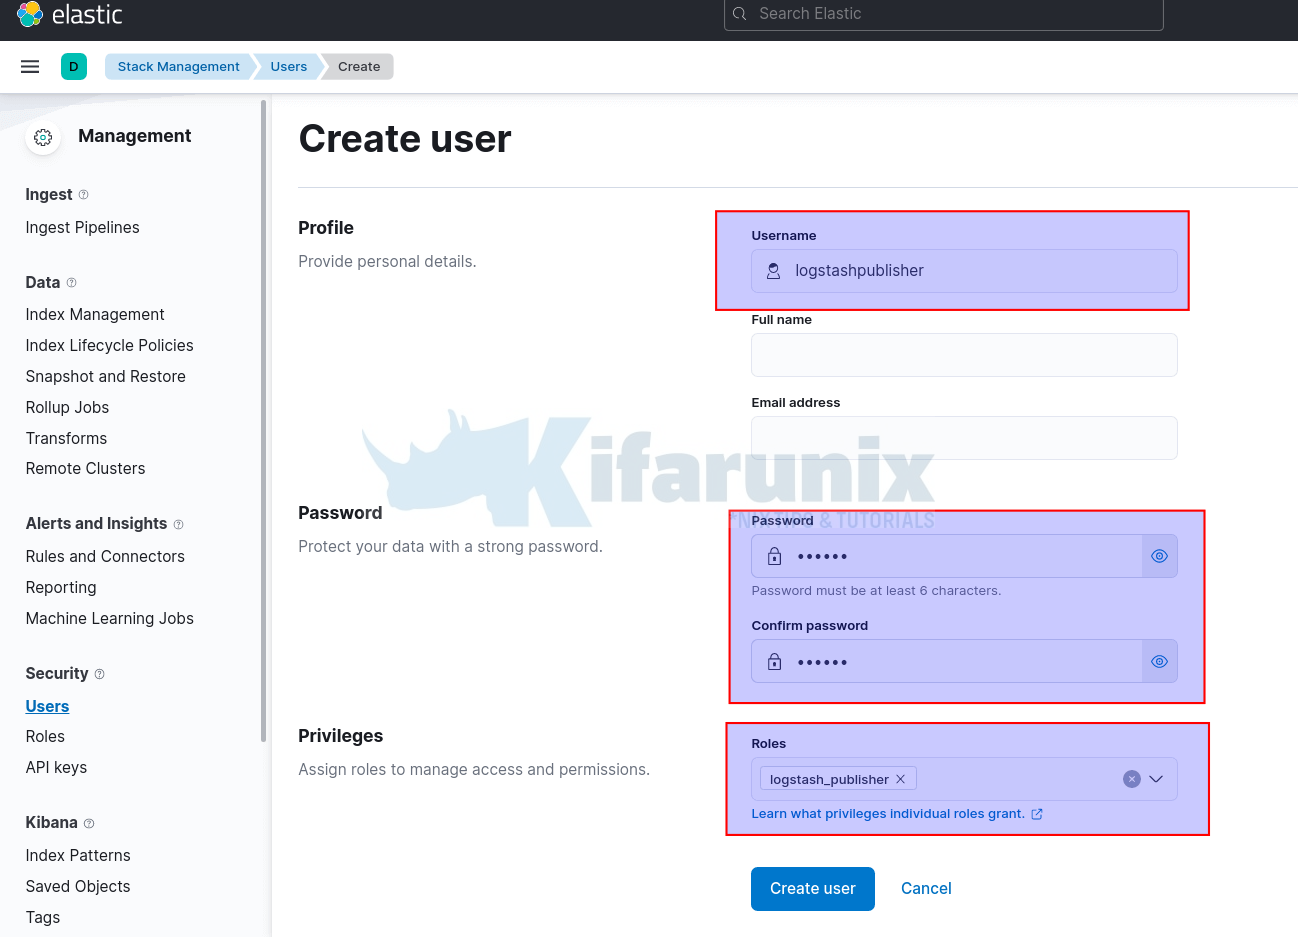
Under Security > Users, click Create user.
- Set the username
- Set the password
- Assign the respective roles, in this example, the role we created is
logstash_publisher.

- Create the User
Install Logstash
If you havent installed Logstash already, you can check these links;
Install and Configure Logstash 7 on Ubuntu 18/Debian 9.8
Install Logstash 7 on Fedora 30/Fedora 29/CentOS 7
Configure Logstash Elasticsearch Authentication
Once you have installed Logstash, you can now configure it to authenticate to Elasticsearch and publish the event data.
Remember while configuring Logstash, you need to define the authentication credentials on the Logstash OUTPUT configuration section.
Our sample Logstash output configuration before defining credentials looks like;
output {
   elasticsearch {
     hosts => ["192.168.0.101:9200"]
     manage_template => false
     index => "ssh_auth-%{+YYYY.MM}"
 }
}
You need to define the username (user) and password (password) on OUTPUT configuration section.
You can define the credentials using two ways;
- Define credentials in plain text, which I dont recommend like as follows;
output {
  elasticsearch {
    hosts => ["192.168.58.22:9200"]
    index => "ssh_auth-%{+YYYY.MM}"
    user => "logstashpublisher"
    password => "P@ssw0rd"
}
}
Create Logstash Keystore. Ensure you password protect the keystore with a different and secured password (replace KSp@ssWOrd with your Keystore password).
set +o history
sudo -u logstash export LOGSTASH_KEYSTORE_PASS=KSp@ssWOrd
set -o history
sudo -E /usr/share/logstash/bin/logstash-keystore --path.settings /etc/logstash createAdd the username and password to Logstash Keystore;
echo logstashpublisher | sudo -E /usr/share/logstash/bin/logstash-keystore --path.settings /etc/logstash add ES_USER --stdinsudo -E /usr/share/logstash/bin/logstash-keystore --path.settings /etc/logstash add ES_PWDDefine the username (user => "${ES_USER}") and password (password => "${ES_PWD}") keystore variables in the configuration file;
output {
  elasticsearch {
    hosts => ["192.168.58.22:9200"]
    index => "ssh_auth-%{+YYYY.MM}"
    user => "${ES_USER}"
    password => "${ES_PWD}"
}
}
Save and exit the file.
You can add the line below;
stdout { codec => rubydebug }To run Logstash in debug mode and print Logstash messages to output console to enable you check if all is well with Elasticsearch authentication.
output {
  elasticsearch {
    hosts => ["192.168.58.22:9200"]
    index => "ssh_auth-%{+YYYY.MM}"
    user => "${ES_USER}"
    password => "${ES_PWD}"
}
stdout { codec => rubydebug }
}
Save and exit the file and run the command below to test the connection;
/usr/share/logstash/bin/logstash -f /etc/logstash/conf.d/ssh.conf --path.settings /etc/logstash/If Logstash starts with no error, you are good.
[2022-01-22T14:08:12,588][INFO ][logstash.outputs.elasticsearch][main] Elasticsearch pool URLs updated {:changes=>{:removed=>[], :added=>[http://logstashpublisher:[email protected]:9200/]}}
[2022-01-22T14:08:13,138][WARN ][logstash.outputs.elasticsearch][main] Restored connection to ES instance {:url=>"http://logstashpublisher:[email protected]:9200/"}
[2022-01-22T14:08:13,153][INFO ][logstash.outputs.elasticsearch][main] Elasticsearch version determined (7.16.3) {:es_version=>7}
[2022-01-22T14:08:13,155][WARN ][logstash.outputs.elasticsearch][main] Detected a 6.x and above cluster: the `type` event field won't be used to determine the document _type {:es_version=>7}
[2022-01-22T14:08:13,263][INFO ][logstash.outputs.elasticsearch][main] Using a default mapping template {:es_version=>7, :ecs_compatibility=>:disabled}
[2022-01-22T14:08:13,550][INFO ][logstash.javapipeline    ][main] Starting pipeline {:pipeline_id=>"main", "pipeline.workers"=>2, "pipeline.batch.size"=>125, "pipeline.batch.delay"=>50, "pipeline.max_inflight"=>250, "pipeline.sources"=>["/etc/logstash/conf.d/ssh.conf"], :thread=>"#"}
[2022-01-22T14:08:16,113][INFO ][logstash.javapipeline    ][main] Pipeline Java execution initialization time {"seconds"=>2.56}
[2022-01-22T14:08:16,128][INFO ][logstash.inputs.beats    ][main] Starting input listener {:address=>"0.0.0.0:5044"}
[2022-01-22T14:08:16,151][INFO ][logstash.javapipeline    ][main] Pipeline started {"pipeline.id"=>"main"}
[2022-01-22T14:08:16,294][INFO ][logstash.agent           ] Pipelines running {:count=>1, :running_pipelines=>[:main], :non_running_pipelines=>[]}
[2022-01-22T14:08:16,448][INFO ][org.logstash.beats.Server][main][46e8e9111d867c0fde54927ebafc819c32b98d7e7881b68995ad8aab81c808bd] Starting server on port: 5044
Otherwise, you will also see the specific error on the output if you run with debug enabled. Also check the Elasticsearch logs to get an idea of what is happening.
And there you go. That is all it takes to configure Logstash to authenticate to Elasticsearch.
You might also need to check at these tutorials.

