In this tutorial, you will learn how to monitor Windows systems using Elastic Osquery manager. The recent versions of Elastic now supports integration with Osquery manager.
With Osquery in Kibana, you can:
- Run live queries for one or more agents
- Schedule query packs to capture changes to OS state over time
- View a history of past queries and their results
- Save queries and build a library of queries for specific use cases
Monitoring Windows Systems using Elastic Osquery Manager
Note that we are using Windows 10 in this setup.
Setup Fleet Manager on Elastic Stack
We discussed how you can setup Elastic Fleet Manager in our previous tutorial on how to Ship System Logs to ELK Stack using Elastic Agents.
Integrate Osquery Manager with ELK Stack
Once you have setup Fleet Manager, integrate Osquery manager to Elastic stack.
Integrate Osquery Manager with ELK Stack
Ensure that the agent policy that you will enroll the Windows agent to DOES NOT have Fleet Manager Integration.
In our setup for example, we will enroll our agents to a Default Policy with System and Osquery manager integrations;

Download Elastic Agent Installer for Windows Systems
Depending on the current version of your Elastic stack, download the version of Elastic agent that matches your current version of Elastic stack to your Windows system
In this setup, for example, we are running Elastic Stack 7.17.0. Hence, we have downloaded Elastic Agent 7.17.0 for our Windows system.
You can simply grab the download link and pull it using PowerShell.
Open and run PowerShell as administrator;
cd C:\Users\<username>\DownloadsInvoke-WebRequest -Uri "https://artifacts.elastic.co/downloads/beats/elastic-agent/elastic-agent-7.17.0-windows-x86_64.zip" -OutFile elastic-agent-7.17.0-windows-x86_64.zipExtract the Archive
Expand-Archive -Path .\elastic-agent-7.17.0-windows-x86_64.zip -DestinationPath .Add Windows Elastic Agent to Fleet Manager
In order to collect data from your Windows hosts and sent it Elastic stack, you need to add the Windows host to the Fleet manager.
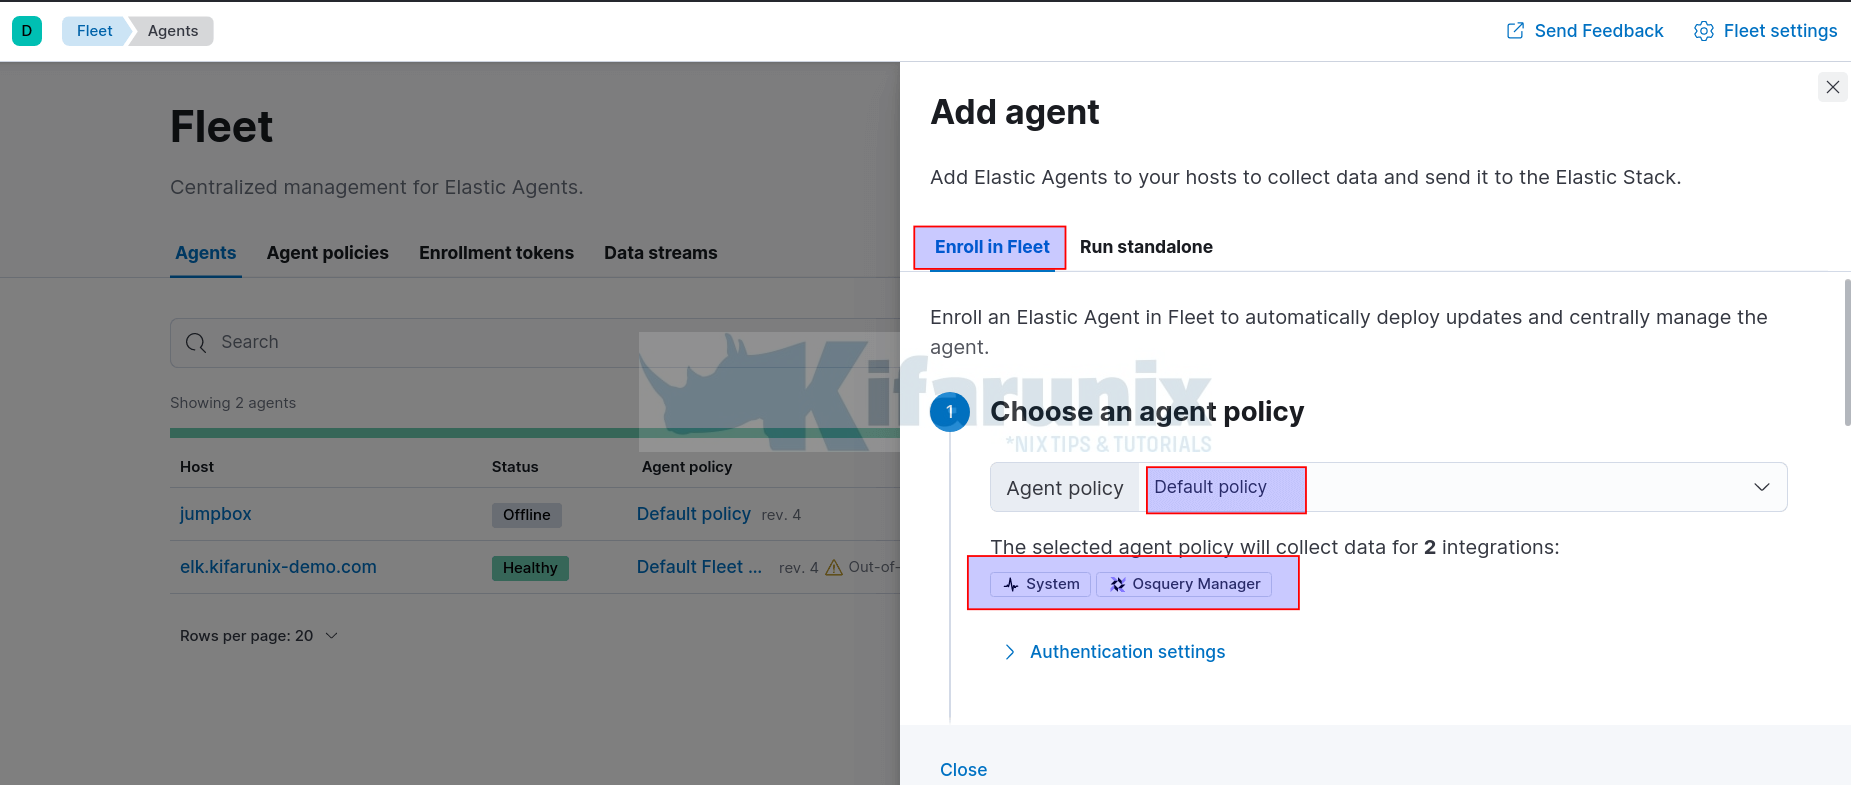
- Thus, navigate to Kibana > Management > Fleet > Agents. Click Add agent.
- On the Add agent wizard, click Enroll in Fleet. this option enables you to automatically deploy updates and centrally manage the agent from the Fleet manager.
- Next, choose an agent policy to tie an agent to. In this setup, we will use Default Fleet policy (which already has two integrations enabled; System, Osquery Manager). NOTE that this policy doesn’t have Fleet manager integration.
- The System integration enables automatic installation of Filebeat and Metricbeat on the remote agent host.
- The Osquery integration enables automatic deployment of osquerybeat on the remote agent host.
- Next, download the Elastic agent installer to the Windows system. We have already downloaded the Elastic agent installer in the step above, hence pass.
- Enroll and start the Elastic Agent.
- Select Windows and copy the agent Install/Enroll command generated.
- Example Elastic agent install command in my case;
- NOTE: If you chose Quick start deployment option, ensure you add the
--insecureflag to the install/enroll command.
.\elastic-agent.exe install `
--url=http://192.168.58.22:8220 `
--enrollment-token=WXM4YnhuNEJ5Z29oREY1bTNidTY6UlJsNEk1WTNSeVdkRndtWlBnTk5kZw== `
--insecure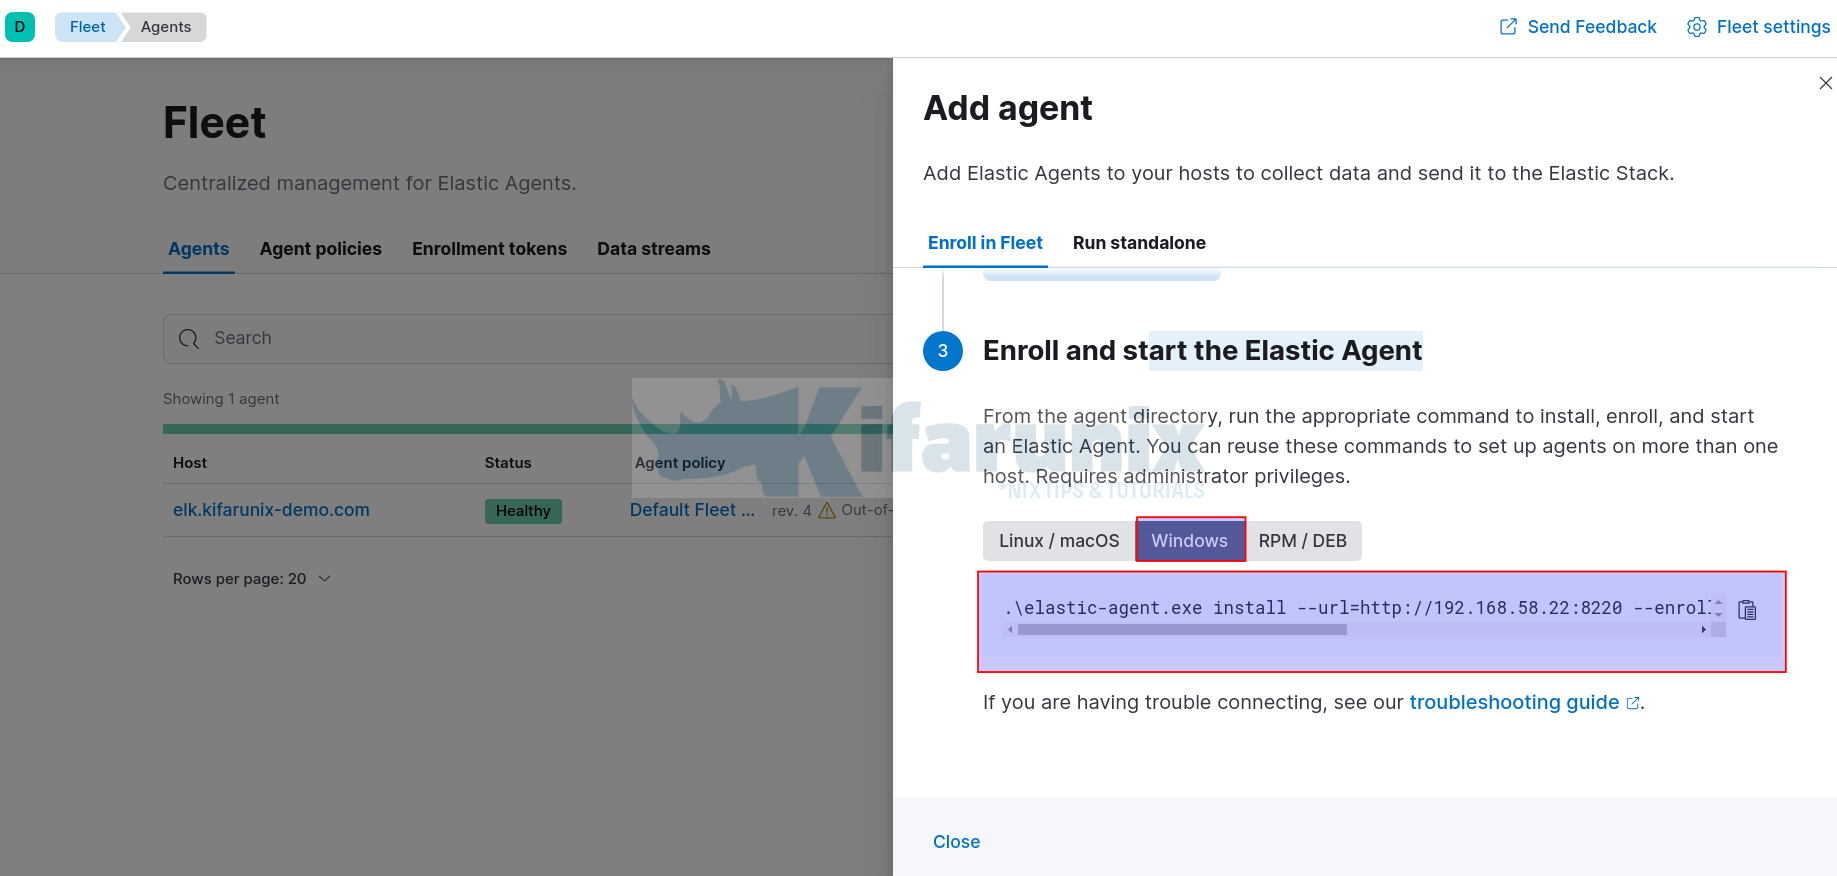
Install Elastic Agents in Windows system and Enroll it to Fleet Manager
- Next, login into the Windows system you are deploying an Elastic agent on.
- Launch PowerShell as administrative user.
- Navigate to the folder where you extracted your Elastic agent installer archive and futher navigate to the folder containing the Elastic agent binary installer,
elastic-agent.exe.
cd C:\Users\kifarunix\Downloads\elastic-agent-7.17.0-windows-x86_64\elastic-agent-7.17.0-windows-x86_64ls Directory: C:\Users\kifarunix\Downloads\elastic-agent-7.17.0-windows-x86_64\elastic-agent-7.17.0-windows-x86_64
Mode LastWriteTime Length Name
---- ------------- ------ ----
d----- 13/12/2021 7:04 PM data
------ 13/12/2021 9:48 PM 41 .build_hash.txt
------ 13/12/2021 9:48 PM 41 .elastic-agent.active.commit
------ 13/12/2021 9:48 PM 45319640 elastic-agent.exe
------ 13/12/2021 9:48 PM 9243 elastic-agent.reference.yml
------ 13/12/2021 9:48 PM 9240 elastic-agent.yml
------ 13/12/2021 9:48 PM 13675 LICENSE.txt
------ 13/12/2021 9:48 PM 1964303 NOTICE.txt
------ 13/12/2021 9:48 PM 863 README.md
- Execute the command below to install and enroll Elastic agent to Fleet manager on Elastic stack.
.\elastic-agent.exe install `
--url=https://192.168.58.22:8220 `
--enrollment-token=WXM4YnhuNEJ5Z29oREY1bTNidTY6UlJsNEk1WTNSeVdkRndtWlBnTk5kZw== `
--insecure
- When prompted on whether to run as a service, accept it and proceed with Elastic agent installation on Windows systems.
- Sample Elastic agent installation output on Windows system;
Elastic Agent will be installed at C:\Program Files\Elastic\Agent and will run as a service. Do you want to continue? [Y
/n]:y
2021-12-13T20:05:25.219+0300    WARN    [tls]   tlscommon/tls_config.go:98      SSL/TLS verifications disabled.
2021-12-13T20:05:25.653+0300    INFO    cmd/enroll_cmd.go:442   Starting enrollment to URL: https://192.168.58.22:8220/
2021-12-13T20:05:26.464+0300    WARN    [tls]   tlscommon/tls_config.go:98      SSL/TLS verifications disabled.
2021-12-13T20:06:03.501+0300    INFO    cmd/enroll_cmd.go:250   Successfully triggered restart on running Elastic Agent.
Successfully enrolled the Elastic Agent.
Elastic Agent has been successfully installed.
- The agent is installed under
C:\Program Files\Elastic\Agent. - The command creates Elastic agent service. (You can also check form services UI).
Get-Service | Where Name -like *Elastic*Status Name DisplayName
------ ---- -----------
Running Elastic Agent Elastic Agent- As already mention, with System and Osquery manager integrations enabled, the Filebeat, Metricbeat and Osquerybeats and their respective configuration files are installed on the agent host. The configuration files are (listing on PowerShell):
ls 'C:\Program Files\Elastic\Agent\data\elastic-agent-93708b\install\*\*beat.yml' Directory: C:\Program Files\Elastic\Agent\data\elastic-agent-93708b\install\filebeat-7.17.0-windows-x86_64
Mode LastWriteTime Length Name
---- ------------- ------ ----
-a---- 13/12/2021 12:13 AM 8273 filebeat.yml
Directory: C:\Program Files\Elastic\Agent\data\elastic-agent-93708b\install\metricbeat-7.17.0-windows-x86_64
Mode LastWriteTime Length Name
---- ------------- ------ ----
-a---- 13/12/2021 12:08 AM 6899 metricbeat.yml
Directory: C:\Program Files\Elastic\Agent\data\elastic-agent-93708b\install\osquerybeat-7.17.0-windows-x86_64
Mode LastWriteTime Length Name
---- ------------- ------ ----
-a---- 13/12/2021 12:11 AM 6504 osquerybeat.yml
- For these beats to connect and sent logs to Elasticsearch, you need to edit their configuration files and define the Elasticsearch host as well the authentication credentials.
- Stop Elastic Agent Service;
Stop-Service -Name 'Elastic Agent'- Then edit the
filebeat.yml,metricbeat.ymlandosquerybeat.ymland change these configs from;
# ---------------------------- Elasticsearch Output ----------------------------
output.elasticsearch:
  # Array of hosts to connect to.
  hosts: ["localhost:9200"]

  # Protocol - either `http` (default) or `https`.
  #protocol: "https"

  # Authentication credentials - either API key or username/password.
  #api_key: "id:api_key"
  #username: "elastic"
  #password: "changeme"
To
# ---------------------------- Elasticsearch Output ----------------------------
output.elasticsearch:
  # Array of hosts to connect to.
  hosts: ["192.168.58.22:9200"]

  # Protocol - either `http` (default) or `https`.
  #protocol: "https"

  # Authentication credentials - either API key or username/password.
  #api_key: "id:api_key"
  username: "elastic"
  password: "password"
Be sure to set the proper Elasticsearch IP as well the credentials for a user with the proper permissions.
- Restart Elastic Agent once you are done making the changes;
Restart-Service -Name 'Elastic Agent'Verifying Windows Agent Status on Fleet manager
Once the agent has been successfully enrolled, log in to Kibana and check agent status under Fleet agents.
The agent status could be Updating or if it has updated and started the communications with the Fleet server, then you should see status Healthy.
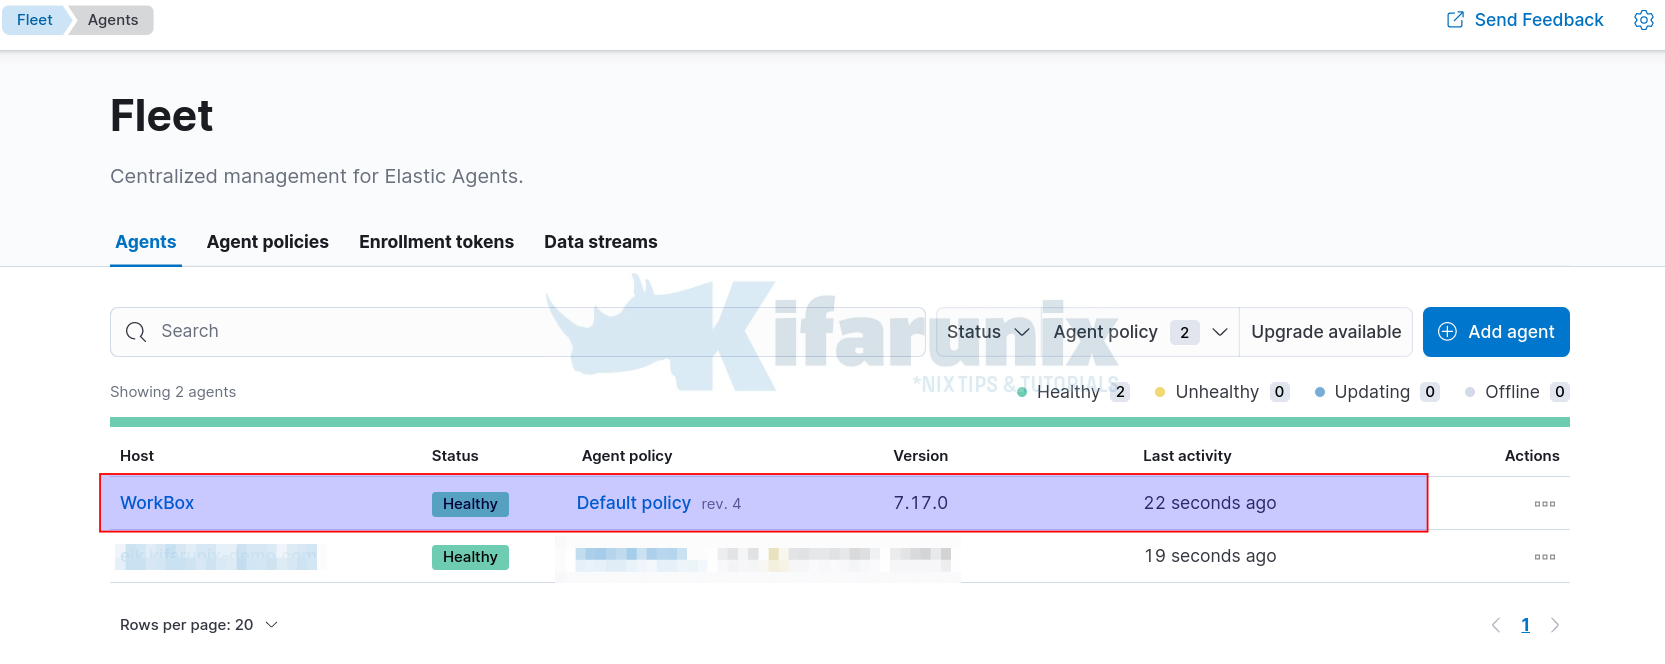
And there you go. You can click on the agent name to view the related logs;
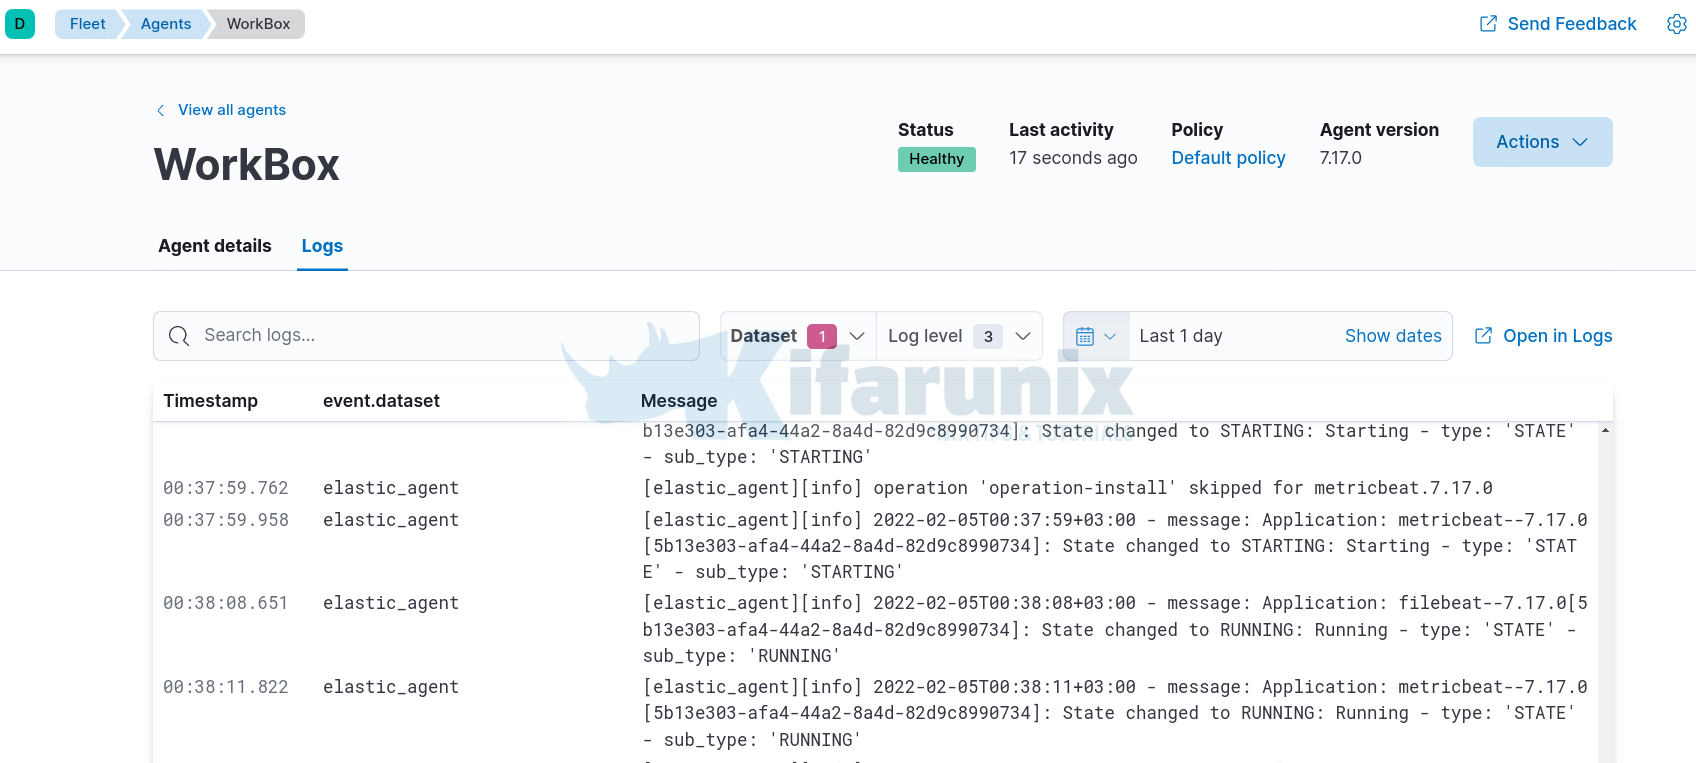
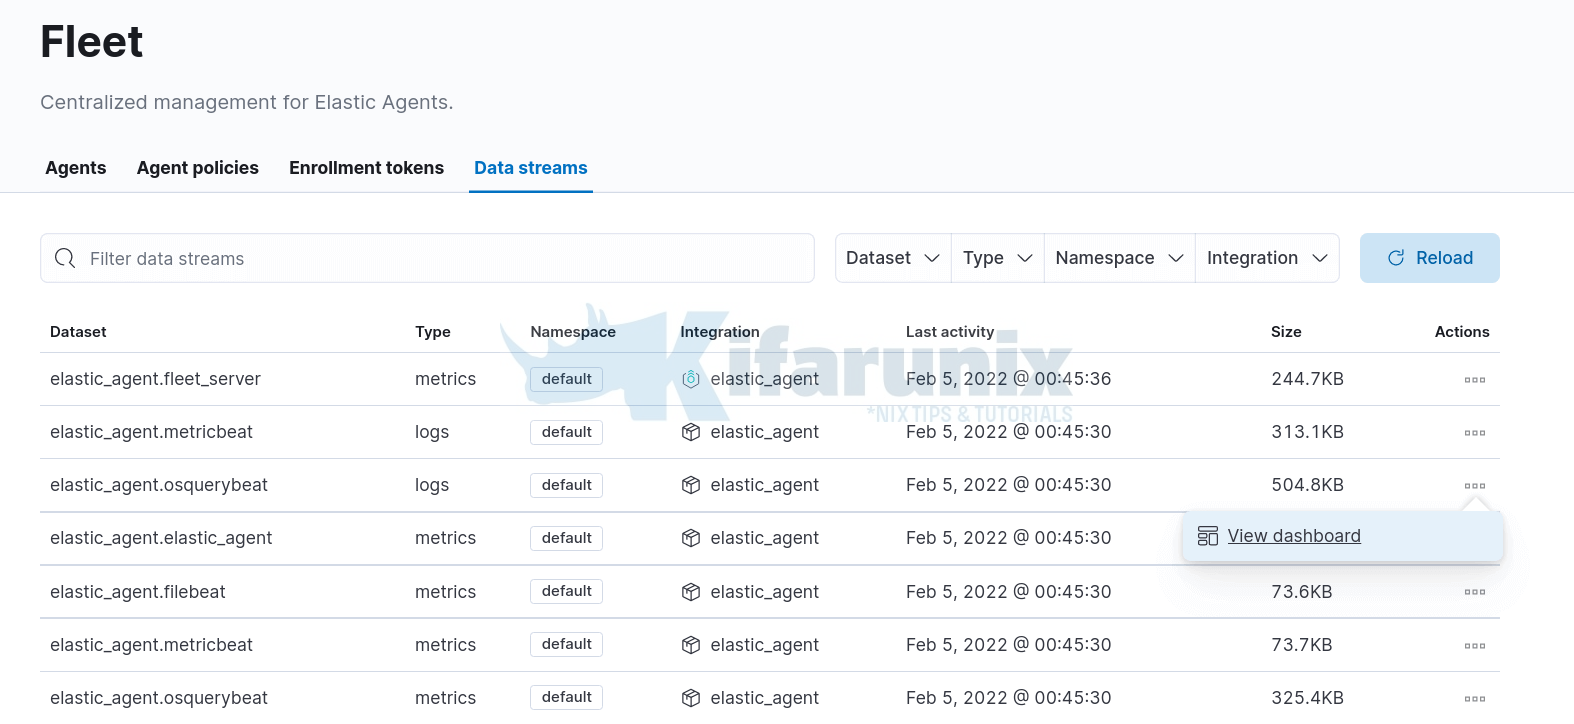
You can also check the dashboards for various event activity under Data Streams.
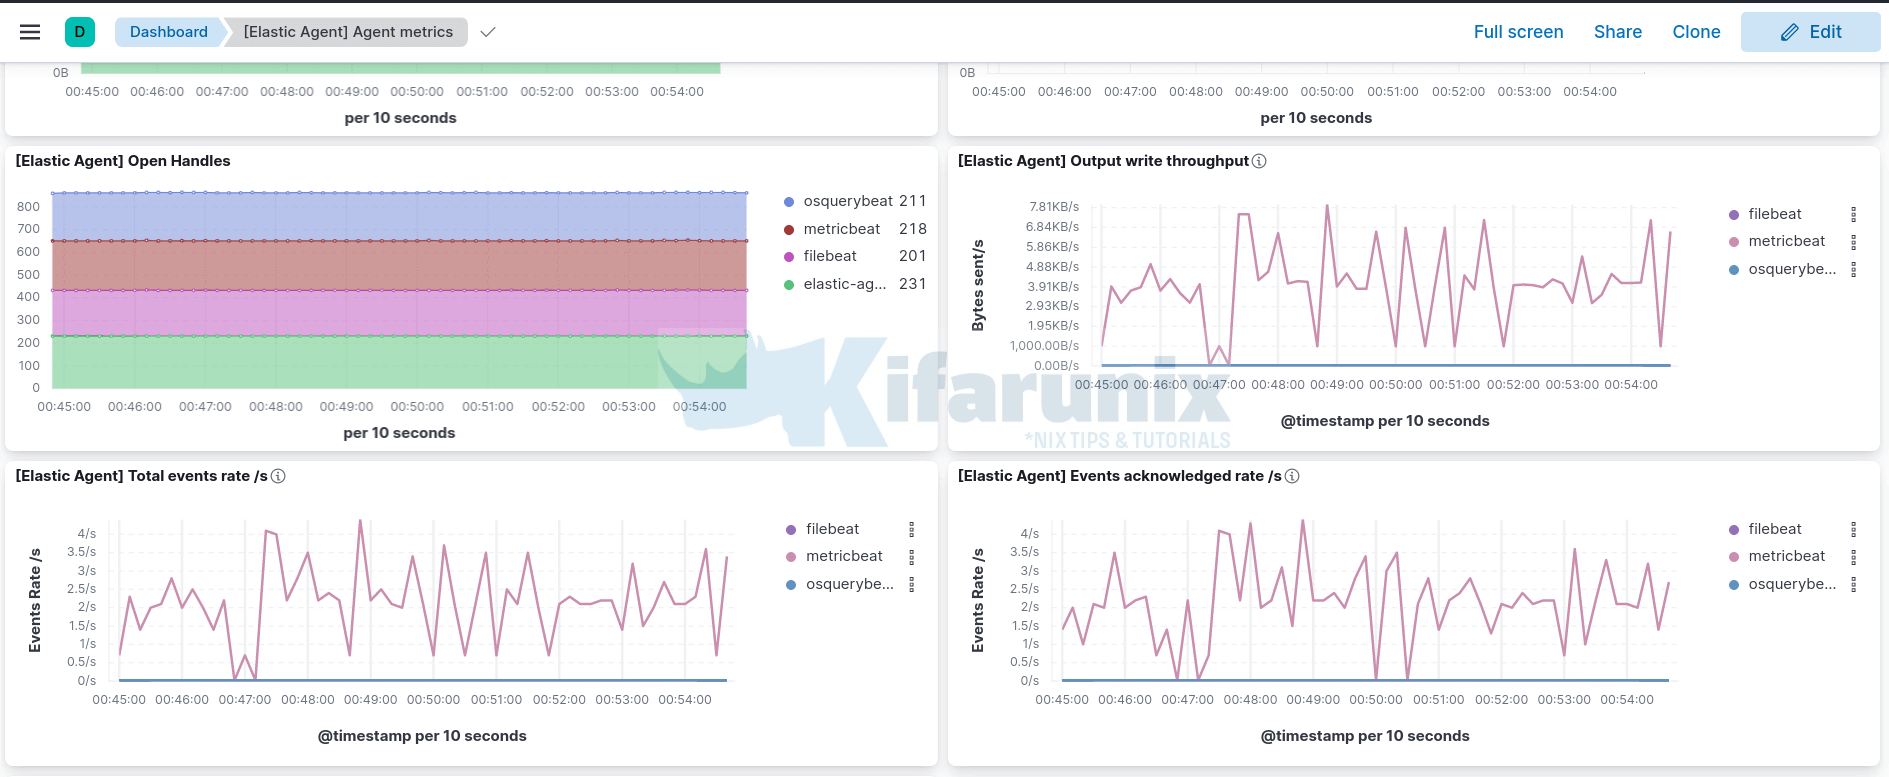
Sample metrics dashboard.
Querying Windows Agent using Osquery on ELK
Similarly, from Osquery integration, you should be able to run live queries against your Windows host agent.
Thus;
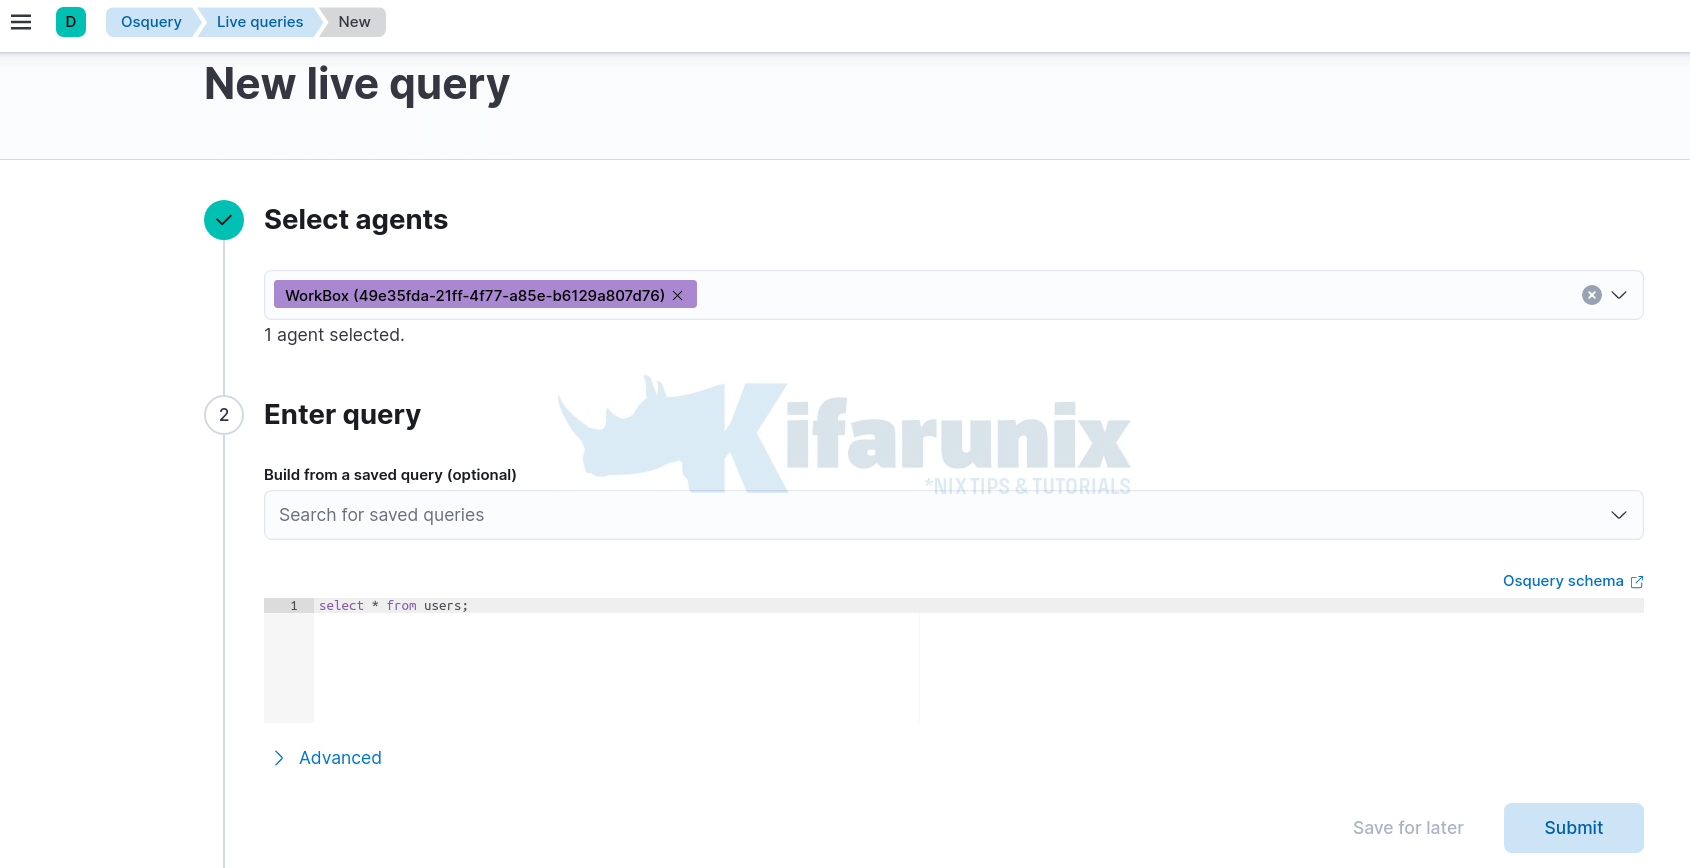
- Navigate to Kibana Management > Osquery > +New live query.
- Select the agent to query > Enter a query > Submit the query. You can also save the query to use later.
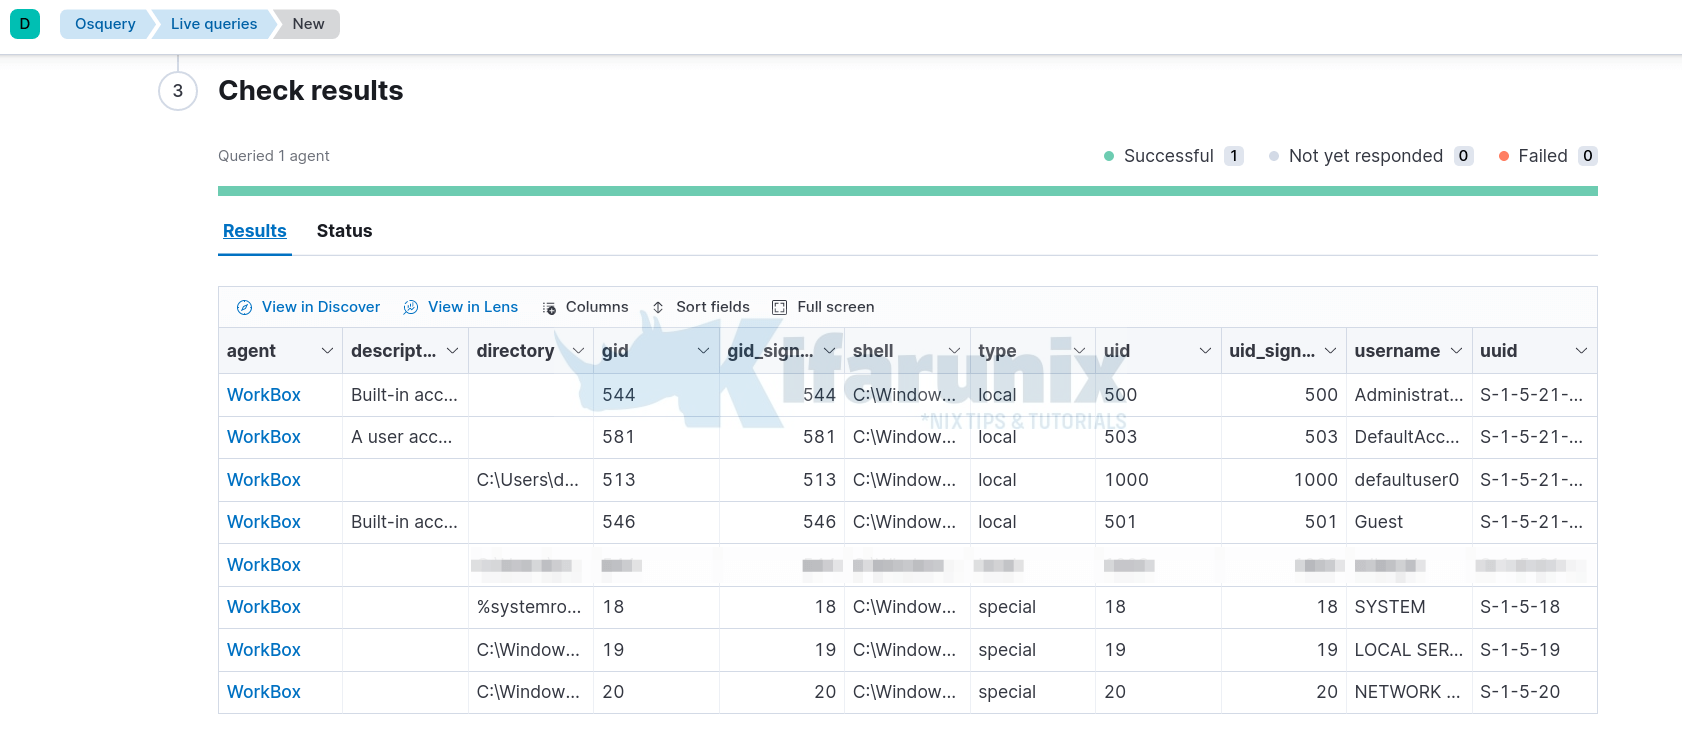
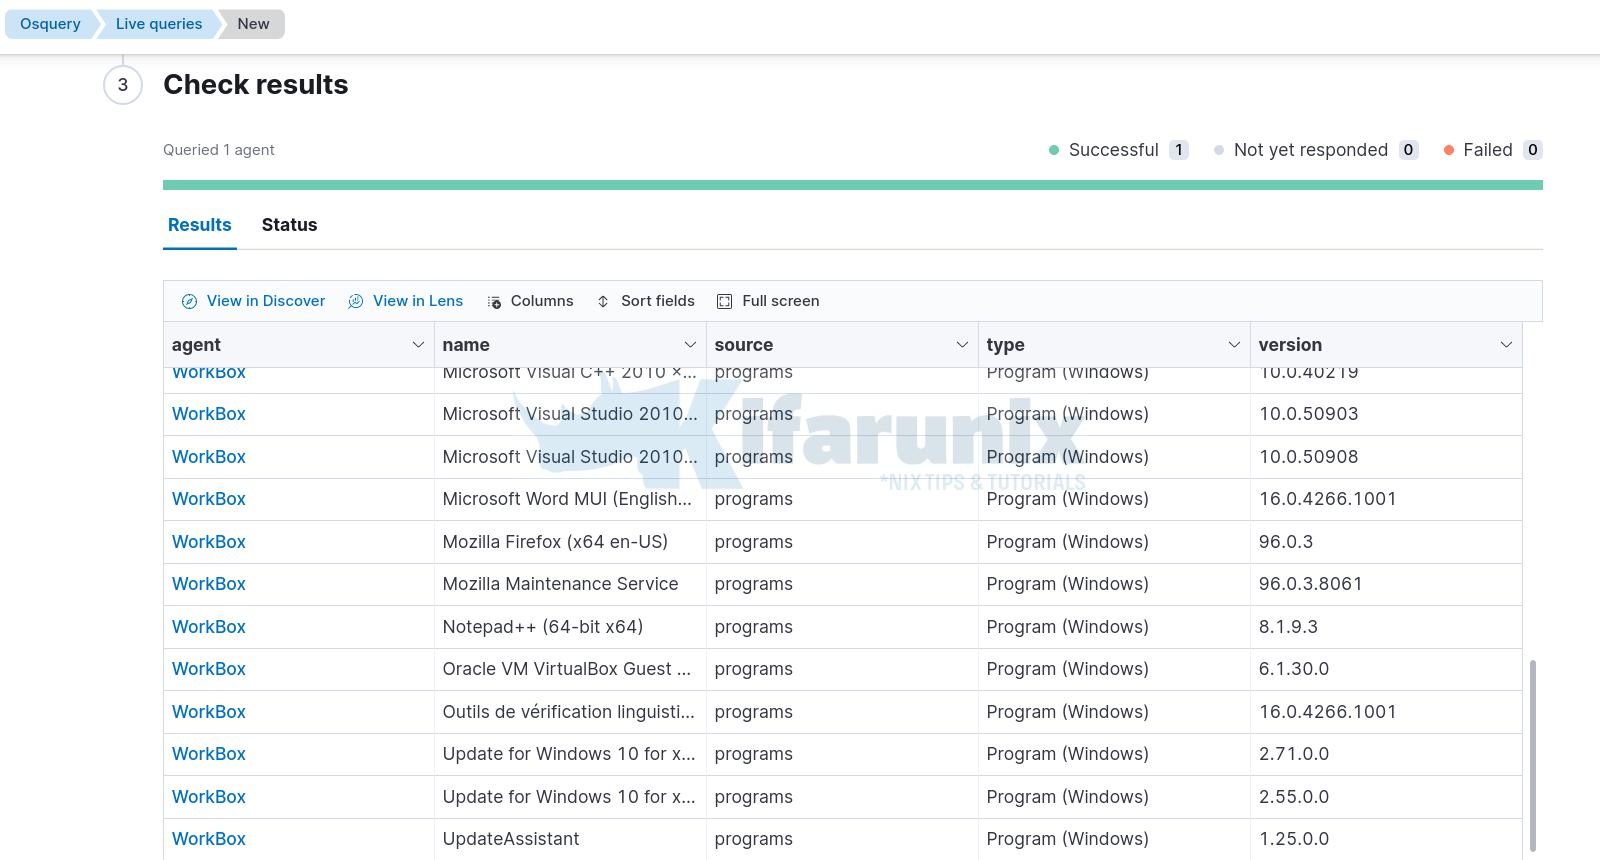
- Check the query Results and Status.
- You can run other queries like getting installed softwares;
SELECT name AS name, version AS version, 'Program (Windows)' AS type, 'programs' AS source FROM programs UNION SELECT name AS name, version AS version, 'Package (Python)' AS type, 'python_packages' AS source FROM python_packages UNION SELECT name AS name, version AS version, 'Browser plugin (IE)' AS type, 'ie_extensions' AS source FROM ie_extensions UNION SELECT name AS name, version AS version, 'Browser plugin (Chrome)' AS type, 'chrome_extensions' AS source FROM chrome_extensions UNION SELECT name AS name, version AS version, 'Browser plugin (Firefox)' AS type, 'firefox_addons' AS source FROM firefox_addons UNION SELECT name AS name, version AS version, 'Package (Chocolatey)' AS type, 'chocolatey_packages' AS source FROM chocolatey_packages UNION SELECT name AS name, version AS version, 'Package (Atom)' AS type, 'atom_packages' AS source FROM atom_packages;
- You can check more Osquery queries on the Fleetdm Queries page.
That marks the end of our tutorial.
Reference
Other Tutorials
Configure Logstash Elasticsearch Basic Authentication

