In this tutorial, we are going to learn how to integrate ELK stack with TheHive. ELK Stack can be configured to sent event alerts to TheHive case management system. This enables security personnel to create, investigate and follow up on various incidents or cases.
Table of Contents
How to Integrate ELK Stack with TheHive
In order to integrate ELK stack with TheHive, proceed as follows;
Install ELK Stack
Follow the link below to learn how t install ELK Stack;
Install and Configure ELK Stack
Install TheHive
You can check the guide below on how to install TheHive;
Configure ELK Stack Alerting Via ElastAlert
“ElastAlert is a simple framework for alerting on anomalies, spikes, or other patterns of interest from data in Elasticsearch”.
In our previous guide, we learnt how to Configure ELK Stack Alerting with ElastAlert.
Configure ELK Stack to Sent Alerts to TheHive
Based on the guide above on how to configure ELK stack alerting with ElastAlert, you need to configure ElastAlert to sent alerts to TheHive.
ElastAlert can be configured to read specific Elasticsearch indices and check for specific events based on the defined query conditions. When those conditions are true, it can sent alerts, via the theHive alert type, to TheHive.
Create Organization and Administrative User on TheHive
To begin with, login to TheHive web interface as admin user and create your organization and an administrative user for that account, if you have not done so already.
Follow the links below to learn how to create TheHive organization and an administrative user for that organization.
Creating an Organization on TheHive
Create TheHive Organization Administrative User
Create TheHive API User
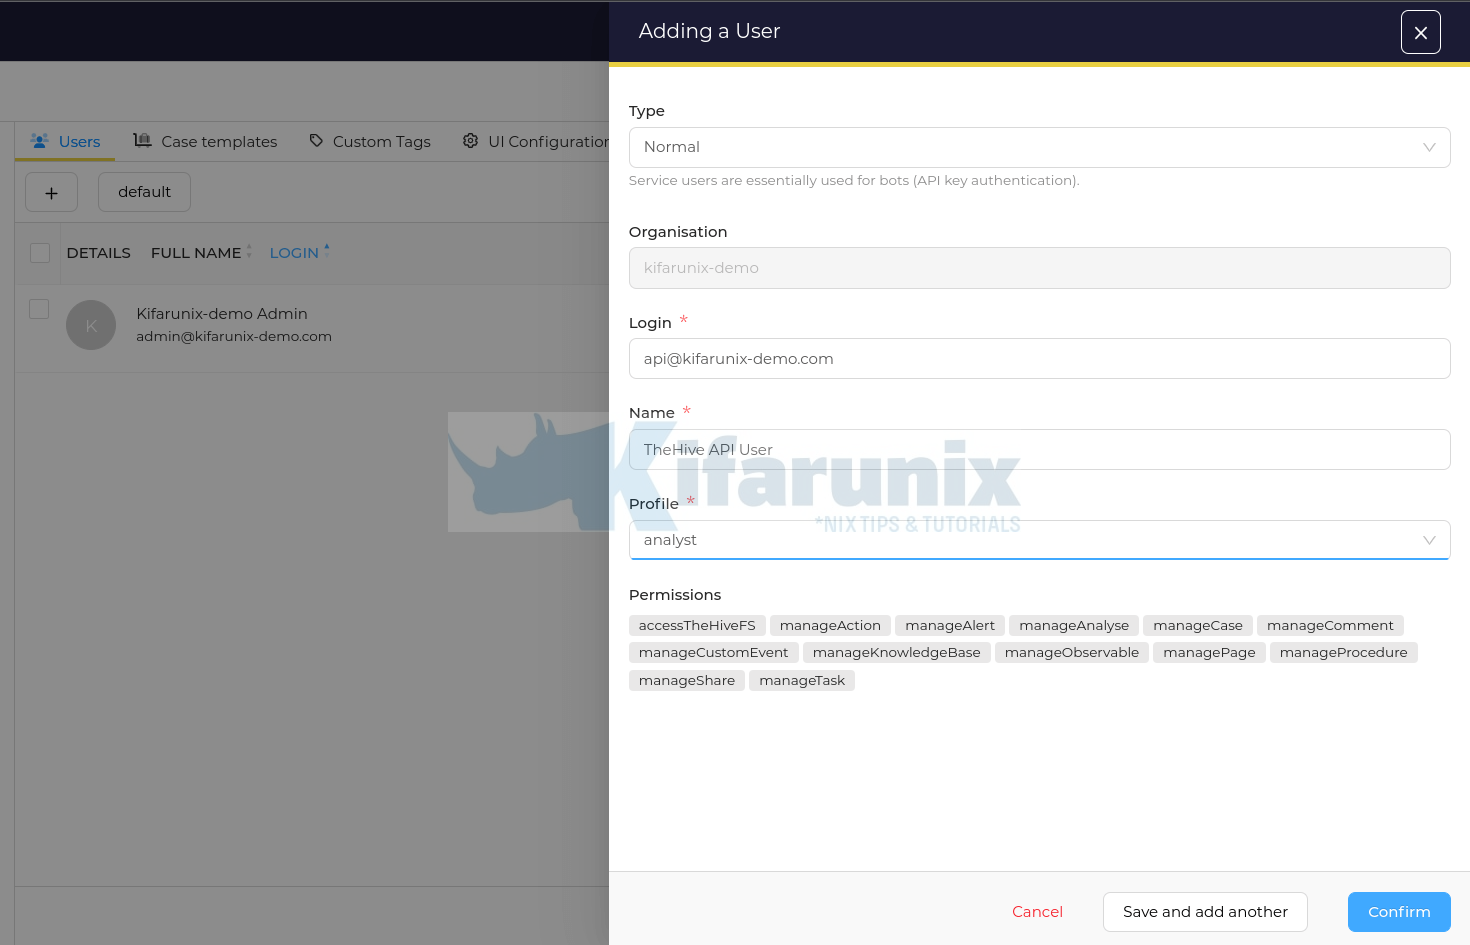
Login as the administrative user to your TheHive organization and add another less privileged user with permissions to create alerts via API. Remember, ElastAlert will be configured to sent alerts to TheHive via API. Hence, we will use the profile analyst for the API user.
Hence, under your specific Organization > click Users > +. Enter the login username, the name and choose the privileges (analyst).
Click Confirm to add the user.
Generate TheHive Alerts API Key for the API User
Next, you need to generate the API key for the API user.
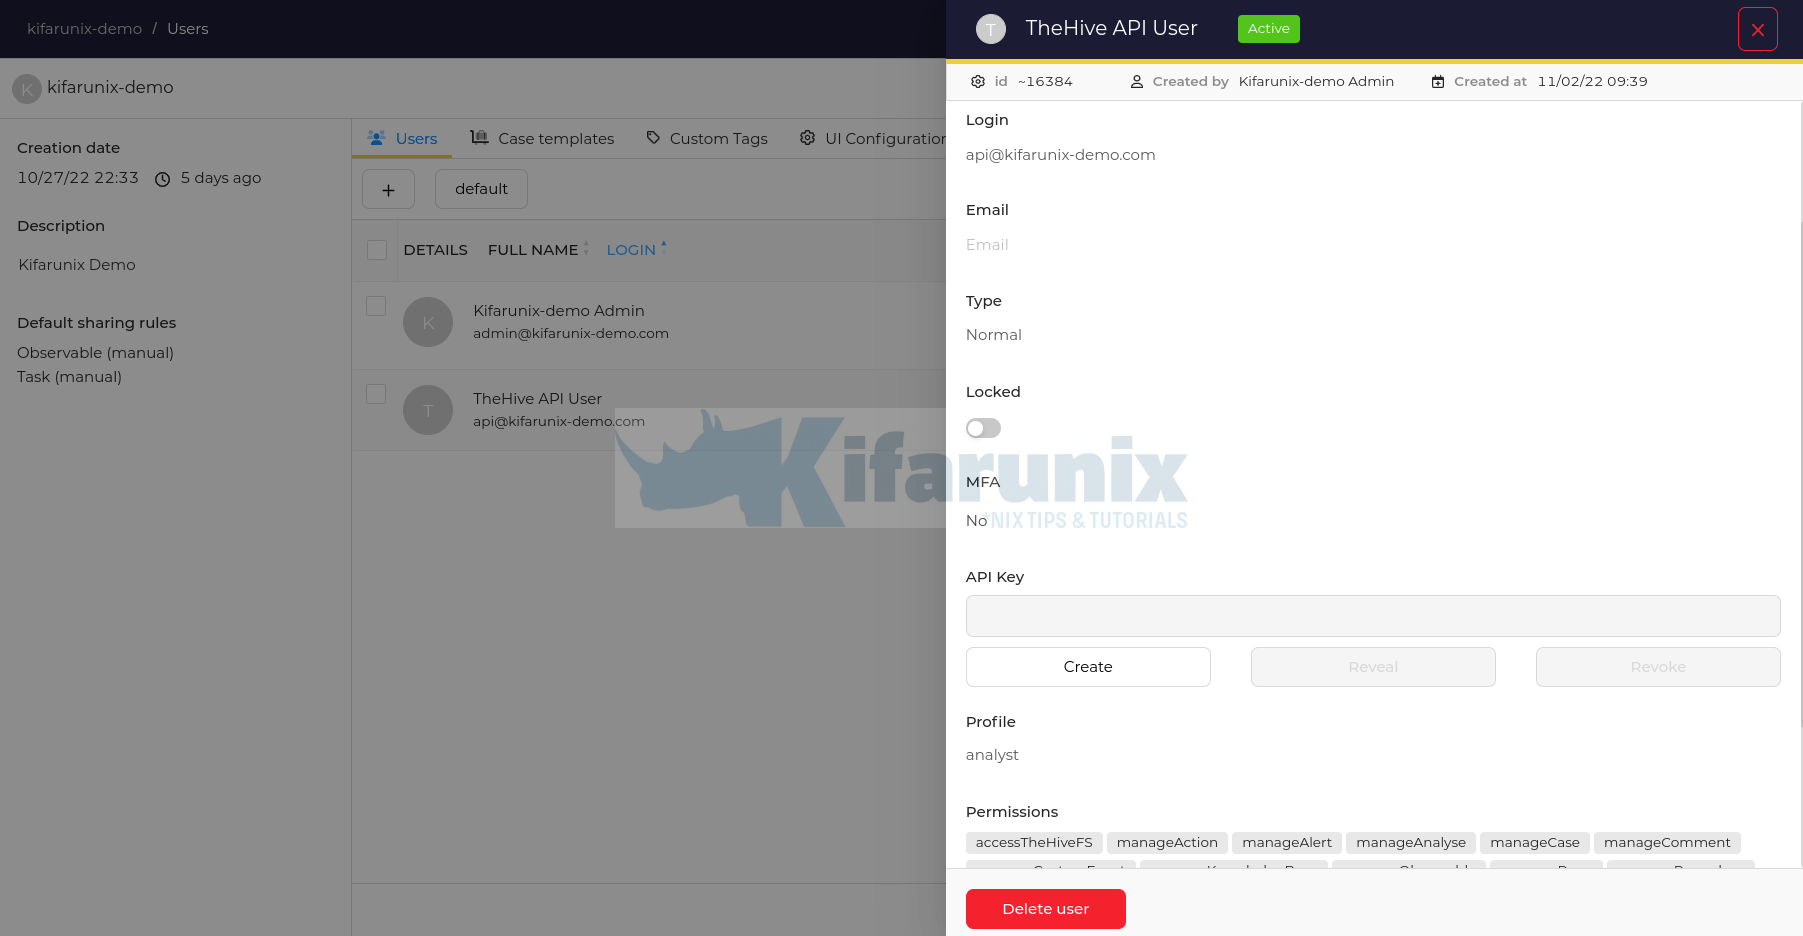
- On the Organization users, hover your mouse over the API user and click Preview.
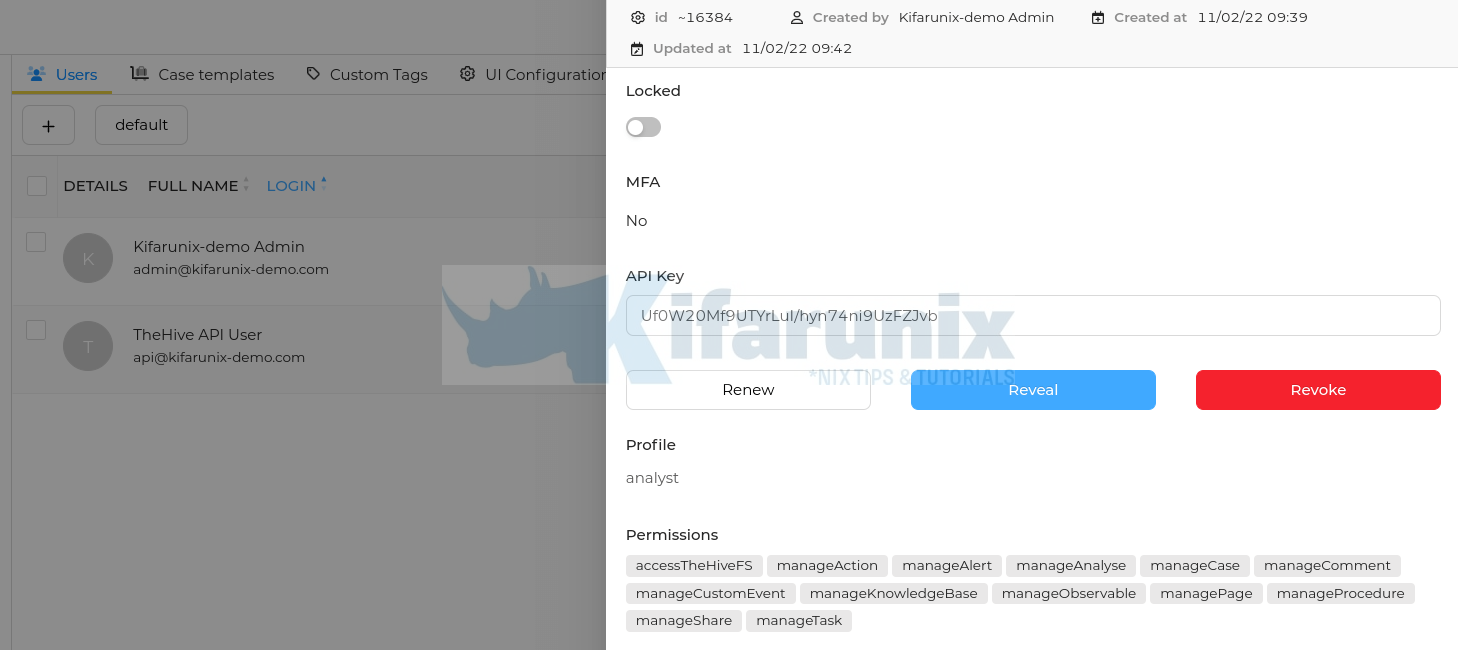
- Under the users settings wizard, API Key, click Create to generate API key.
- Once the key is generated, you can close the user settings wizard.
- You can access the key later by navigating to users Preview > API Key > Reveal.
Configure ElastAlert to Sent Alerts to TheHive
Note that we are using ElastAlert2 in our demo setup.
Define ElastAlert configuration options;
This is my sample Elastalert config for thehive;
cat /opt/elastalert/config-thehive.yamlrules_folder: example_rules
run_every:
minutes: 5
buffer_time:
minutes: 15
es_host: 192.168.58.22
es_port: 9200
writeback_index: elastalert_status
writeback_alias: elastalert_alerts
alert_time_limit:
days: 2
Update your configuration accordingly;
Create ElastAlert alerting rules for TheHive;
For this, you will need to get the API key generated above.
This is our sample rules file;
cat /opt/elastalert/example_rules/thehive.yaml
name: Sample SSH Rule
type: frequency
num_events: 3
timeframe:
  minutes: 1
filter:
- query:
    query_string:
      query: "event.type:authentication_failure"
index: filebeat-*
realert:
  minutes: 1
query_key:
  - source.ip
include:
  - source.ip
  - host.hostname
  - user.name

alert: hivealerter
hive_connection:
  hive_host: http://thehive.kifarunix-demo.com
  hive_port: 9000
  hive_apikey: Uf0W20Mf9UTYrLuI/hyn74ni9UzFZJvb
  hive_proxies:
    http: ''
    https: ''

hive_alert_config:
  title: 'SSH Bruteforce Attacks'
  type: 'external'
  source: 'elastalert'
  description: 'SSH Bruteforce Attacks'
  severity: 2
  tags: ['ssh', 'bruteforce', 'authentications']
  tlp: 3
  status: 'New'
  follow: True

hive_observable_data_mapping:
    - ip: source.ip
    - hostname: host.hostname
Test the rule;
elastalert-test-rule --config /opt/elastalert/config-thehive.yaml /opt/elastalert/example_rules/thehive.yamlSample output;
INFO:elastalert:Note: In debug mode, alerts will be logged to console but NOT actually sent.
            To send them but remain verbose, use --verbose instead.
Got 155 hits from the last 0 day

Available terms in first hit:
	agent.hostname
	agent.name
	agent.id
	agent.ephemeral_id
	agent.type
	agent.version
	process.name
	process.pid
	log.file.path
	log.offset
	source.port
	source.ip
	fileset.name
	input.type
	@timestamp
	system.auth.ssh.method
	system.auth.ssh.event
	ecs.version
	related.hosts
	related.ip
	related.user
	service.type
	host.hostname
	host.os.kernel
	host.os.codename
	host.os.name
	host.os.type
	host.os.family
	host.os.version
	host.os.platform
	host.containerized
	host.ip
	host.name
	host.id
	host.mac
	host.architecture
	event.ingested
	event.timezone
	event.kind
	event.module
	event.action
	event.type
	event.category
	event.dataset
	event.outcome
	user.name

INFO:elastalert:Note: In debug mode, alerts will be logged to console but NOT actually sent.
                To send them but remain verbose, use --verbose instead.
INFO:elastalert:1 rules loaded
INFO:apscheduler.scheduler:Adding job tentatively -- it will be properly scheduled when the scheduler starts
INFO:elastalert:Queried rule Sample SSH Rule from 2022-11-02 22:30 EAT to 2022-11-02 22:31 EAT: 4 / 4 hits
INFO:elastalert:Alert for Sample SSH Rule at 2022-11-02T22:31:17+03:00:
INFO:elastalert:Sample SSH Rule

At least 3 events occurred between 2022-11-02 22:30 EAT and 2022-11-02 22:31 EAT

@timestamp: 2022-11-02T22:31:17+03:00
_id: HK3TOYQBtG6LAFezqKdP
_index: filebeat-7.17.0-2022.10.20-000001
_type: _doc
host: {
    "hostname": "debian11"
}
num_hits: 4
num_matches: 1
source: {
    "ip": "192.168.58.50"
}
user: {
    "name": "socadmin"
}


Would have written the following documents to writeback index (default is elastalert_status):

silence - {'exponent': 0, 'rule_name': 'Sample SSH Rule.192.168.58.50', '@timestamp': datetime.datetime(2022, 11, 2, 19, 31, 29, 378481, tzinfo=tzutc()), 'until': datetime.datetime(2022, 11, 2, 19, 36, 29, 378473, tzinfo=tzutc())}

elastalert_status - {'rule_name': 'Sample SSH Rule', 'endtime': datetime.datetime(2022, 11, 2, 19, 31, 29, 222934, tzinfo=tzutc()), 'starttime': datetime.datetime(2022, 11, 2, 19, 30, 28, 622934, tzinfo=tzutc()), 'matches': 1, 'hits': 4, '@timestamp': datetime.datetime(2022, 11, 2, 19, 31, 29, 379893, tzinfo=tzutc()), 'time_taken': 0.008604764938354492}
As you can see from the test above, four events found related to failed SSH authentications within one minute.
Run ElastAlert Against the TheHive Rule
To check if alerts can be sent to TheHive, let’s run the rule;
/usr/local/bin/elastalert --verbose --config /opt/elastalert/config-thehive.yaml --rule /opt/elastalert/example_rules/thehive.yamlNow, simulate failed events to one your systems that are already collecting and sending logs to ELK stack;
Sample rule output;
INFO:elastalert:1 rules loaded
INFO:elastalert:Starting up
INFO:elastalert:Disabled rules are: []
INFO:elastalert:Sleeping for 299.999836 seconds
INFO:elastalert:Queried rule Sample SSH Rule from 2022-11-02 22:27 EAT to 2022-11-02 22:32 EAT: 16 / 16 hits
INFO:elastalert:Alert sent to TheHive
INFO:elastalert:Ran Sample SSH Rule from 2022-11-02 22:27 EAT to 2022-11-02 22:32 EAT: 16 query hits (0 already seen), 5 matches, 1 alerts sent
INFO:elastalert:Sample SSH Rule range 337
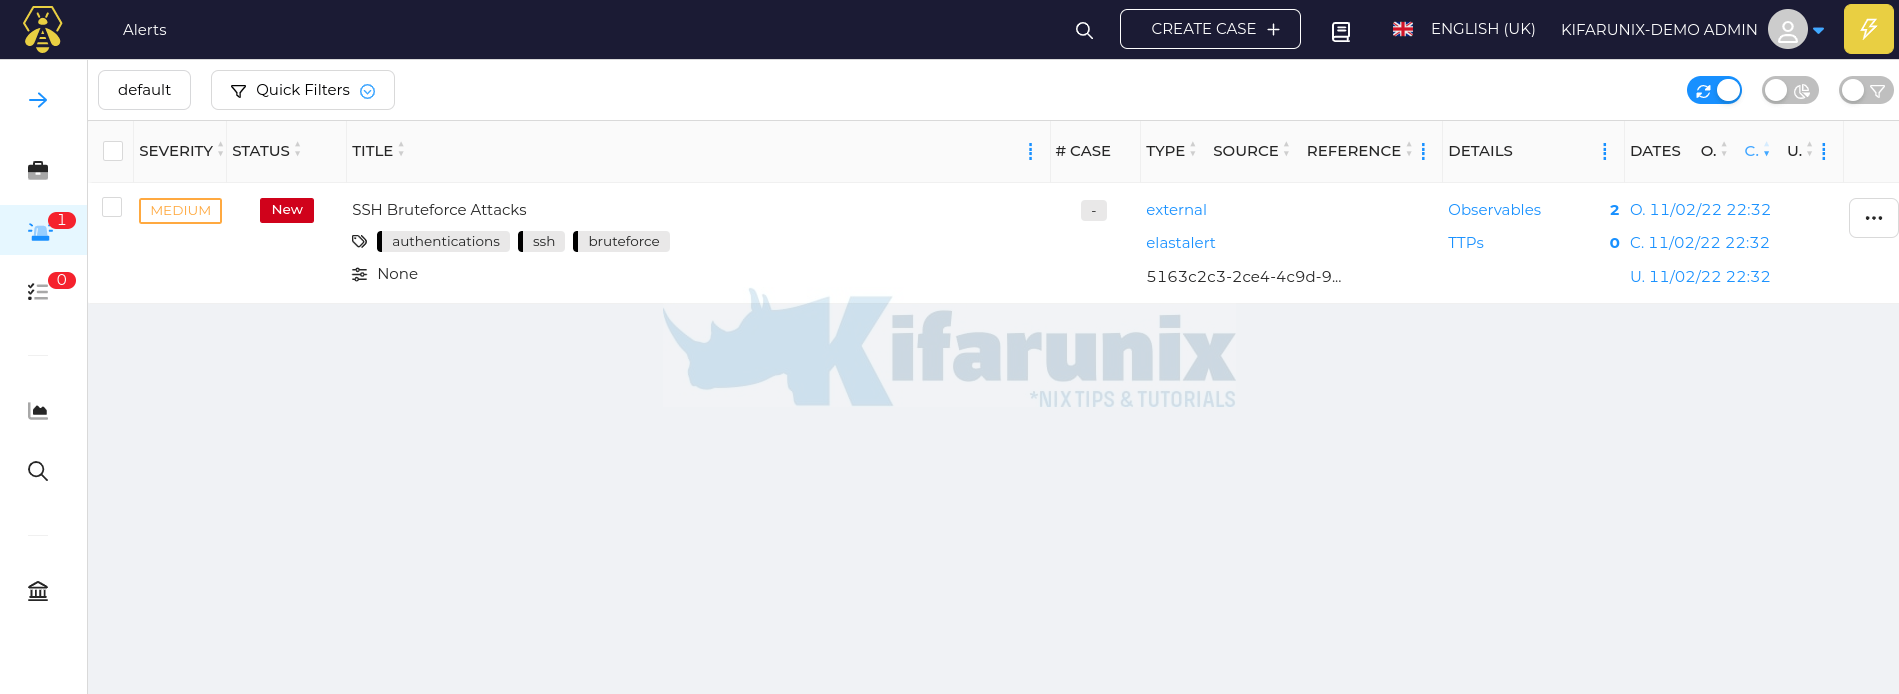
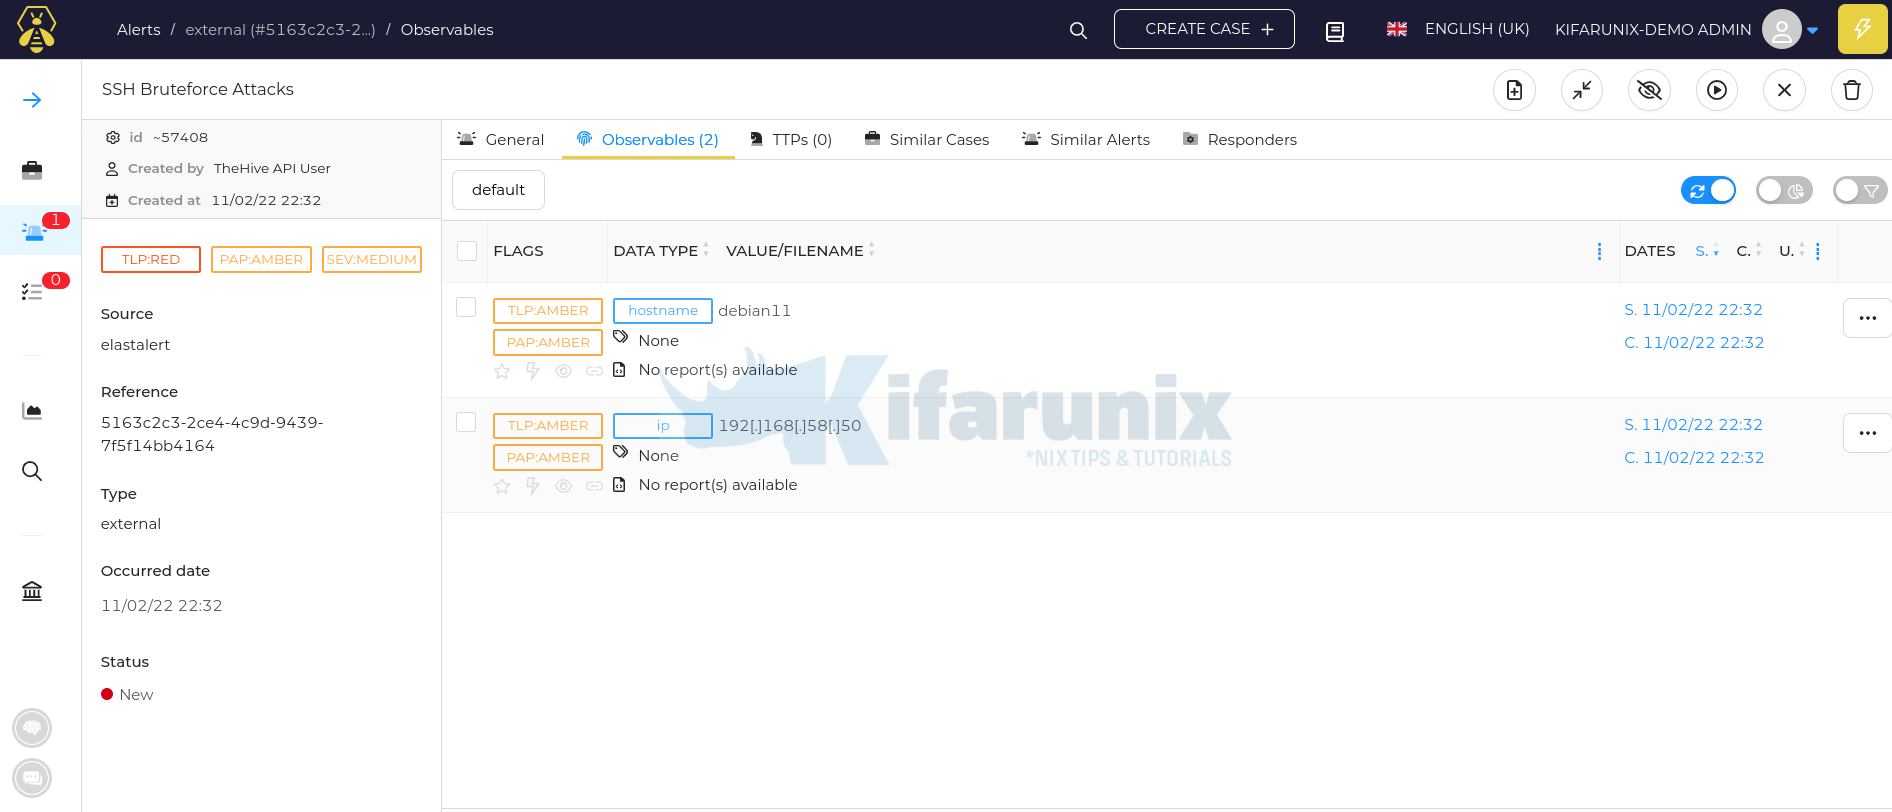
As you can see, an alert has been sent to TheHive based on the alert query event match.
Login to TheHive and verify the alerts;
Hover the mouse over alert and click preview > Go to details to see more details;
And that is all on integrating ELK stack with TheHive. You can now proceed with further Hive actions based on the event.
Other Tutorials;
Detecting Malicious Files with Wazuh and VirusTotal
Send Alert When ClamAV Finds Infected Files on Linux Systems


your all article on ELK are life saver
We are happy you found the tutorials useful. Enjoy
Hi, thx for this tutorial.
this tutorial aims to redirect the rules we made on ELK to thehive if I understood correctly, is that it?
it sent alerts based on events on ELK to thehive
I want to know whats the process for connecting ELK with Hive. where Hive is my on prem server and ELK store logs on cloud.
I am confusing which version of elk should install version 8.x or must be version 7.x to integrate with thehive?
You can try 8.x. But you will need to define elasticsearch authentication to be able to read the index data.
I’ve installed elk 8 what should I do to install the hive??