This guide will take you through how to integrate Osquery manager with ELK Stack. According to their Github page, osquery is a SQL powered operating system instrumentation, monitoring, and analytics framework. It is available for Linux, macOS, Windows, and FreeBSD.
It allows you to query the operating system just like you would query any records from the usual relational databases thus providing you with visibility into your infrastructure and operating systems.
Integrating Osquery Manager with ELK Stack
Recent versions of ELK now supports integration with Osquery manager right from the Kibana UI. According to this press release by Elastic;
The osquery host management integration, now in beta, enables security teams to use osquery results to address cyber threats without the complexity or cost of a separate management layer. With one click, users can install and orchestrate osquery across their Windows, macOS, and Linux hosts.
Osquery data is ingested in Elasticsearch and shown in Kibana where users can run live queries with one or more agents, and define scheduled queries to capture changes to an organization’s security state. From a single pane of glass, users can centralize security analytics and contextualize osquery results against other event data, anomalies, and threats, and leverage that context to improve host visibility, analytical power, and monitoring.
Enhanced capabilities also include prebuilt and custom SQL queries, as well as Kibana query guidance to support users with code completion, code hinting, and content assistance.
With Osquery in Kibana, you can:
- Run live queries for one or more agents
- Schedule query packs to capture changes to OS state over time
- View a history of past queries and their results
- Save queries and build a library of queries for specific use cases
To begin with, setup and configure Fleet Server on ELK cluster
Check our previous guide on how to;
Configure and Setup Fleet Server
Install and Enroll agents on remote hosts to monitor
Check this guide as well;
Install and Enroll Elastic Agents to Fleet Manager in Linux
Add Osquery Manager to Kibana
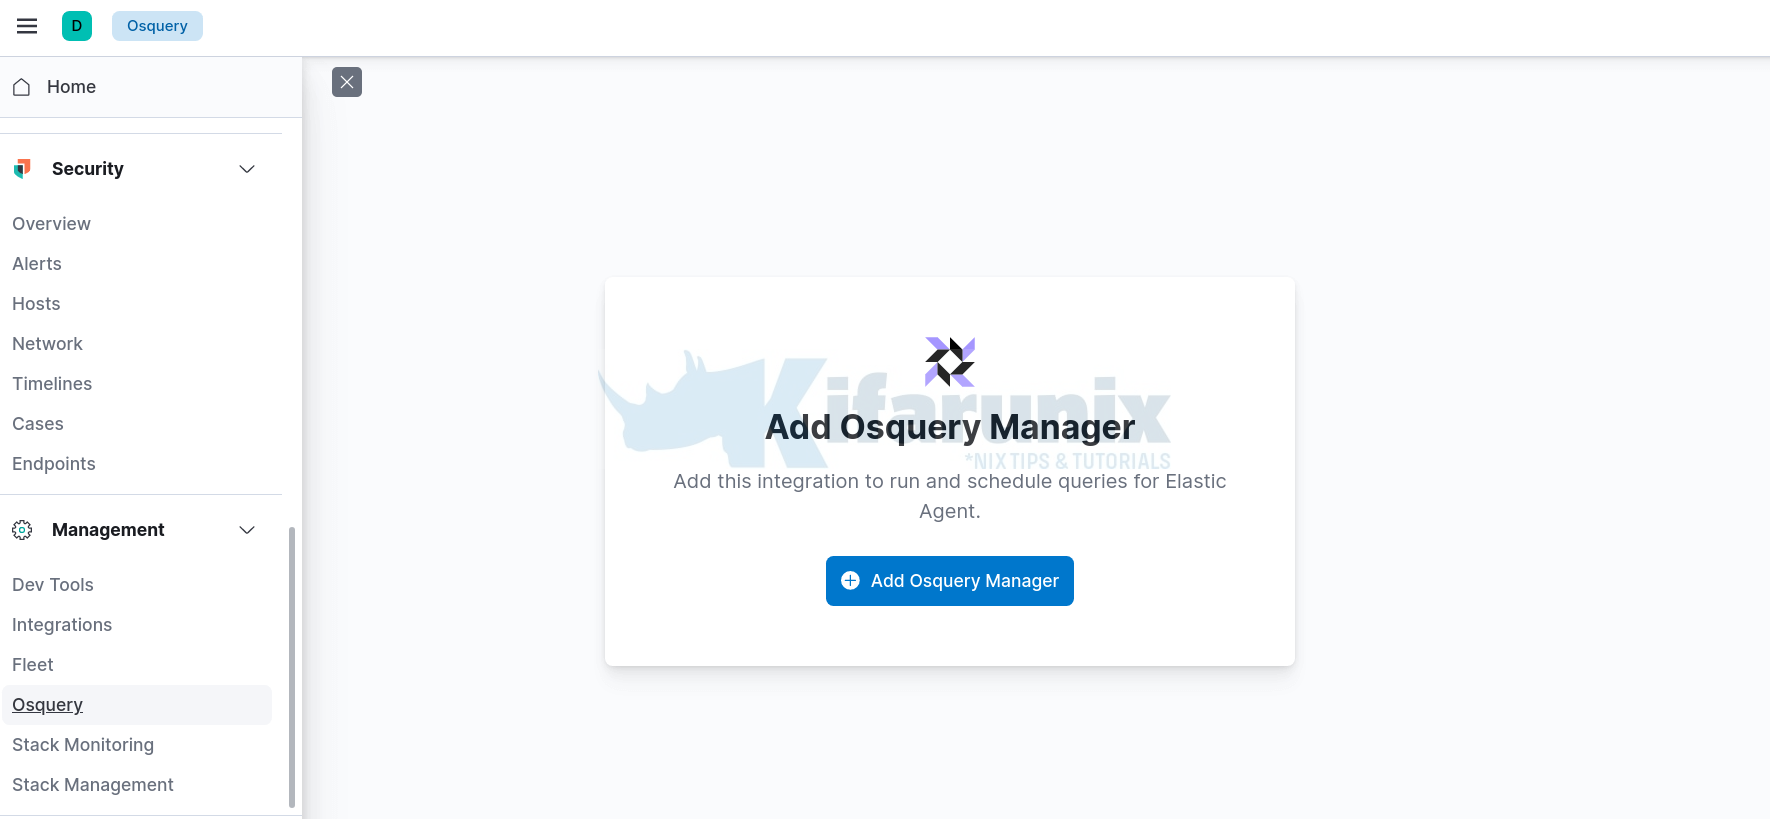
Once the above is done, head over to Kibana > Management > Osquery > Add Osquery Manager.
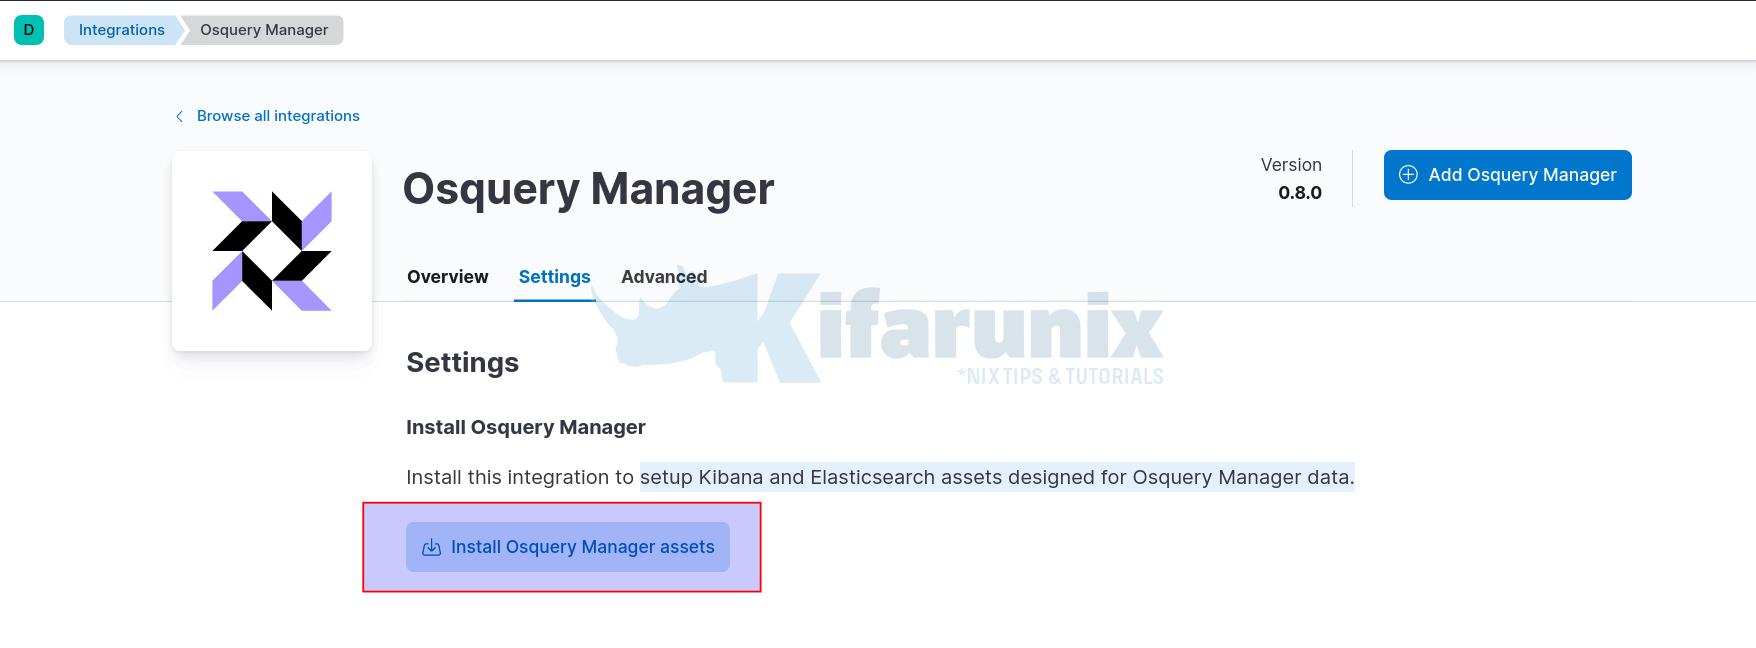
Under Osquery Manager, head over to Settings and install Osquery manager which is required to setup Kibana and Elasticsearch assets designed for Osquery Manager data by clicking on Install Osquery Manager assets and confirming the installation on the default Kibana space.
Once installed, the settings tab should now show installed and latest version of Osquery manager. You will also see other tabs added as Integration policies and Assets.
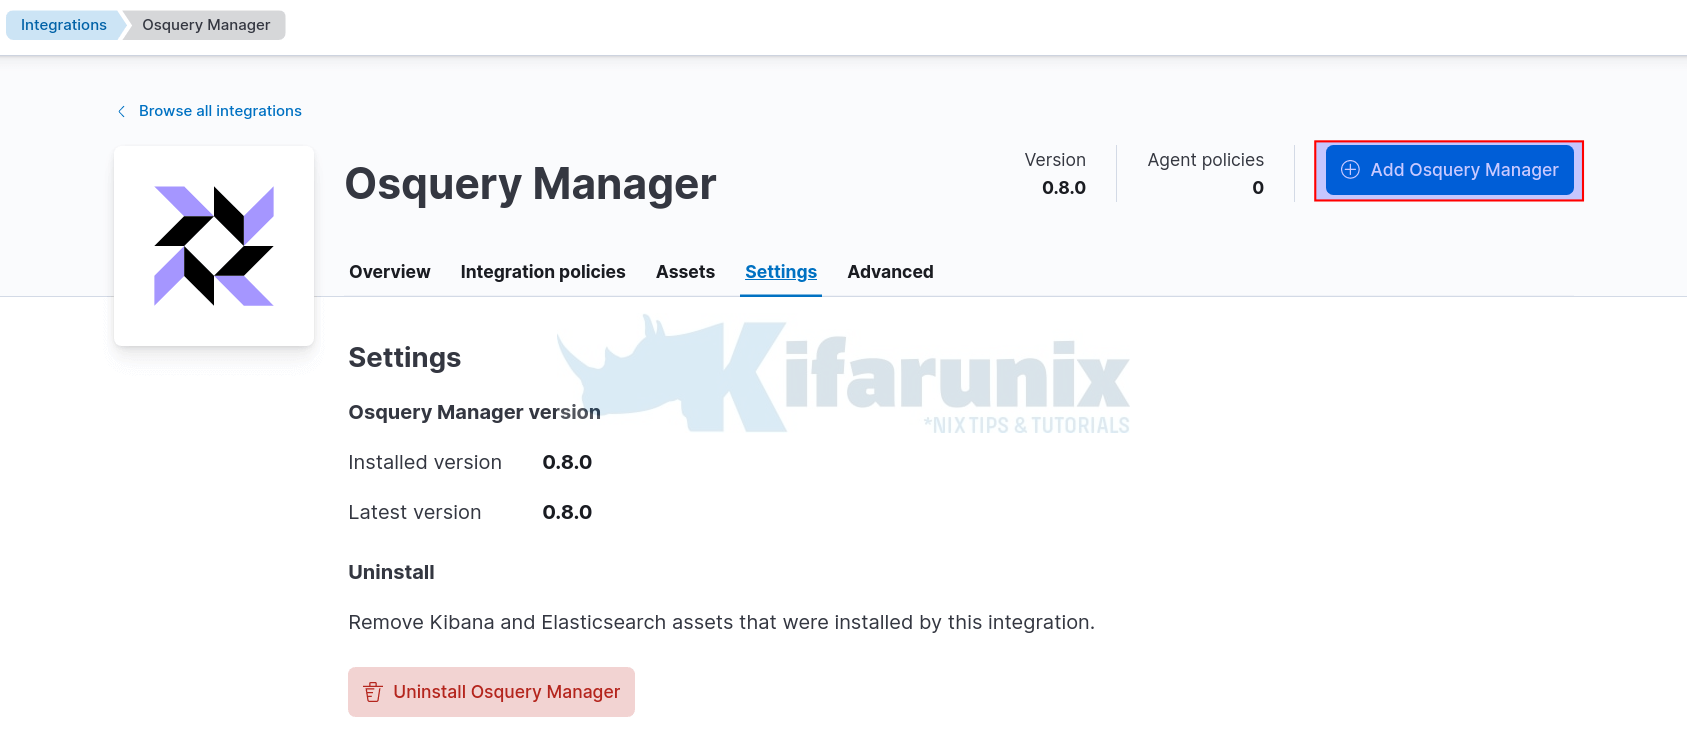
Next, add Osquery manager integration to the fleet by clicking the Add Osquery Manager button as highlighted on the screenshot above.
Osquery manager integration configuration page opens up.
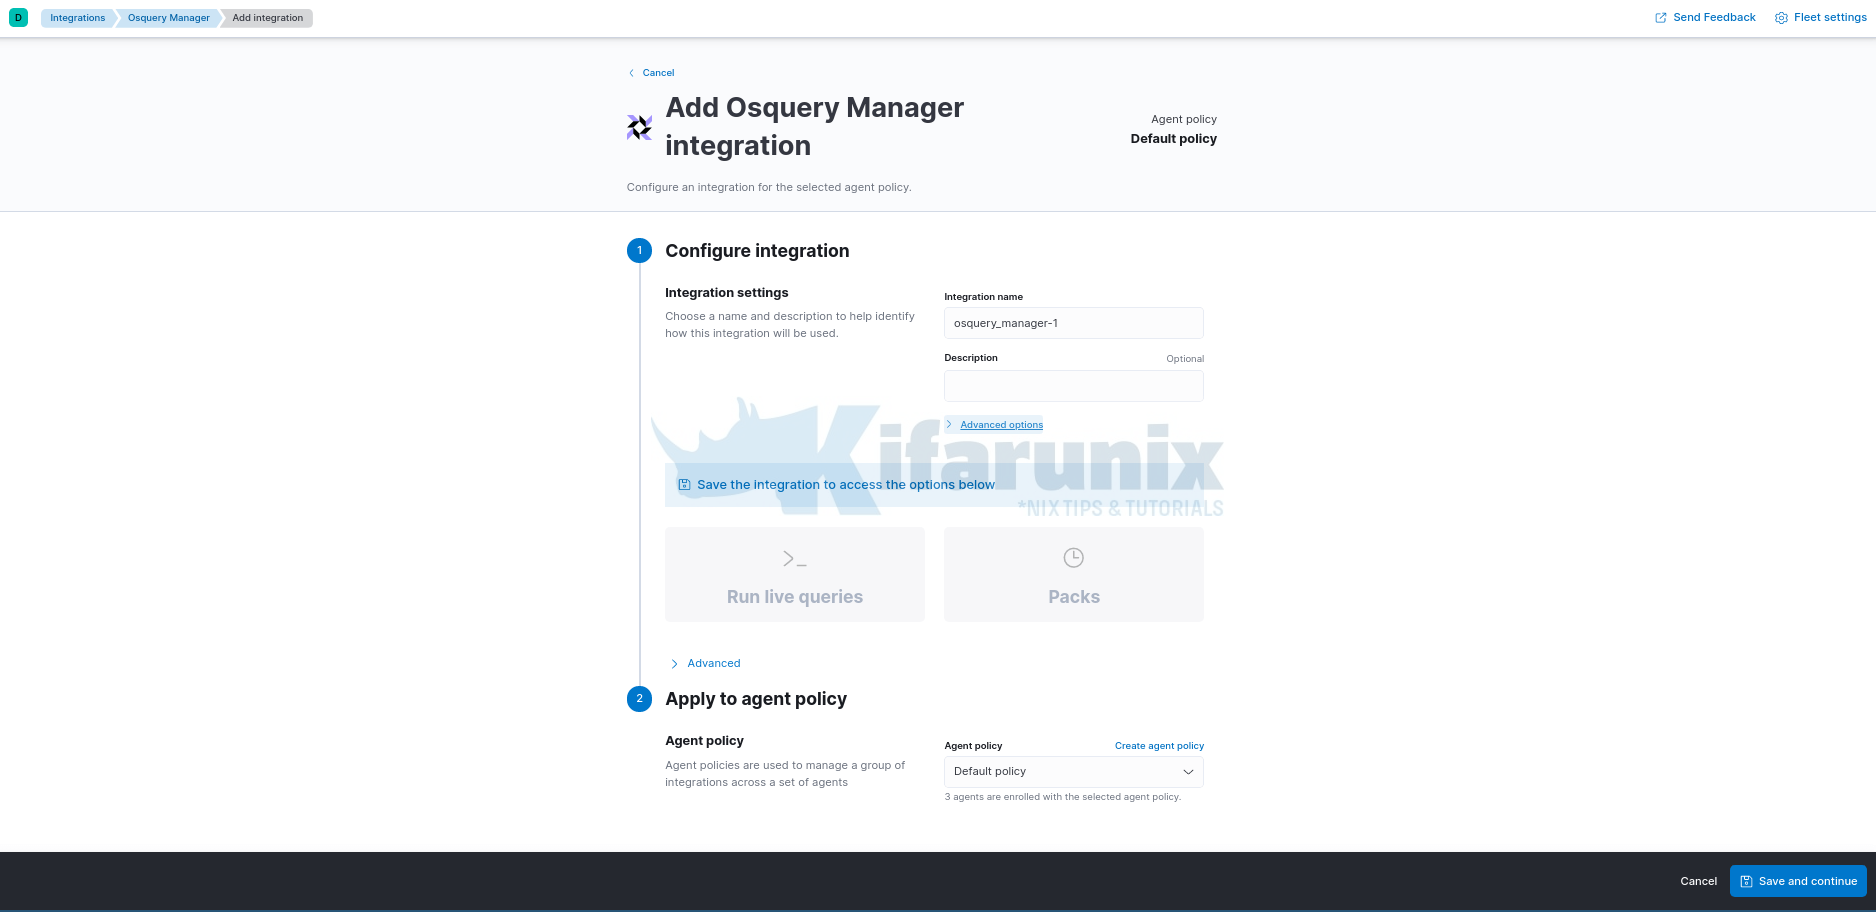
We will go with the default settings, hence click Save and continue at the bottom of the page.
The configurations will be applied to the Elastic agents already enrolled to the Fleet. Thus confirm and proceed.
Once the changes are saved;
- you will see that the integration policies are updated.
- You cannot also uninstall the Osquery manager unless you remove all the integrations.
Please note that in order for you to use Osquery manager, there are some privileges required;
Readprivileges for thelogs-osquery_manager.result*index.- Kibana privileges for Osquery Manager.
- The
Allprivilege enables you to run, schedule, and save queries. Readenables you to view live and scheduled query results, but you cannot run live queries or edit.
- The
Under advanced tab, you will see live queries and packs;
- Live queries are queries you can run on the fly to query your endpoints
- Packs are a set of queries that perform various activities.

You can also access Osquery Manager Live queries/Pack settings from Kibana Management menu > Osquery.

Querying Remote Host using Elastic Osquery Manager
Now that integration is done, you can query your remote hosts as you would while using stand alone Osquery manager.
Configure Elastic Agent Osquerybeats TLS connection with Elastic stack
Note that when you setup Osquery manager integration, it will automatically install osquerybeats on the Elastic agents already enrolled on to the Fleet manager.
Thus, if you setup Fleet server/Elastic with HTTPS, you need to configure Osquerybeat with HTTPS to enable communication with Elasticsearch.
In our Elastic agent host, we installed the agent from the repos, thus the configuration files for Osquerybeat is localted at /var/lib/elastic-agent/data/elastic-agent-XXXXXX/install/osquerybeat-VERSION-linux-x86_64/osquerybeat.yml,
If you installed via the TAR file, this config would be located at /opt/Elastic/Agent/data/elastic-agent-XXXXXX/install/osquerybeat-VERSION-linux-x86_64/osquerybeat.yml
Where:
XXXXXXis some random number.VERSIONis the Elastic version number.
Thus, open the respective file for editing and update Elasticsearch output configs;
vim /var/lib/elastic-agent/data/elastic-agent-7e56c4/install/osquerybeat-7.16.1-linux-x86_64/osquerybeat.yml# ---------------------------- Elasticsearch Output ----------------------------
output.elasticsearch:
# Array of hosts to connect to.
hosts: ["192.168.58.22:9200"]
# Protocol - either `http` (default) or `https`.
protocol: "https"
ssl.certificate_authorities: ["/etc/ssl/certs/kifarunix-demo-fleet-server.crt"]
# Authentication credentials - either API key or username/password.
#api_key: "id:api_key"
username: "elastic"
password: "WSZdCjtgn9c8Pphd4St4"
Once you are done, restart Elastic Agent;
systemctl restart elastic-agentQuery Remote Elastic Agent Host using Osquery Manager
To query a remote host;
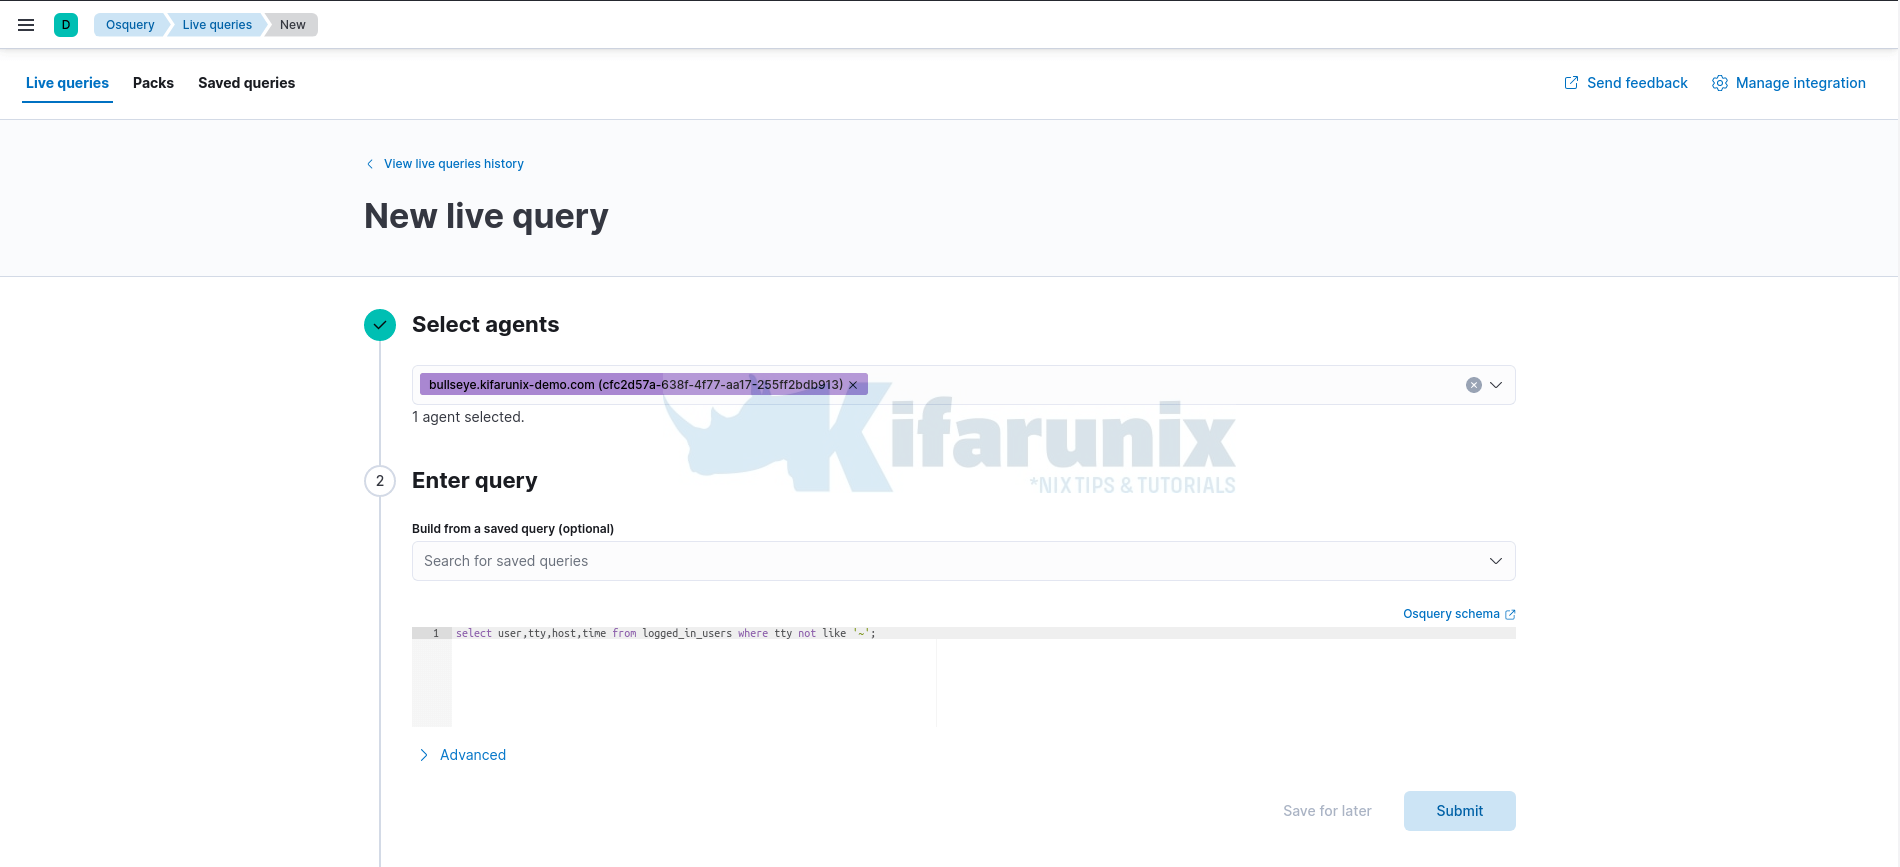
- Click New live query
- Choose remote host to query based on the elastic agent installation from the list.
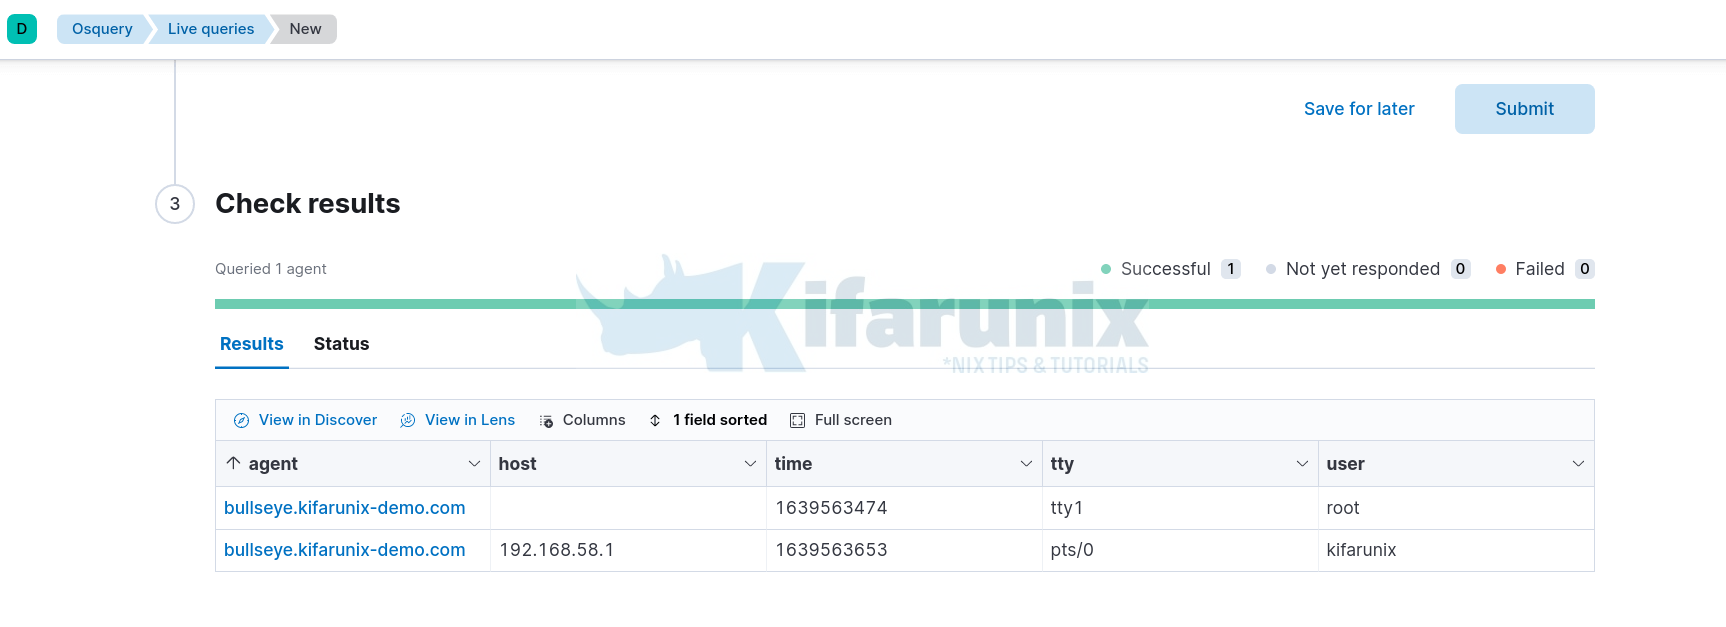
- Choose a query from saved queries if you already saved some. Otherwise, create a new query. For example a query to get all currently logged in users;
select user,tty,host,time from logged_in_users where tty not like '~';Read more on osquery schema.
- Enter the query and click Submit to run the query on remote host;
- Check the live query results.
Other sample output for the query;
select * from users;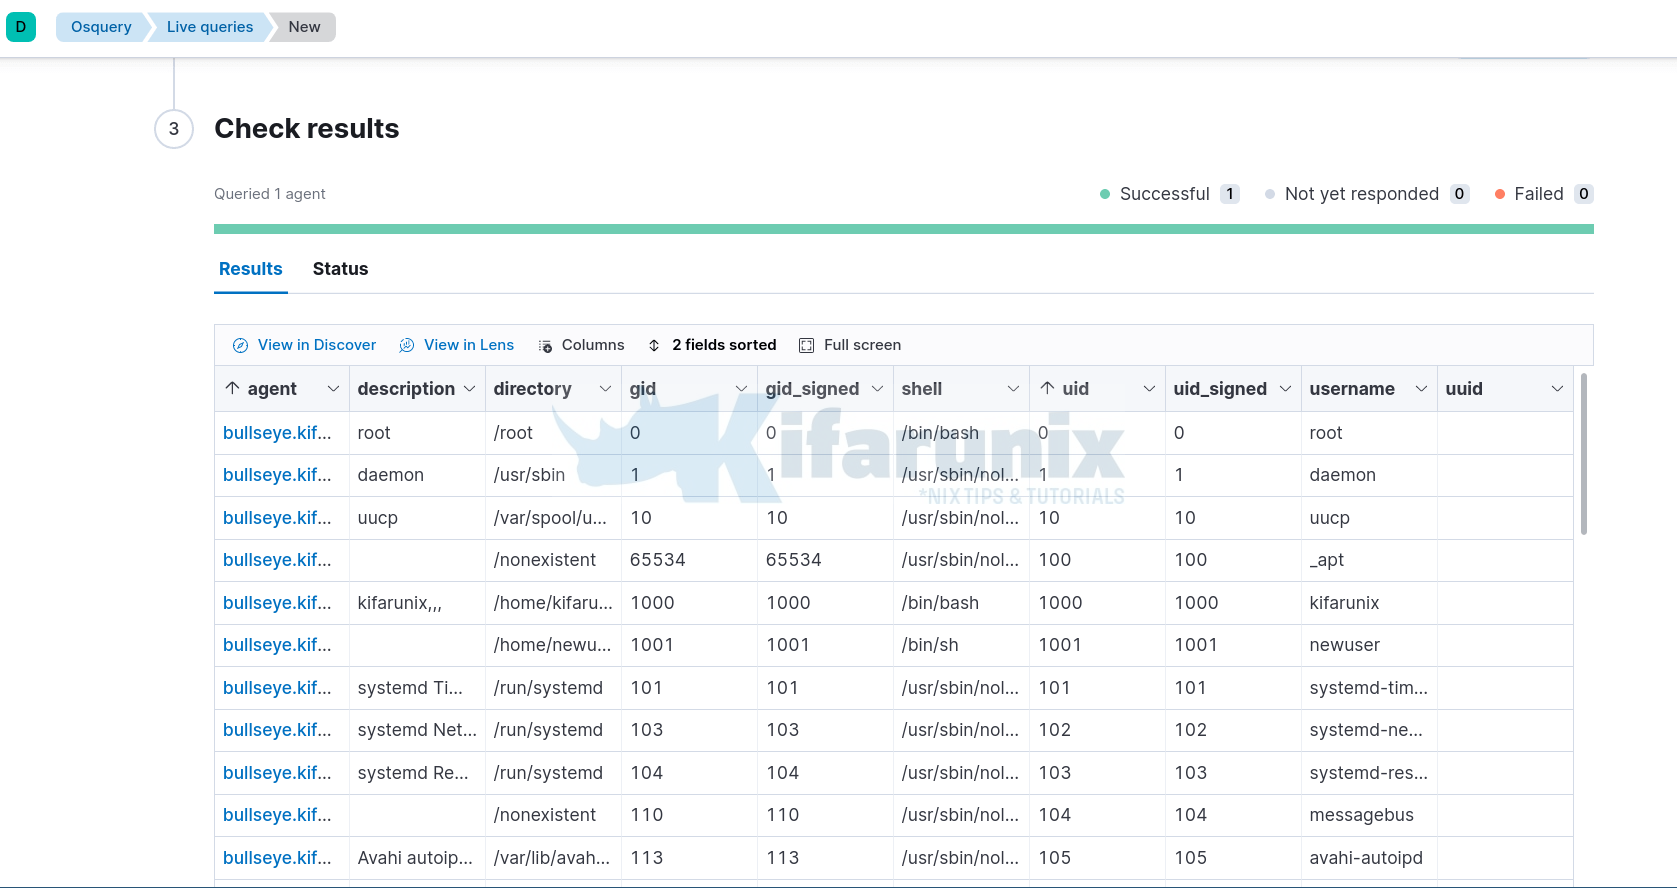
- You can view the results in Kibana discover or in lens to create visualization.
- You can now run any other query you want on your host with just on click.
- You can also schedule queries with packs.
Elastic Agent Logs
Be sure to check Elastic agent logs in the directory;
/var/lib/elastic-agent/data/elastic-agent-XXXXXX/logs/defaultSample log files;
filebeat-json.log
filebeat-json.log-2021-12-15-00-5
filebeat-json.log-2021-12-15-00-6
filebeat-json.log-2021-12-15-13-1
filebeat-json.log-2021-12-15-13-2
filebeat-json.log-2021-12-15-13-3
filebeat-json.log-2021-12-15-13-4
filebeat-json.log-2021-12-15-13-5
metricbeat-json.log
metricbeat-json.log-2021-12-14-21-1
metricbeat-json.log-2021-12-14-22-1
metricbeat-json.log-2021-12-15-00-1
metricbeat-json.log-2021-12-15-00-2
metricbeat-json.log-2021-12-15-13-1
metricbeat-json.log-2021-12-15-13-2
metricbeat-json.log-2021-12-15-13-3
osquerybeat-json.log
osquerybeat-json.log-2021-12-15-00-1
osquerybeat-json.log-2021-12-15-00-2
osquerybeat-json.log-2021-12-15-13-1
osquerybeat-json.log-2021-12-15-13-2
osquerybeat-json.log-2021-12-15-13-3
Also check how to monitor Windows systems using Elastic Osquery Manager;
Monitor Windows Systems using Elastic Osquery Manager
Reference
Other Tutorials
Install and Enroll Elastic Agents to Fleet Manager in Linux

