In this guide, we are going to learn how to install Prometheus on Ubuntu 18.04. Prometheus is an open-source systems and service monitoring system. It collects metrics from configured targets via HTTP calls at given intervals, evaluates rule expressions, displays the results, and can trigger alerts if some conditions are met.
We have covered the installation of Prometheus on Debian 9 and Fedora 29/28 in our previous guides;
Install and Configure Prometheus on Fedora 29/Fedora 28
Install and Configure Prometheus on Debian 9
Install Prometheus on Ubuntu 18.04
Prometheus is made up various components;
- The main Prometheus server which scrapes and stores time series data
- Client libraries for instrumenting application code
- Push gateway for supporting short-lived jobs
- Exporters for exporting existing metrics from third-party systems as Prometheus metrics in cases where it is not feasible to instrument a given system with Prometheus metrics directly for example in services like HAProxy, StatsD, Graphite, etc.
- Alertmanager to handle alerts.
Prometheus and its other components are available on the default Ubuntu 18.04 repositories. However, the available versions may not be up-to-date. You can verify the available versions by running the command below;
apt-cache policy prometheus
prometheus:
  Installed: (none)
  Candidate: 2.1.0+ds-1
  Version table:
     2.1.0+ds-1 500
        500 http://ke.archive.ubuntu.com/ubuntu bionic/universe amd64 Packages
Install Prometheus Using Pre-compiled Binaries
To ensure that you got the latest versions of Prometheus installed, you can use the pre-compiled binaries which can be downloaded directly from Prometheus downloads section.
Create Prometheus System User and Group
Before you can begin the installation, you have to create Prometheus system user and group as shown below;
useradd -M -r -s /bin/false prometheusCreate Prometheus Directories
Next, you need to create the directories that will be used to store Prometheus configurations files and other data.
mkdir /etc/prometheus /var/lib/prometheusDownload Prometheus Binary
Next, navigate to the downloads section and grab the latest version of Prometheus. You simply use wget to download it.
wget https://github.com/prometheus/prometheus/releases/download/v2.10.0/prometheus-2.10.0.linux-amd64.tar.gzInstall Prometheus on Ubuntu 18.04
Once you have downloaded the binary, extract it and proceed to install it as follows.
tar xzf prometheus-2.10.0.linux-amd64.tar.gzNext, copy the prometheus and promtool binaries under the extracted archive folder to /usr/local/bin directory.
cp prometheus-2.10.0.linux-amd64/{prometheus,promtool} /usr/local/bin/After copying, set the user and group ownership of these binaries to prometheus.
chown prometheus:prometheus /usr/local/bin/{prometheus,promtool}Next, copy the consoles and console_libraries directories to /etc/prometheus.
cp -r prometheus-2.10.0.linux-amd64/{consoles,console_libraries} /etc/prometheus/Create Prometheus Configuration file
The default Prometheus configuration file is located on the extracted archive folder. For the demonstration purposes, we will just copy it to Prometheus configuration directory and modify it as follows;
cp prometheus-2.10.0.linux-amd64/prometheus.yml /etc/prometheus/prometheus.ymlless /etc/prometheus/prometheus.yml
global:
scrape_interval: 15s
evaluation_interval: 15s
rule_files:
scrape_configs:
- job_name: 'prometheus'
static_configs:
- targets: ['localhost:9090']In the default configuration there is a single job, called prometheus , which scrapes the time series data exposed by the Prometheus server. The job contains a single, statically configured, target, the localhost on port 9090.
Next, set the user and group ownership of Prometheus configuration directory, /etc/prometheus to prometheus.
chown -R prometheus:prometheus /etc/prometheusOnce that is done, similarly set the user and group ownership of Prometheus data directory, /var/lib/prometheus/ to prometheus.
chown prometheus:prometheus /var/lib/prometheusRunning Prometheus
At the very least, Prometheus is now set and is ready to run. However, at this point we do not have the Prometheus service configuration file and hence, we can run it as shown below;
prometheus --config.file=/etc/prometheus/prometheus.ymlCreate Prometheus Systemd Service File
To be able to run prometheus as a service, you can create a systemd service configuration file as shown below;
vim /etc/systemd/system/prometheus.service[Unit]
Description=Prometheus Time Series Collection and Processing Server
Wants=network-online.target
After=network-online.target
[Service]
User=prometheus
Group=prometheus
Type=simple
ExecStart=/usr/local/bin/prometheus \
--config.file /etc/prometheus/prometheus.yml \
--storage.tsdb.path /var/lib/prometheus/ \
--web.console.templates=/etc/prometheus/consoles \
--web.console.libraries=/etc/prometheus/console_libraries
[Install]
WantedBy=multi-user.targetNext, reload systemd configuration files and start and enable Prometheus to run on system boot.
systemctl daemon-reload
systemctl start prometheus
systemctl enable prometheus
To check the status of Prometheus service;
systemctl status prometheus● prometheus.service - Prometheus Time Series Collection and Processing Server
Loaded: loaded (/etc/systemd/system/prometheus.service; enabled; vendor preset: enabled)
Active: active (running) since Wed 2019-05-29 18:56:28 EAT; 8s ago
Main PID: 15835 (prometheus)
Tasks: 7 (limit: 1130)
CGroup: /system.slice/prometheus.service
└─15835 /usr/local/bin/prometheus --config.file /etc/prometheus/prometheus.yml --storage.tsdb.path /var/lib/prometheus/ --web.console.templa...Access Prometheus Web Interface
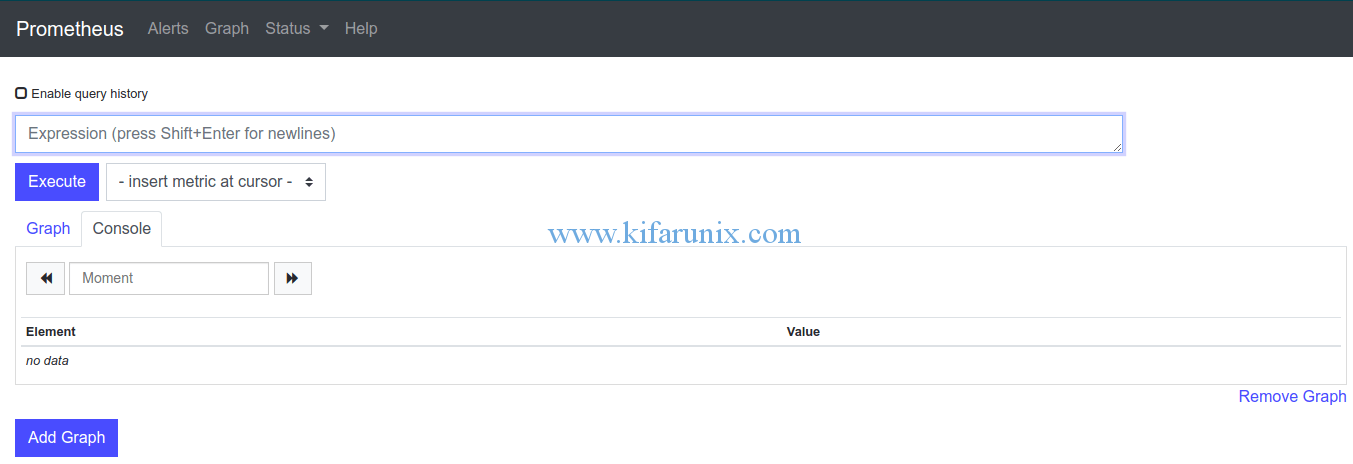
You can now access Prometheus using the address, http://<server_IP>:9090. This will take you to Prometheus’s built-in expression browser.

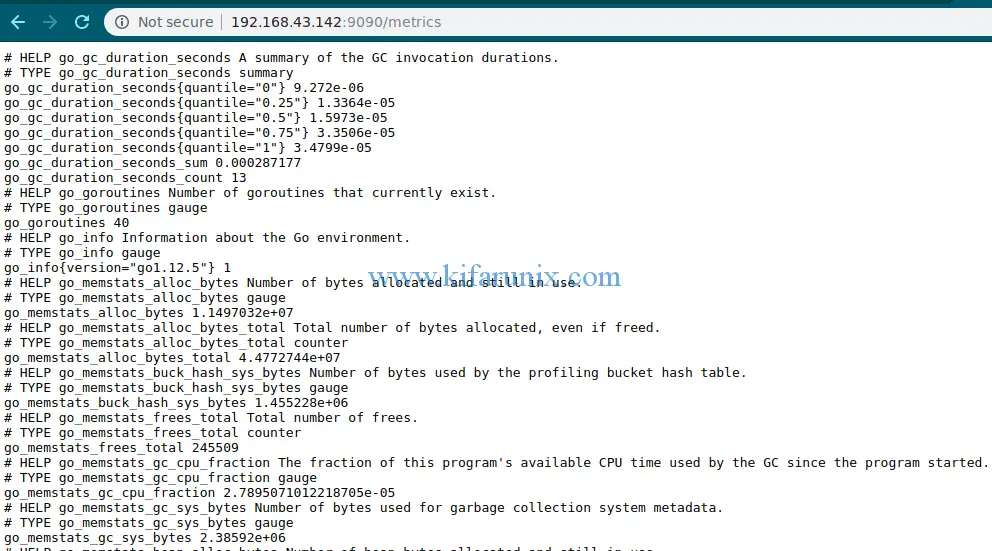
The scraped metrics can be viewed under, http://<server_IP>:9090/metrics.

To check the status of your node, navigate to Status > Targets.

Well, that is just about it on how to install Prometheus on Ubuntu 18.04. Want to learn how to monitor Linux hosts with Prometheus Node Exporter? Check the link below;
Monitor Linux System Metrics with Prometheus Node Exporter
Check our related articles by following the links below;
Install Graylog 3.0 on CentOS 7
Monitor Squid Access Logs with Graylog Server
Monitor Squid logs with Grafana and Graylog


Great tutorial, Thanks for sharing it….
We appreciate your feedback
El siguiente enlace no funciona 🙁
Monitor Linux System Metrics with Prometheus Node Exporter
Thank you for catching that. This has been updated. Enjoy
Muchas gracias por arreglarlo tan rápido!!!