Welcome to our guide on how to install ELK Stack on Debian 11. ELK, currently known as Elastic Stack, is the acronym for open source projects comprising;
- Elasticsearch: a search and analytics engine
- Kibana: a data visualization and dash-boarding tool that enables you to analyze data stored on Elasticsearch.
- Logstash: a server‑side data processing pipeline that ingests data from multiple sources simultaneously, transforms it, and then stashes it on search analytics engine like Elasticsearch
- Beats on the other hand are the log shippers that collects logs from different endpoints and sends them to either Logstash or directly to Elasticsearch.
Installing ELK Stack on Debian 11
Installation of Elastic Stack follows a specific order. Below is the order of installing Elastic Stack components;
- Install Elasticsearch
- Install Kibana
- Install Logstash
- Install Beats
Run system update
Before you can start the installation, ensure that the system packages are up-to-date.
Install and Configure Elasticsearch on Debian 11
You can install Elasticsearch automatically from Elastic repos or you can download Elasticsearch DEB binary package and install it. However, to simplify the installation of all Elastic Stack components, we will create Elastic Stack repos;
Import the Elastic stack PGP repository signing Key
apt install curl gnupg2 -ycurl -sL https://artifacts.elastic.co/GPG-KEY-elasticsearch | gpg --dearmor > /etc/apt/trusted.gpg.d/elastic.gpgInstall Elasticsearch;
echo "deb https://artifacts.elastic.co/packages/7.x/apt stable main" | tee /etc/apt/sources.list.d/elastic-7.x.listUpdate package cache and install Elasticsearch;
apt updateapt install elasticsearchConfigure Elasticsearch on Debian 11
There are only a few configuration changes we are going to make on this tutorial. First off, we configure ES to listen on a specific Interface IP to allow external access. Elasticsearch is listening on localhost by default.
Elasticsearch Cluster Name
You can choose to change the default cluster name;
sed -i '/cluster.name:/s/#//;s/my-application/kifarunix-demo/' /etc/elasticsearch/elasticsearch.ymlUpdate the Network Settings
Define an address on which to expose Elasticsearch node on the network. By default Elasticsearch is only accessible on localhost.
Replace the IP address, 192.168.58.25, accordingly.
sed -i '/network.host:/s/#//;s/192.168.0.1/192.168.58.25/' /etc/elasticsearch/elasticsearch.ymlDefine a specific Elasticsearch HTTP port.
By default Elasticsearch listens for HTTP traffic on the first free port it finds starting at 9200.
sed -i '/http.port:/s/#//' /etc/elasticsearch/elasticsearch.ymlCluster Discovery Settings
When you set the network.host to an IP address, Elasticsearch expects to be in a cluster.
But since we are running a single node Elasticsearch in our setup, you need to specify the same in the configuration by adding the line, discovery.type: single-node on Elasticsearch configuration file.
echo 'discovery.type: single-node' >> /etc/elasticsearch/elasticsearch.ymlDisable Swapping
sed -i '/bootstrap.memory_lock:/s/^#//' /etc/elasticsearch/elasticsearch.ymlConfigure JVM Settings
Next, configure JVM heap size to no more than half the size of your memory. In this case, our test server has 2G RAM and the heap size is set to 512M for both maximum and minimum sizes.
sed -i '/4g/s/^## //;s/4g/512m/' /etc/elasticsearch/jvm.optionsThose are just about the few changes we would make on ES.
Running Elasticsearch
Start and enable Elasticsearch to run on system boot;
systemctl enable --now elasticsearchTo check the status;
systemctl status elasticsearchYou can as well verify ES status using curl command. Replace the IP accordingly.
curl http://IP-Address:9200If you get such an output, then all is well.
{
  "name" : "debian11",
  "cluster_name" : "kifarunix-demo",
  "cluster_uuid" : "HBhGJdjbTAWXkSZ5rm2bwQ",
  "version" : {
    "number" : "7.14.0",
    "build_flavor" : "default",
    "build_type" : "deb",
    "build_hash" : "dd5a0a2acaa2045ff9624f3729fc8a6f40835aa1",
    "build_date" : "2021-07-29T20:49:32.864135063Z",
    "build_snapshot" : false,
    "lucene_version" : "8.9.0",
    "minimum_wire_compatibility_version" : "6.8.0",
    "minimum_index_compatibility_version" : "6.0.0-beta1"
  },
  "tagline" : "You Know, for Search"
}
Install Kibana on Debian 11
Since we already setup Elastic repos, simply install Kibana by running the command;
apt install kibanaConfiguring Kibana
Kibana is set to run on localhost:5601 by default.
To allow external access, edit the configuration file and replace the value of server.host with an interface IP.
sed -i '/server.port:/s/^#//' /etc/kibana/kibana.yml sed -i '/server.host:/s/^#//;s/localhost/192.168.58.25/' /etc/kibana/kibana.ymlSet the Elasticsearch URL. In this setup, Elasticsearch is listening on 192.168.58.25:9200. Hence, replace the address accordingly.
sed -i '/elasticsearch.hosts:/s/^#//;s/localhost/192.168.58.25/' /etc/kibana/kibana.ymlIf you need to secure Kibana by proxying it with Nginx, you can check how to on our previous by following the link below;
Configure Nginx with SSL to Proxy Kibana
Running Kibana
Once the installation is done, start and enable Kibana to run on system boot.
systemctl enable --now kibanaAccess Kibana Dashboard
You can now access Kibana from your browser using the url, http://<server-IP>:5601.
If UFW is running, Open Kibana port;
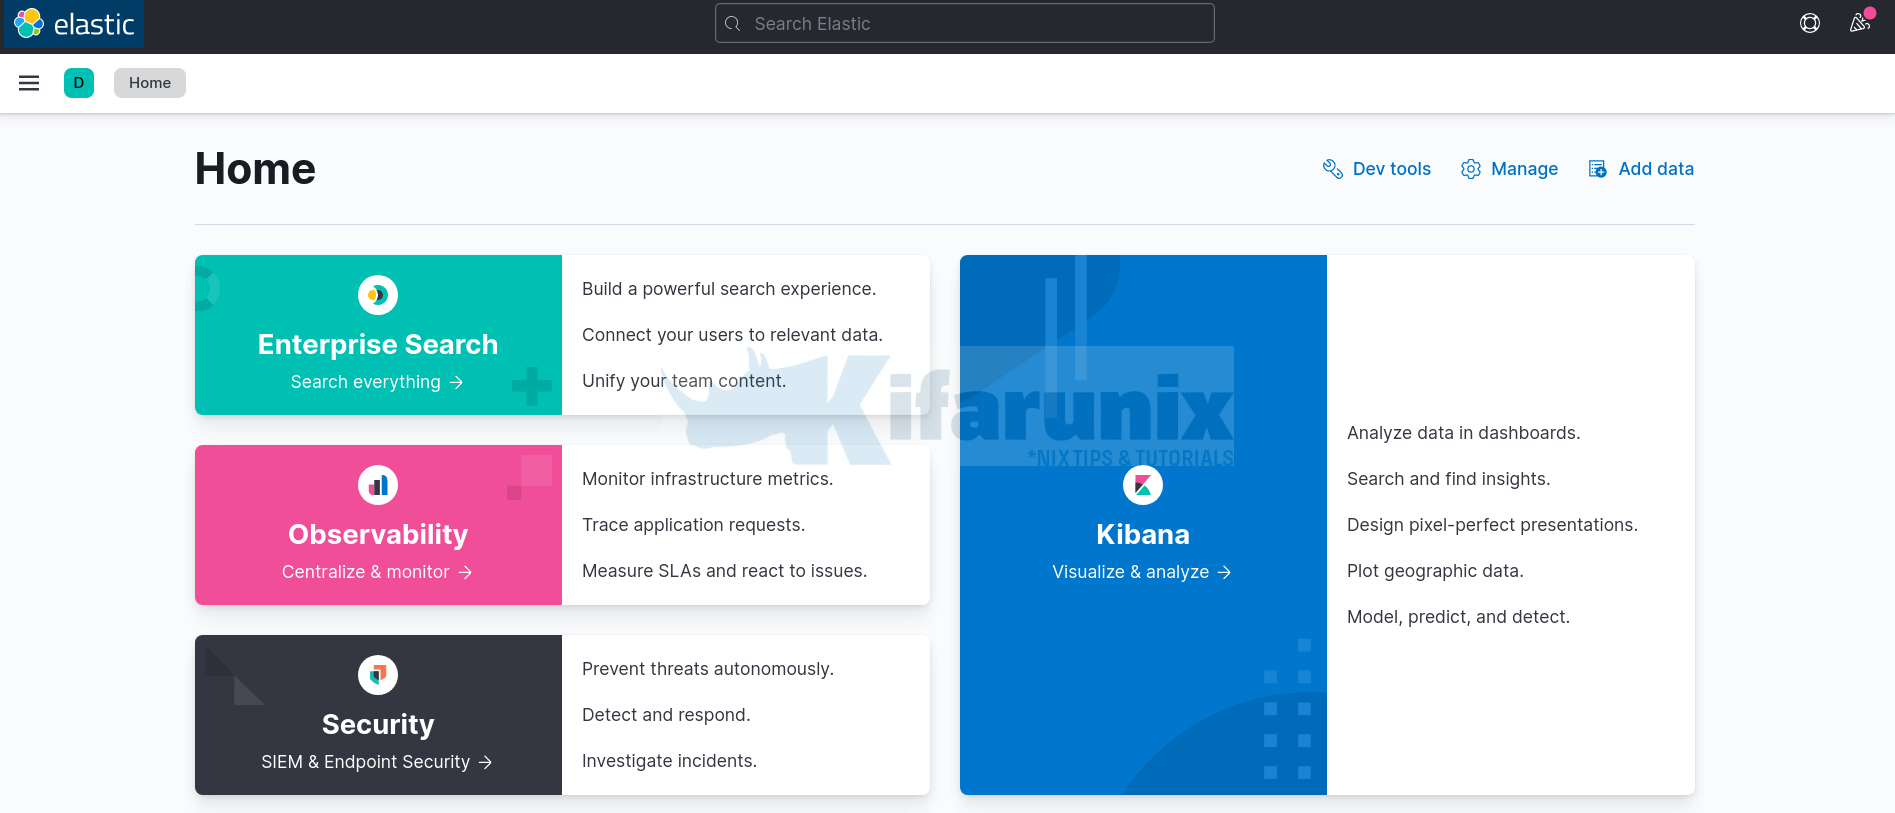
ufw allow 5601/tcpUpon accessing Kibana interface, on the welcome page, you are prompted on whether to get started with Kibana sample data. Since we do not have any data in our cluster yet, just click Explore on my own. and proceed to Kibana interface.

Install Logstash on Debian 11
Logstash is optional. However, if you want to install, simply run the command below;
apt install logstashOnce the installation is done, configure Logstash to process any data to be collected from the remote hosts. Follow the link below to learn how to configure Logstash.
How to Configure Logstash data processing pipeline
Install Filebeat on Debian 11
Filebeat is a lightweight shipper for collecting, forwarding and centralizing event log data.
It is installed as an agent on the servers you are collecting logs from. It can forward the logs it is collecting to either Elasticsearch or Logstash for indexing.
To install Filebeat from Elastic repos;
apt install filebeatConfigure Filebeat to Collect System Logs
Once the installation is done, you can configure Filebeat to collect various logs.
In this setup, Filebeat is installed on Elastic node.
Filebeat Modules
Filebeat modules simplify the collection, parsing, and visualization of common log formats.
Modules are disabled by default;
filebeat modules listEnabled:
Disabled:
activemq
apache
auditd
aws
awsfargate
azure
barracuda
bluecoat
cef
checkpoint
cisco
coredns
crowdstrike
cyberark
cyberarkpas
cylance
elasticsearch
envoyproxy
f5
fortinet
gcp
google_workspace
googlecloud
gsuite
haproxy
ibmmq
icinga
iis
imperva
infoblox
iptables
juniper
kafka
kibana
logstash
microsoft
misp
mongodb
mssql
mysql
mysqlenterprise
nats
netflow
netscout
nginx
o365
okta
oracle
osquery
panw
pensando
postgresql
proofpoint
rabbitmq
radware
redis
santa
snort
snyk
sonicwall
sophos
squid
suricata
system
threatintel
tomcat
traefik
zeek
zookeeper
zoom
zscaler
The modules configuration files reside on /etc/filebeat/modules.d/ directory.
Disabled modules have .disabled suffixed on their configuration files.
ls /etc/filebeat/modules.d/activemq.yml.disabled crowdstrike.yml.disabled haproxy.yml.disabled misp.yml.disabled osquery.yml.disabled sophos.yml.disabled
apache.yml.disabled cyberarkpas.yml.disabled ibmmq.yml.disabled mongodb.yml.disabled panw.yml.disabled squid.yml.disabled
auditd.yml.disabled cyberark.yml.disabled icinga.yml.disabled mssql.yml.disabled pensando.yml.disabled suricata.yml.disabled
awsfargate.yml.disabled cylance.yml.disabled iis.yml.disabled mysqlenterprise.yml.disabled postgresql.yml.disabled system.yml.disabled
aws.yml.disabled elasticsearch.yml.disabled imperva.yml.disabled mysql.yml.disabled proofpoint.yml.disabled threatintel.yml.disabled
azure.yml.disabled envoyproxy.yml.disabled infoblox.yml.disabled nats.yml.disabled rabbitmq.yml.disabled tomcat.yml.disabled
barracuda.yml.disabled f5.yml.disabled iptables.yml.disabled netflow.yml.disabled radware.yml.disabled traefik.yml.disabled
bluecoat.yml.disabled fortinet.yml.disabled juniper.yml.disabled netscout.yml.disabled redis.yml.disabled zeek.yml.disabled
cef.yml.disabled gcp.yml.disabled kafka.yml.disabled nginx.yml.disabled santa.yml.disabled zookeeper.yml.disabled
checkpoint.yml.disabled googlecloud.yml.disabled kibana.yml.disabled o365.yml.disabled snort.yml.disabled zoom.yml.disabled
cisco.yml.disabled google_workspace.yml.disabled logstash.yml.disabled okta.yml.disabled snyk.yml.disabled zscaler.yml.disabled
coredns.yml.disabled gsuite.yml.disabled microsoft.yml.disabled oracle.yml.disabled sonicwall.yml.disabled
To enable a module, use the command;
filebeat modules enable name-of-moduleFor the purposes of simplicity, we have configured Filebeat to collect syslog and authentication logs via the Filebeat system module.
To enable system module, run the command;
filebeat modules enable systemBy default, this module collect system and auth events. See the default config contents.
cat /etc/filebeat/modules.d/system.yml# Module: system
# Docs: https://www.elastic.co/guide/en/beats/filebeat/7.x/filebeat-module-system.html
- module: system
# Syslog
syslog:
enabled: true
# Set custom paths for the log files. If left empty,
# Filebeat will choose the paths depending on your OS.
#var.paths:
# Authorization logs
auth:
enabled: true
# Set custom paths for the log files. If left empty,
# Filebeat will choose the paths depending on your OS.
#var.paths
Configure Filebeat Output
Filebeat can send the collected data to various outputs. We are using Elasticsearch in this case.
You can update your output accordingly;
vim /etc/filebeat/filebeat.yml# ---------------------------- Elasticsearch Output ----------------------------
output.elasticsearch:
# Array of hosts to connect to.
hosts: ["192.168.58.25:9200"]Filebeat Logging
Add the lines below at the end of the configuration file to configure Filebeat to write logs to its own log file instead of writing to syslog log file.
logging.level: info
logging.to_files: true
logging.files:
  path: /var/log/filebeat
  name: filebeat
  keepfiles: 7
  permissions: 0644
Filebeat Test Config
To test the configuration settings, run the command;
filebeat test configYou should get the output,Config OK, if there is no issue.
Filebeat Test Output;
filebeat test outputelasticsearch: http://192.168.58.25:9200...
parse url... OK
connection...
parse host... OK
dns lookup... OK
addresses: 192.168.58.25
dial up... OK
TLS... WARN secure connection disabled
talk to server... OK
version: 7.14.0
Load Filebeat Default Dashboards to Kibana
Load sample dashboards to Kibana. Replace the addresses accordingly
filebeat setup -e -E output.elasticsearch.hosts=['192.168.58.25:9200'] -E setup.kibana.host=192.168.58.25:5601You can read more on loading Kibana dashboards.
Restart Filebeat;
systemctl restart filebeatEnsure that connection is Established with the output;
tail -f /var/log/filebeat/filebeatLook for a line:
Connection to backoff(elasticsearch(http://192.168.58.25:9200)) establishedVerify Elasticsearch Index Data Reception
Once you have configured Filebeat to ship logs to Elasticsearch you can verify is any data has been written to the index defined.
For example, By default, Filebeat creates an index, filebeat-%{BEATS_VERSION}-*..
This can be verified by querying status of ES indices. Replace ES_IP with Elasticsearch IP address.
curl -XGET http://ES_IP:9200/_cat/indices?vhealth status index uuid pri rep docs.count docs.deleted store.size pri.store.size
green open .geoip_databases TPscSzZvTzuoaJLvdiWlGA 1 0 42 0 40.8mb 40.8mb
green open .kibana-event-log-7.14.0-000001 WdyhZsMdTki0hvFD26Ak2g 1 0 1 0 5.6kb 5.6kb
green open .kibana_7.14.0_001 w7Z8x3fNStu-L7Nwvfz0zw 1 0 20 9 2.1mb 2.1mb
green open .apm-custom-link exbd7_fXRO22JaVY-0L1HQ 1 0 0 0 208b 208b
yellow open filebeat-7.14.0-2021.08.28-000001 m4YpQ3_FTQ-PvhJdfKU6mQ 1 1 15982 0 2.9mb 2.9mb
green open .apm-agent-configuration _g73JKNBTfW2yE8qdf37Ag 1 0 0 0 208b 208b
green open .kibana_task_manager_7.14.0_001 QzhwGQMYR9Gz_STeurQkaw 1 0 14 8301 996kb 996kb
From the output, you can see that our filebeat-7.14.0-* index has data. For health color status, read more on Cluster Health API.
You can also check on Kibana UI (Management tab (on the left side panel) > Stack Management > Data > Index Management > Indices)

Create Kibana Index Patterns
To visualize your data, you need to create the Kibana index pattern.
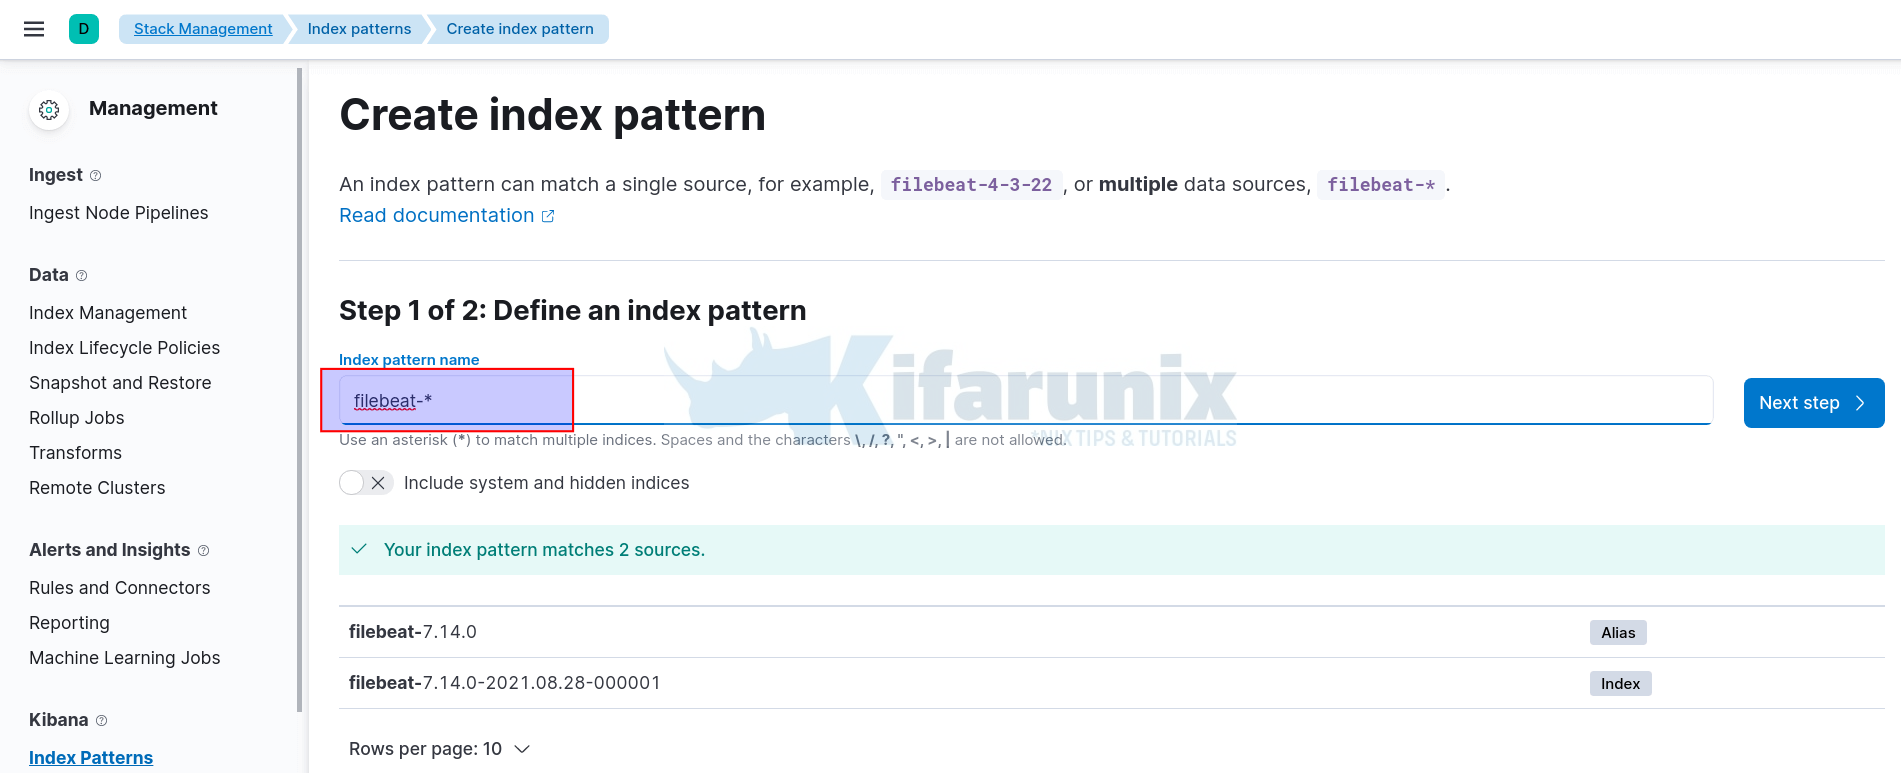
Click on Management tab (on the left side panel) > Stack Management > Kibana> Index Patterns > Create Index Pattern.
Enter the wildcard for your index name.

Click Next and select timestamp as the time filter.

Then click Create Index pattern to create your index pattern.
View Data on Kibana
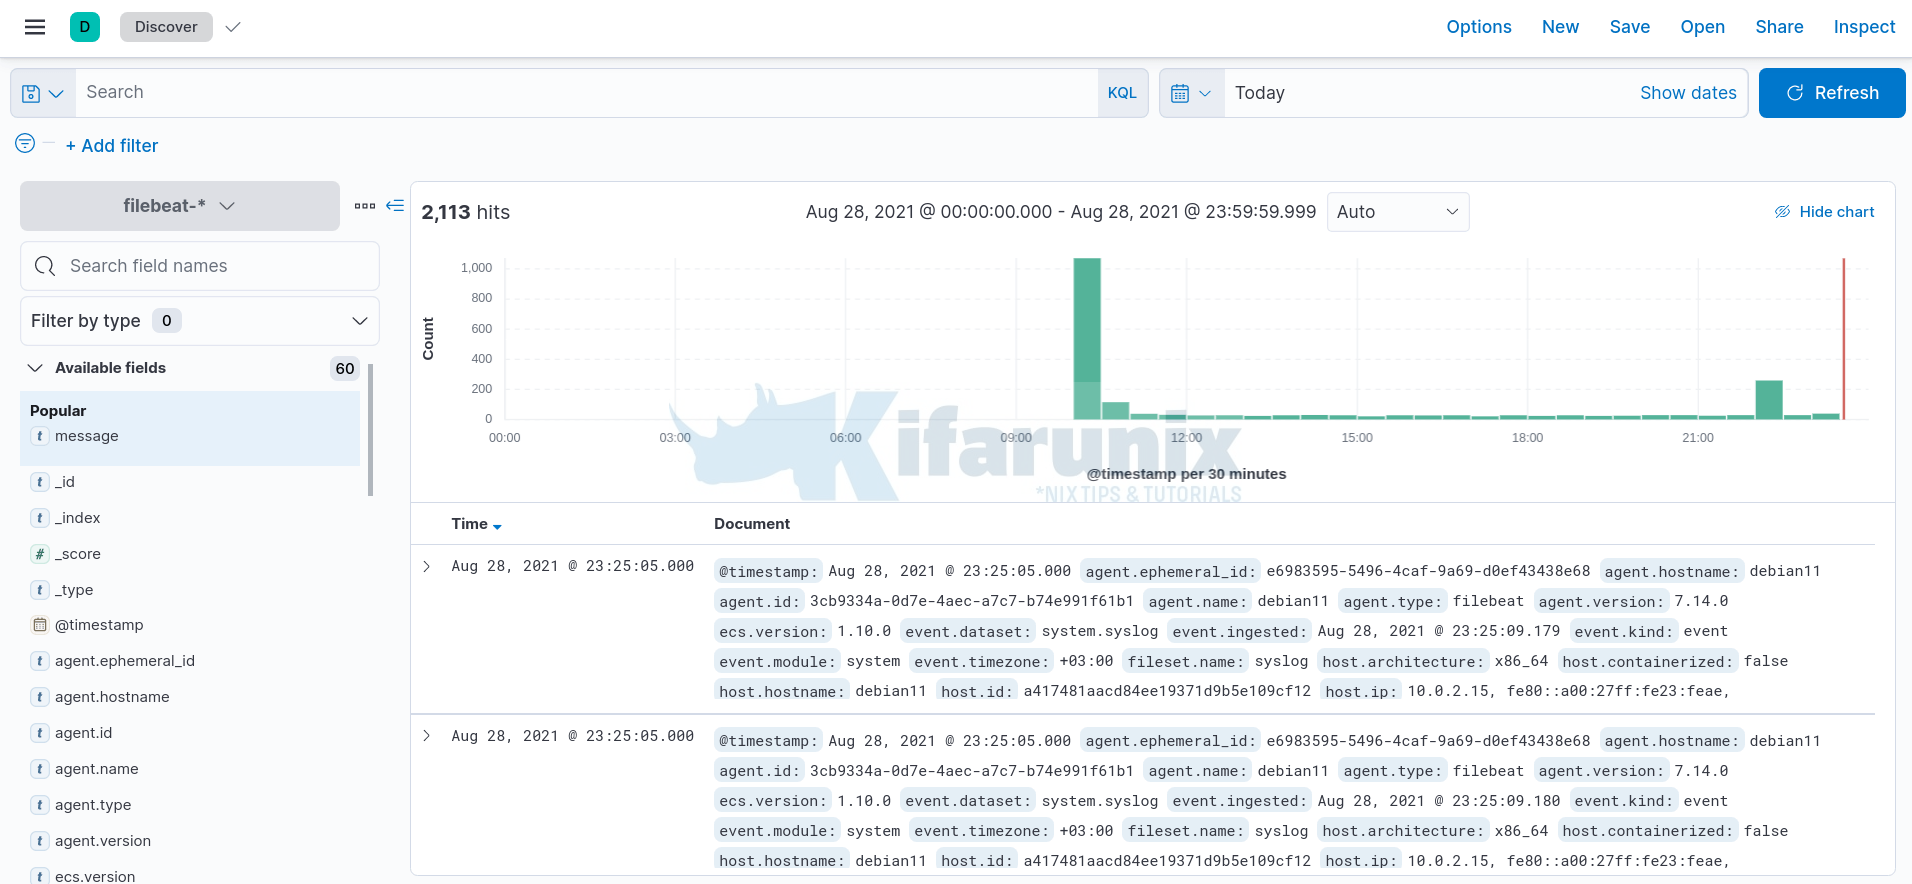
Once that is done, you can now view your event data on Kibana by clicking on the Discover tab on the left pane.
Expand your time range accordingly.

And there you go.
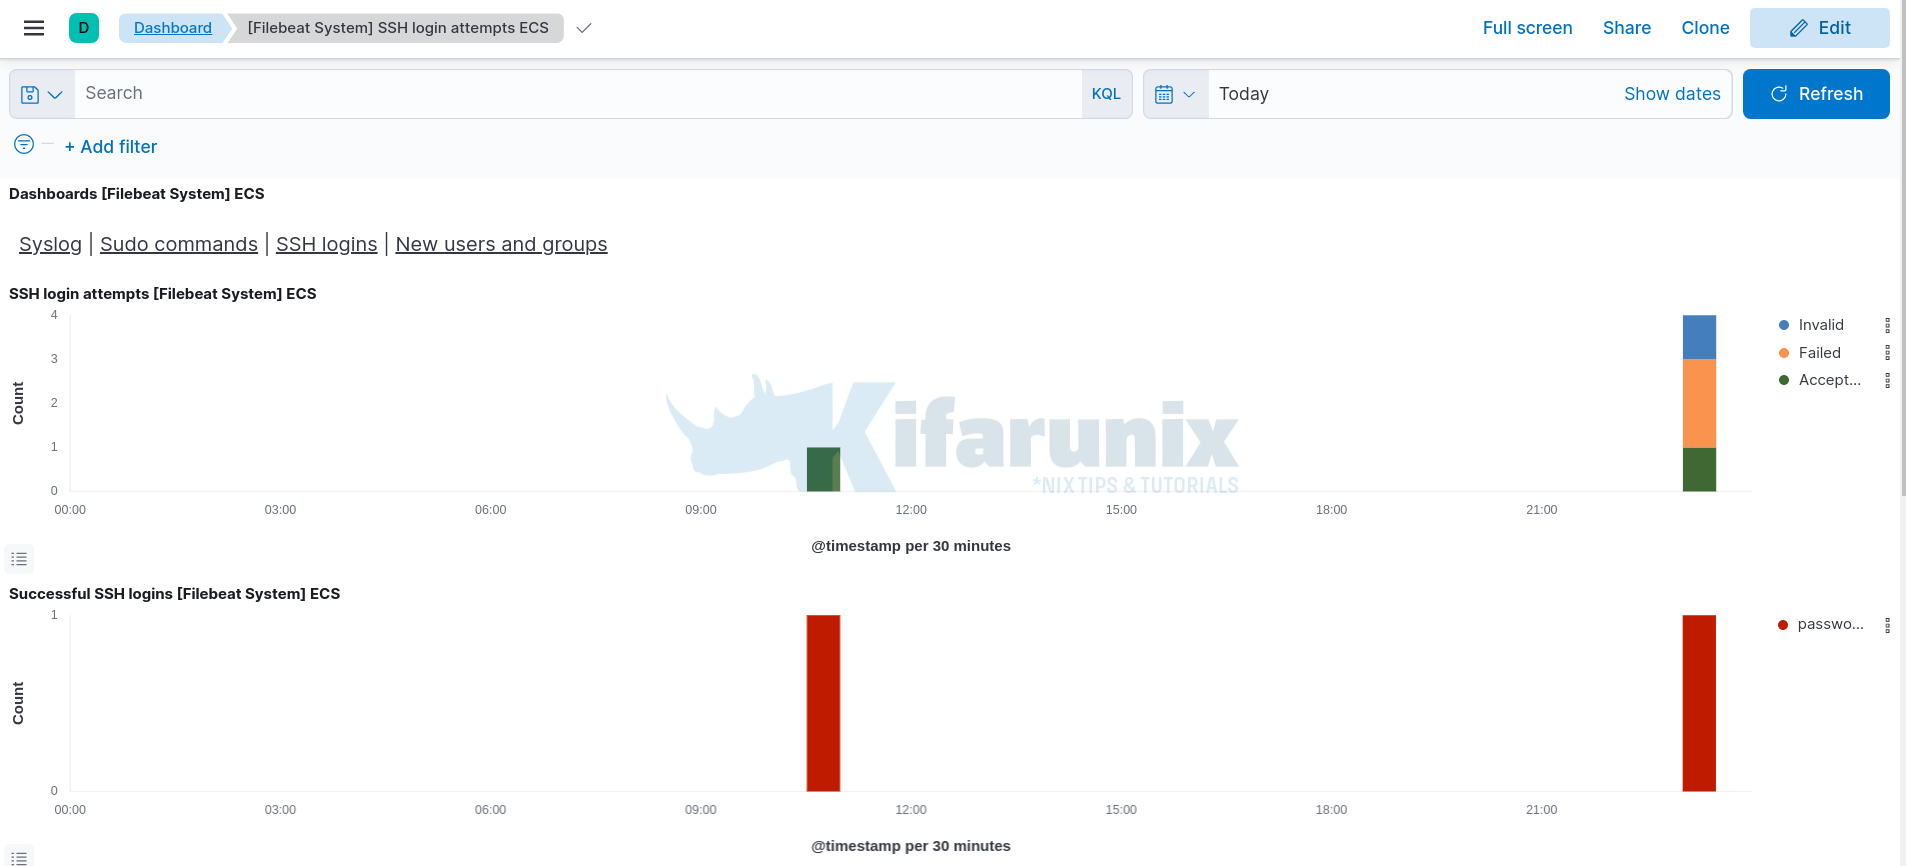
Sample dashboards, at least for SSH/syslog events;

Reference
Related Tutorials
Installing ELK Stack on CentOS 8
Install Elastic Stack 7 on Fedora 30/Fedora 29/CentOS 7

