Learn how to install Zabbix Agent on CentOS 7 for Zabbix monitoring. In our previous guides, we covered the installation of Zabbix Server on Debian 10 Buster. This guide will focus on monitoring remote Linux hosts using Zabbix, specifically CentOS 7 host and the related RHEL hosts.
Before you can continue, ensure that your Zabbix server is up and running. See the links below on how to install and configure Zabbix server on Debian 10 Buster.
Install Zabbix 4.x from Sources on Debian 10 Buster
Install Zabbix Server from APT on Debian 10 Buster
Installing Zabbix Agent on CentOS 7
In order to monitor Linux hosts with Zabbix, you need to install Zabbix agents on them. In this guide, we are use CentOS 7 as our hosts to monitor with Zabbix.
Install Zabbix Agent
Update and upgrade your system packages.
yum update
yum upgrade
Install Zabbix Repository
yum install https://repo.zabbix.com/zabbix/4.2/rhel/7/x86_64/zabbix-release-4.2-1.el7.noarch.rpmInstall Zabbix Agent on CentOS 7
yum install zabbix-agentConfigure Zabbix Agent
Once the installation is done, proceed to configure Zabbix agent in order for it to communicate with Zabbix server for monitoring.
The default zabbix agent configuration file is /etc/zabbix/zabbix_agentd.conf.
Edit the configuration file and set the Zabbix server IP for both the passive and active checks and Zabbix agent hostname.
vim /etc/zabbix/zabbix_agentd.conf...
Server=192.168.43.62 ## IP for Zabbix Server
...
ServerActive=192.168.43.62
...
Hostname=centos7.example.comIf firewalld is running, allow Zabbix ports for passive checks.
firewall-cmd --add-port=10050/tcp --permanent
firewall-cmd --reload
Running Zabbix Agent
After the configuration, start and enable Zabbix agent to run on system boot.
systemctl start zabbix-agent
systemctl enable zabbix-agent
To check the status;
systemctl status zabbix-agent
● zabbix-agent.service - Zabbix Agent
   Loaded: loaded (/usr/lib/systemd/system/zabbix-agent.service; enabled; vendor preset: disabled)
   Active: active (running) since Sat 2019-08-10 09:23:31 EAT; 36s ago
 Main PID: 15253 (zabbix_agentd)
   CGroup: /system.slice/zabbix-agent.service
           ├─15253 /usr/sbin/zabbix_agentd -c /etc/zabbix/zabbix_agentd.conf
           ├─15254 /usr/sbin/zabbix_agentd: collector [idle 1 sec]
           ├─15255 /usr/sbin/zabbix_agentd: listener #1 [waiting for connection]
           ├─15256 /usr/sbin/zabbix_agentd: listener #2 [waiting for connection]
           ├─15257 /usr/sbin/zabbix_agentd: listener #3 [waiting for connection]
           └─15258 /usr/sbin/zabbix_agentd: active checks #1 [idle 1 sec]
Add CentOS 7 Host to Zabbix Server
The Zabbix agent is installed and running on CentOS 7 host. Now it is time to add the agent to the server for monitoring. Login to Zabbix server and navigate to Configuration > Hosts > Create host to add your host.
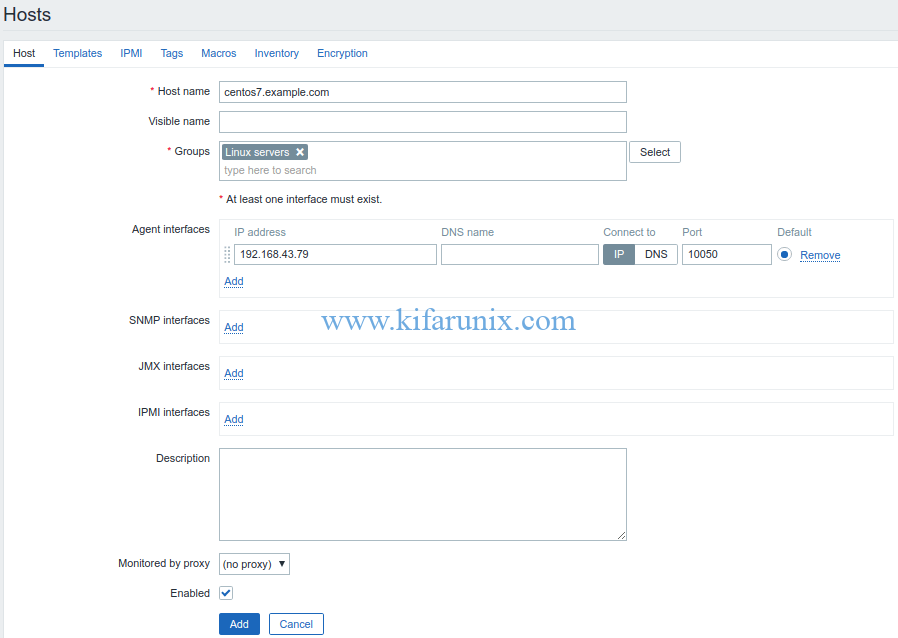
Configure the Host details like the hostname, visible (if you want), Groups (Linux Servers for example), IP address. Other details are optional.
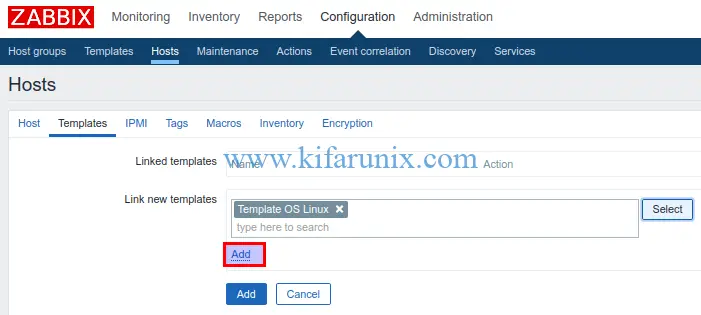
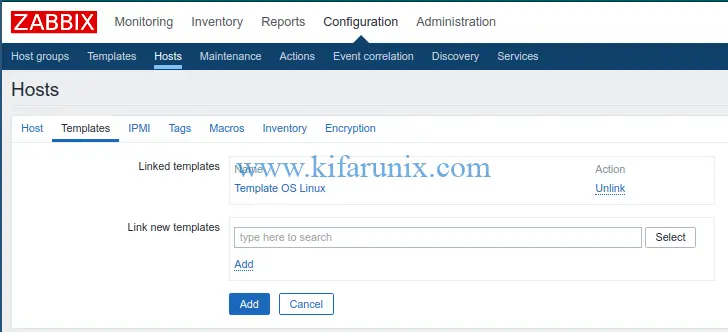
Next, you need to configure host template. Click on Templates > Link new templates. Click select button and choose Template OS Linux. Once selected, click the add button to add the template.
When templated is added and linked to your host, it should look like;
You can learn more about Zabbix templates on Zabbix Documentation page.
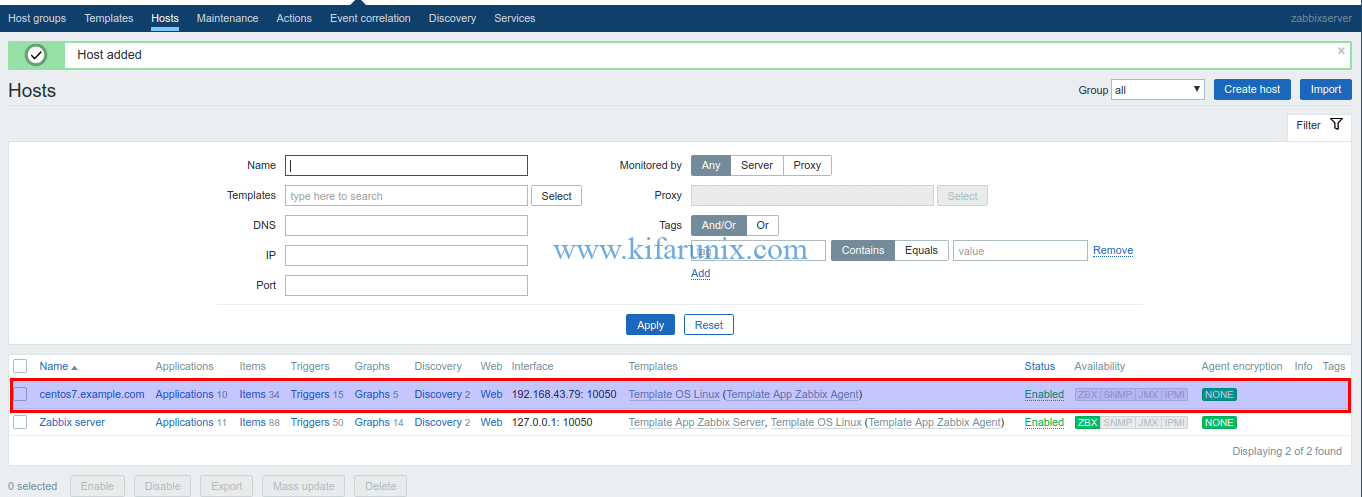
Next, click Add to add the host to Zabbix server. The list of hosts is then displayed.
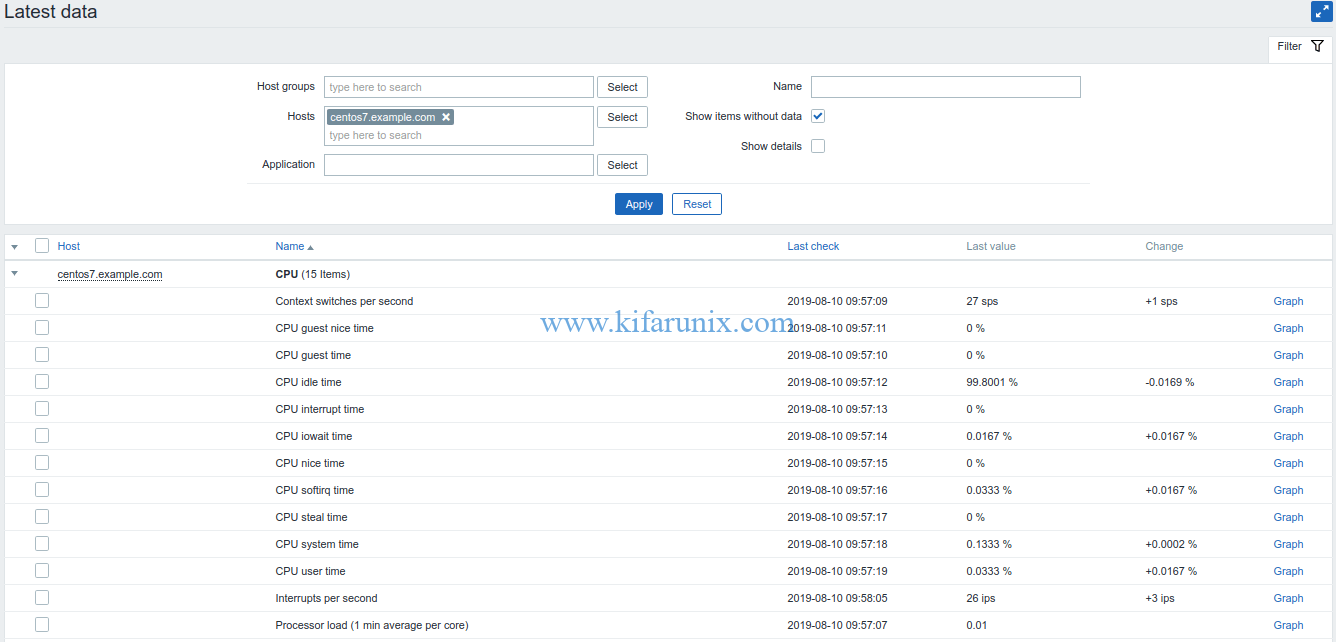
CentOS 7 is now added to Zabbix server for monitoring. To check for the data collected from the host, click Monitoring > Latest data. Select the host and click Apply.
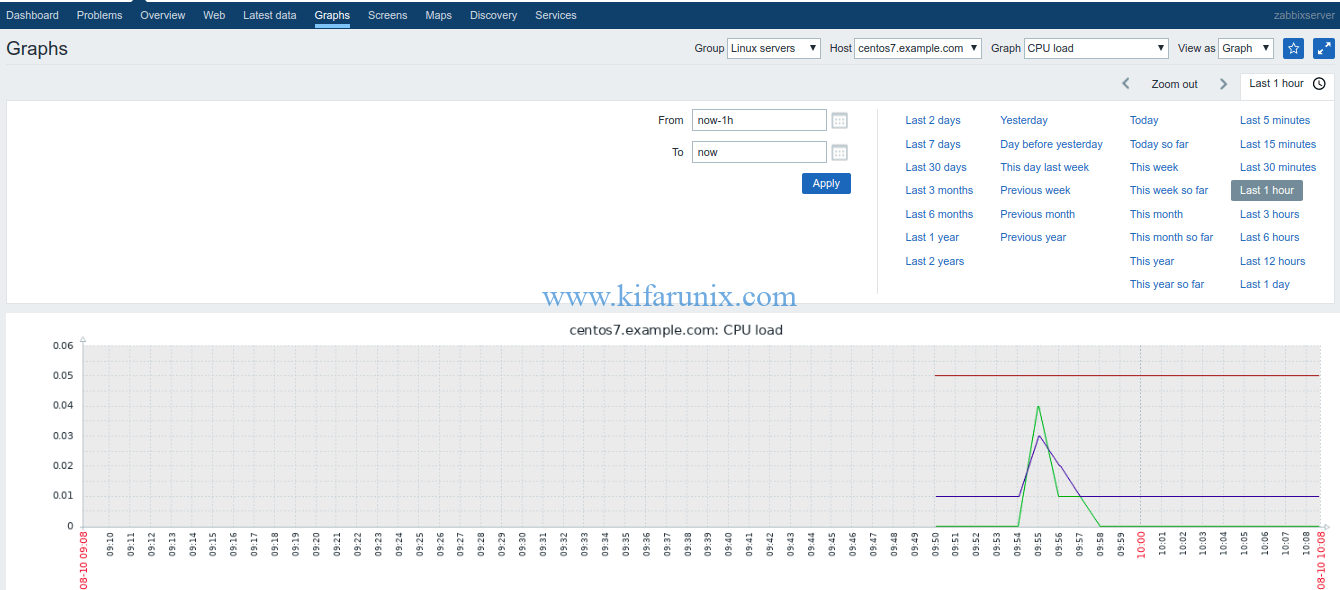
You can also check the data graphs. Click Monitoring > Graphs > Group (Linux Servers) > Graph (say, CPU Load) > Host (centos7.example.com) > View as (Graph). Select the time range, last 1 hour
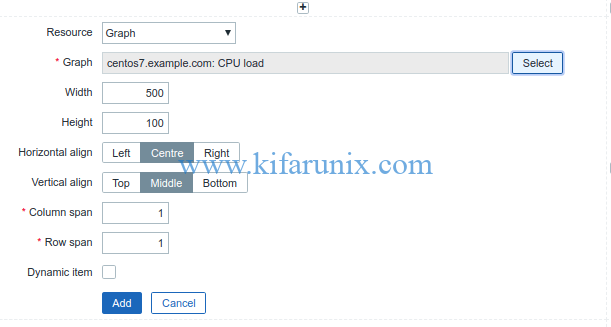
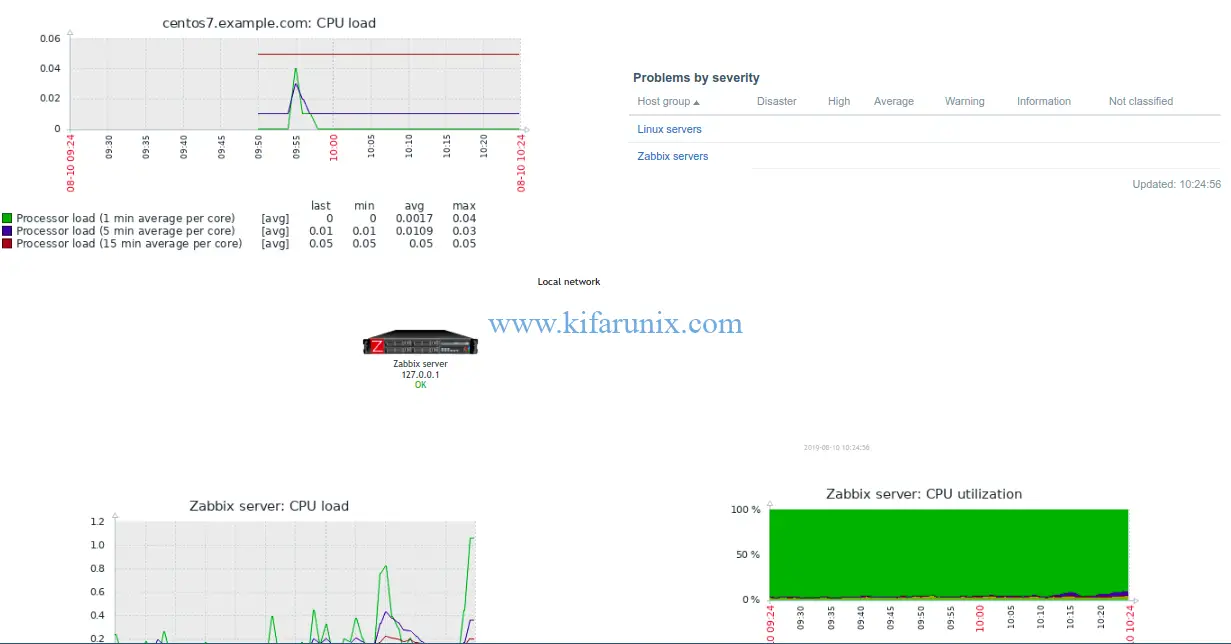
You can also add the graphs to Zabbix Screens. Click on Screens > Edit Screens. Click the plus (+) on wherever you want to add your graph and click change. Screen configuration wizard opens up. Choose the graph to add to your screen, for example, CPU Load.
You can leave other settings as default and click Add to create the graph. You can add as many resources to your screen as possible.
Related Tutorials;
Install Zabbix Agent on Debian 10 Buster
Install Zabbix Agent on FreeBSD 12
How to Install Nagios Plugins and NRPE agents on CentOS 7/RHEL 7/Fedora 29
How to Install Nagios Plugins From Source RHEL/CentOS/Oracle Linux

