Welcome to our demo on how to install ELK Stack on Rocky Linux 8.
ELK is the acronym for three open source projects: Elasticsearch, Logstash, and Kibana. Elasticsearch is a search and analytics engine. Logstash is a server‑side data processing pipeline that ingests data from multiple sources simultaneously, transforms it, and then sends it to a “stash” like Elasticsearch. Kibana lets users visualize data in Elasticsearch with charts and graphs.
Installing ELK Stack on Rocky Linux 8
The order of installation of the Elastic Stack components is of great importance. It usually takes the order Elasticsearch > Kibana > Logstash > Beats. Also note that all components should be of the same versions.
To install Elastic Stack components on Rocky Linux 8 system, you can choose to create the Elastic RPM repo or install each component using their respective RPM binary.
We use the Elastic repositories in this guide.
Creating Elastic Stack RPM Repo on Rocky Linux 8
Elastic Stack version 7.x repo can be created by running the command below.
cat > /etc/yum.repos.d/elasticstack.repo << EOL
[elasticsearch]
name=Elasticsearch repository for 7.x packages
baseurl=https://artifacts.elastic.co/packages/7.x/yum
gpgcheck=1
gpgkey=https://artifacts.elastic.co/GPG-KEY-elasticsearch
enabled=1
autorefresh=1
type=rpm-md
EOL
Run system package update.
dnf updateInstall Elasticsearch on Rocky Linux 8
You can install Elasticsearch on Rocky Linux 8 from the created Elastic RPM repos
dnf install elasticsearchConfiguring Elasticsearch
Out of the box, Elasticsearch works well with the default configuration options. In this demo, we are going to however make a few changes as per Important Elasticsearch Configurations.
Set the Elasticsearch bind address to a specific IP if you need to enable remote access either from Kibana or Logstash or from Beats. Replace the IP, 192.168.56.154, with your appropriate server IP address.
sed -i 's/#network.host: 192.168.0.1/network.host: 192.168.60.19/' /etc/elasticsearch/elasticsearch.ymlYou can as well leave the default settings to only allow local access to Elasticsearch.
When configured to listen on a non-loopback interface, Elasticsearch expects to join a cluster when started. But since we are setting up a single node Elastic Stack, you need to define in the ES configuration that this is a single node setup, by entering the line, discovery.type: single-node, under discovery configuration options. However, you can skip this if your ES is listening on a loopback interface.
vim /etc/elasticsearch/elasticsearch.yml# --------------------------------- Discovery ----------------------------------
#
# Pass an initial list of hosts to perform discovery when this node is started:
# The default list of hosts is ["127.0.0.1", "[::1]"]
#
#discovery.seed_hosts: ["host1", "host2"]
#
# Bootstrap the cluster using an initial set of master-eligible nodes:
#
#cluster.initial_master_nodes: ["node-1", "node-2"]
# Single Node Discovery
discovery.type: single-nodeNext, configure JVM heap size to no more than half the size of your memory. In this case, our test server has 2G RAM and the heap size is set to 512M for both maximum and minimum sizes.
vim /etc/elasticsearch/jvm.options...
################################################################
# Xms represents the initial size of total heap space
# Xmx represents the maximum size of total heap space
-Xms512m
-Xmx512m
...Start and enable ES to run on system boot.
systemctl daemon-reloadsystemctl enable --now elasticsearchVerify that Elasticsearch is running as expected.
curl -XGET 192.168.60.19:9200
{
  "name" : "localhost.localdomain",
  "cluster_name" : "elasticsearch",
  "cluster_uuid" : "Ga4BA59FTcqPtAPzaUaezw",
  "version" : {
    "number" : "7.13.2",
    "build_flavor" : "default",
    "build_type" : "rpm",
    "build_hash" : "4d960a0733be83dd2543ca018aa4ddc42e956800",
    "build_date" : "2021-06-10T21:01:55.251515791Z",
    "build_snapshot" : false,
    "lucene_version" : "8.8.2",
    "minimum_wire_compatibility_version" : "6.8.0",
    "minimum_index_compatibility_version" : "6.0.0-beta1"
  },
  "tagline" : "You Know, for Search"
}
Install Kibana on Rocky Linux 8
The next Elastic Stack component to install is Kabana. Since we already created the Elastic Stack repos, you can simply run the command below to install it.
dnf install kibanaConfiguring Kibana
To begin with, you need to configure Kibana to allow remote access. It usually only allows local access on port 5601/tcp by default. Hence, open the Kibana configuration file for editing and uncomment and change the following lines;
vim /etc/kibana/kibana.yml...
#server.port: 5601
...
# To allow connections from remote users, set this parameter to a non-loopback address.
#server.host: "localhost"
...
# The URLs of the Elasticsearch instances to use for all your queries.
#elasticsearch.hosts: ["http://localhost:9200"]Such that it look like as shown below:
Replace the IP addresses of Kibana and Elasticsearch accordingly. Note that in this demo, All Elastic Stack components are running on the same host.
...
server.port: 5601
...
# To allow connections from remote users, set this parameter to a non-loopback address.
server.host: "192.168.60.19"
...
# The URLs of the Elasticsearch instances to use for all your queries.
elasticsearch.hosts: ["http://192.168.60.19:9200"]
Start and enable Kibana to run on system boot.
systemctl enable --now kibanaChecking the status;
● kibana.service - Kibana
   Loaded: loaded (/etc/systemd/system/kibana.service; disabled; vendor preset: disabled)
   Active: active (running) since Thu 2021-07-01 20:06:15 EAT; 9s ago
     Docs: https://www.elastic.co
 Main PID: 3594 (node)
    Tasks: 14 (limit: 4938)
   Memory: 114.1M
   CGroup: /system.slice/kibana.service
           ├─3594 /usr/share/kibana/bin/../node/bin/node /usr/share/kibana/bin/../src/cli/dist --logging.dest=/var/log/kibana/kibana.log --pid.file=/run/kibana/kibana.pid
           └─3606 /usr/share/kibana/node/bin/node --preserve-symlinks-main --preserve-symlinks /usr/share/kibana/src/cli/dist --logging.dest=/var/log/kibana/kibana.log --p>

Jul 01 20:06:15 localhost.localdomain systemd[1]: Started Kibana.
Open Kibana Port on FirewallD, if it is running;
firewall-cmd --add-port=5601/tcp --permanentfirewall-cmd --reloadAccessing Kibana Interface
You can now access Kibana from your browser by using the URL, http://kibana-server-hostname-OR-IP:5601.
On Kibana web interface, you can choose to try sample data since there is no data being sent to Elasticsearch yet. You can as well choose to explore your own data, but of course after sending data to ES.
Install Logstash on Rocky Linux 8
This is optional, by the way
Logstash is the component of Elastic Stack that does further processing of the event data before sending it to the Elasticsearch data store. For example, you can develop custom regex, grok patterns to extract specific fields from the event data.
It is also possible to directly sent the data to Elasticsearch instead of passing them through Logstash.
To install Logstash on Rocky Linux 8.
dnf install logstashTesting Logstash
Once the installation of Logstash is done, you can verify that it is ready to process event data by running the basic pipeline command as shown below;
/usr/share/logstash/bin//logstash -e 'input { stdin { } } output { stdout {} }'Press ENTER to execute the command and wait for the Pipeline to be ready to receive input data (The stdin plugin is now waiting for input:).
...
[INFO ] 2021-07-01 20:50:03.470 [LogStash::Runner] agent - No persistent UUID file found. Generating new UUID {:uuid=>"99d0b8b2-3130-413d-bb95-5be99ac6e138", :path=>"/usr/share/logstash/data/uuid"}
[INFO ] 2021-07-01 20:50:05.404 [Api Webserver] agent - Successfully started Logstash API endpoint {:port=>9600}
...
...
[INFO ] 2021-07-01 20:50:09.164 [[main]-pipeline-manager] javapipeline - Pipeline started {"pipeline.id"=>"main"}
[INFO ] 2021-07-01 20:50:09.226 [Agent thread] agent - Pipelines running {:count=>1, :running_pipelines=>[:main], :non_running_pipelines=>[]}
The stdin plugin is now waiting for input:
Type any string, for example, testing Logstash pipeline and press ENTER.
Logstash process the input data and adds timestamp and host address information to the message.
The stdin plugin is now waiting for input:
testing Logstash pipeline << PRESS ENTER AFTER THIS LINE
{
      "@version" => "1",
    "@timestamp" => 2021-07-01T18:06:31.822Z,
          "host" => "elk.kifarunix-demo.com",
       "message" => "testing Logstash pipeline"
}
You can stop Logstash pipeline by pressing Ctrl+D.
Configuring Logstash to Collect and Sent Events to Elasticsearch
Logstash is now ready to receive and process data. In this demo, we are going to learn how to configure Logstash pipeline to collect events from a local system.
Logstash pipeline is made up of three sections;
- the input: collect data from different sources
- the filter: (Optional) performs further processing on data.
- the output: stashes received data into a destination datastore such as Elasticsearch.
Configure Logstash Input plugin
You can configure beats to sent data to Logstash or simply read local files on the system. To collect events from the local system, we are going to use the file input plugin.
There are multiple input plugins you can use, check them on Logstash Input Plugins.
In this demo, we are using a single configuration file to define the pipeline components; input, filters, output.
vim /etc/logstash/conf.d/local-ssh-events.conf## Collect System Authentication events from /var/log/secure
input {
file {
path => "/var/log/secure"
type => "ssh_auth"
}Configure Logstash Filter plugin
Configure Logstash filter to extract only relevant events such as the lines below from the /var/log/secure file.
Jul 1 21:45:34 localhost sshd[13707]: Failed password for invalid user gentoo from 192.168.60.18 port 53092 ssh2
Jul 1 21:45:50 localhost sshd[13768]: Failed password for invalid user KIFARUNIX from 192.168.60.18 port 53094 ssh2
Jul 1 21:47:14 localhost sshd[13949]: Failed password for root from 192.168.60.18 port 53112 ssh2
Jul 1 21:47:17 localhost sshd[13949]: Accepted password for root from 192.168.60.18 port 53112 ssh2We are using Grok Filters to process extract these lines from the log file;
vim /etc/logstash/conf.d/local-ssh-events.conf
## Collect System Authentication events from /var/log/secure
input {
  file {
    path => "/var/log/secure"
    type => "ssh_auth"
  }
}
filter {
if [type] == "ssh_auth" {
grok {
match => { "message" => "%{SYSLOGTIMESTAMP:timestamp}\s+%{IPORHOST:dst_host}\s+%{WORD:syslog_program}\[\d+\]:\s+(?<status>.+)\s+for\s+%{USER:auth_user}\s+from\s+%{SYSLOGHOST:src_host}.*" }
add_field => { "activity" => "SSH Logins" }
add_tag => "linux_auth"
}
grok {
match => { "message" => "%{SYSLOGTIMESTAMP:timestamp}\s+%{IPORHOST:dst_host}\s+%{WORD:syslog_program}\[\d+\]:\s+(?<status>.+)\s+for\s+invalid\s+user\s%{USER:auth_user_nonexist}\s+from\s+%{SYSLOGHOST:src_host}.*" }
add_field => { "activity" => "SSH Logins" }
add_tag => "linux_auth"
}
}
# Drop any message that doesn't contain the keywords below
if [message] !~ /(Failed password|Accepted password|Accepted publickey|for invalid)/ { drop { } }
}
Note the grok filter used above will just capture password based and public key SSH logins. You can use the Grok Debugger on Kibana to test your pattern, Dev-tools > Grok Debugger.
Also, note the filter;
if [message] !~ /(Failed password|Accepted password|Accepted publickey|for invalid)/ { drop { }For the purpose of demo and to capture only the logs we need for this demo, that line basically drops any other event log not containing the specified keywords above.
Configure Logstash Output Plugin
Next, we are going to sent our processed data to Elasticsearch running on the localhost.
Define Elasticsearch output.
vim /etc/logstash/conf.d/local-ssh-events.conf
## Collect System Authentication events from /var/log/secure
input {
  file {
    path => "/var/log/secure"
    type => "ssh_auth"
  }
}
filter {
  if [type] == "ssh_auth" {
    grok {
      match => { "message" => "%{SYSLOGTIMESTAMP:timestamp}\s+%{IPORHOST:dst_host}\s+%{WORD:syslog_program}\[\d+\]:\s+(?<status>.+)\s+for\s+%{USER:auth_user}\s+from\s+%{SYSLOGHOST:src_host}.*" }
      add_field => { "activity" => "SSH Logins" }
      add_tag => "linux_auth"
    }
    grok {
      match => { "message" => "%{SYSLOGTIMESTAMP:timestamp}\s+%{IPORHOST:dst_host}\s+%{WORD:syslog_program}\[\d+\]:\s+(?<status>.+)\s+for\s+invalid\s+user\s%{USER:auth_user_nonexist}\s+from\s+%{SYSLOGHOST:src_host}.*" }
      add_field => { "activity" => "SSH Logins" }
      add_tag => "linux_auth"
    }
  }
# Drop any message that doesn't contain the keywords below
  if [message] !~ /(Failed password|Accepted password|Accepted publickey|for invalid)/ { drop { } }
}
## Send data to Elasticsearch on the localhost
output {
elasticsearch {
hosts => ["192.168.60.19:9200"]
manage_template => false
index => "ssh_auth-%{+YYYY.MM}"
}
}
Ensure that Logstash can read the file being monitored, /var/log/secure. By default, file is owned by root. Therefore, for logstash to be able to read the file, first change the group ownership to adm, add logstash to the group adm, and assign read access to logstash.
chown :adm /var/log/secureusermod -aG adm logstashchmod g+r /var/log/secureVerify Logstash Grok Filters
Before you can sent the data to Elasticsearch, you need to verify the grok filters. Follow our guide below to learn how to debug grok patterns.
How to Debug Logstash Grok Filters
Verify Logstash Configuration
After the configurations, run the command below to verify the Logstash configuration before you can start it.
sudo -u logstash /usr/share/logstash/bin/logstash --path.settings /etc/logstash -t...
[2021-07-01T21:50:50,644][INFO ][org.reflections.Reflections] Reflections took 36 ms to scan 1 urls, producing 24 keys and 48 values
Configuration OK
[2021-07-01T21:50:52,005][INFO ][logstash.runner ] Using config.test_and_exit mode. Config Validation Result: OK. Exiting Logstash
...Configuration OK confirms that there is no error in the configuration file.
If you need to debug a specific Logstash pipeline configuration file, you can execute the command below. Replace the path to config file with your file path. Ensure logstash is not running when executing this command.
sudo -u logstash /usr/share/logstash/bin/logstash -f /etc/logstash/conf.d/local-ssh-events.conf --path.settings /etc/logstash/Running Logstash
You can start and enable Logstash to run on system boot.
systemctl enable --now logstashIf for some weird reasons Logstash did not generate the systemd service file with the symptom:(Failed to restart logstash.service: Unit logstash.service not found.)
Simply generate the service file by executing the command;
/usr/share/logstash/bin/system-install /etc/logstash/startup.options systemdYou can the start and enable it to run on boot as shown above.
To check the status;
systemctl status logstash
● logstash.service - logstash
   Loaded: loaded (/etc/systemd/system/logstash.service; disabled; vendor preset: disabled)
   Active: active (running) since Thu 2021-07-01 21:53:56 EAT; 6s ago
 Main PID: 15139 (java)
    Tasks: 15 (limit: 23673)
   Memory: 311.8M
   CGroup: /system.slice/logstash.service
           └─15139 /usr/share/logstash/jdk/bin/java -Xms1g -Xmx1g -XX:+UseConcMarkSweepGC -XX:CMSInitiatingOccupancyFraction=75 -XX:+UseCMSInitiatingOccupancyOnly -Djava.a>

Jul 01 21:53:56 elk.kifarunix-demo.com systemd[1]: Started logstash.
Jul 01 21:53:56 elk.kifarunix-demo.com logstash[15139]: Using bundled JDK: /usr/share/logstash/jdk
Jul 01 22:03:31 elk.kifarunix-demo.com logstash[16724]: OpenJDK 64-Bit Server VM warning: Option UseConcMarkSweepGC was deprecated in version 9.0 and will likely be remove>
Jul 01 22:03:48 elk.kifarunix-demo.com logstash[16724]: Sending Logstash logs to /var/log/logstash which is now configured via log4j2.properties
Jul 01 22:03:48 elk.kifarunix-demo.com logstash[16724]: [2021-07-01T22:03:48,814][INFO ][logstash.runner          ] Log4j configuration path used is: /etc/logstash/log4j2.>
Jul 01 22:03:48 elk.kifarunix-demo.com logstash[16724]: [2021-07-01T22:03:48,824][INFO ][logstash.runner          ] Starting Logstash {"logstash.version"=>"7.13.2", "jruby>
Jul 01 22:03:50 elk.kifarunix-demo.com logstash[16724]: [2021-07-01T22:03:50,369][INFO ][logstash.agent           ] Successfully started Logstash API endpoint {:port=>9600}
Confirm Data Reception on Elasticsearch Index
Perform some authentication to your system and head back to Kibana Interface > Management > Stack Management > Data > Index Management.
If your events have been received and forward to Elasticsearch, the defined index should now have been created.

Visualizing Data on Kibana
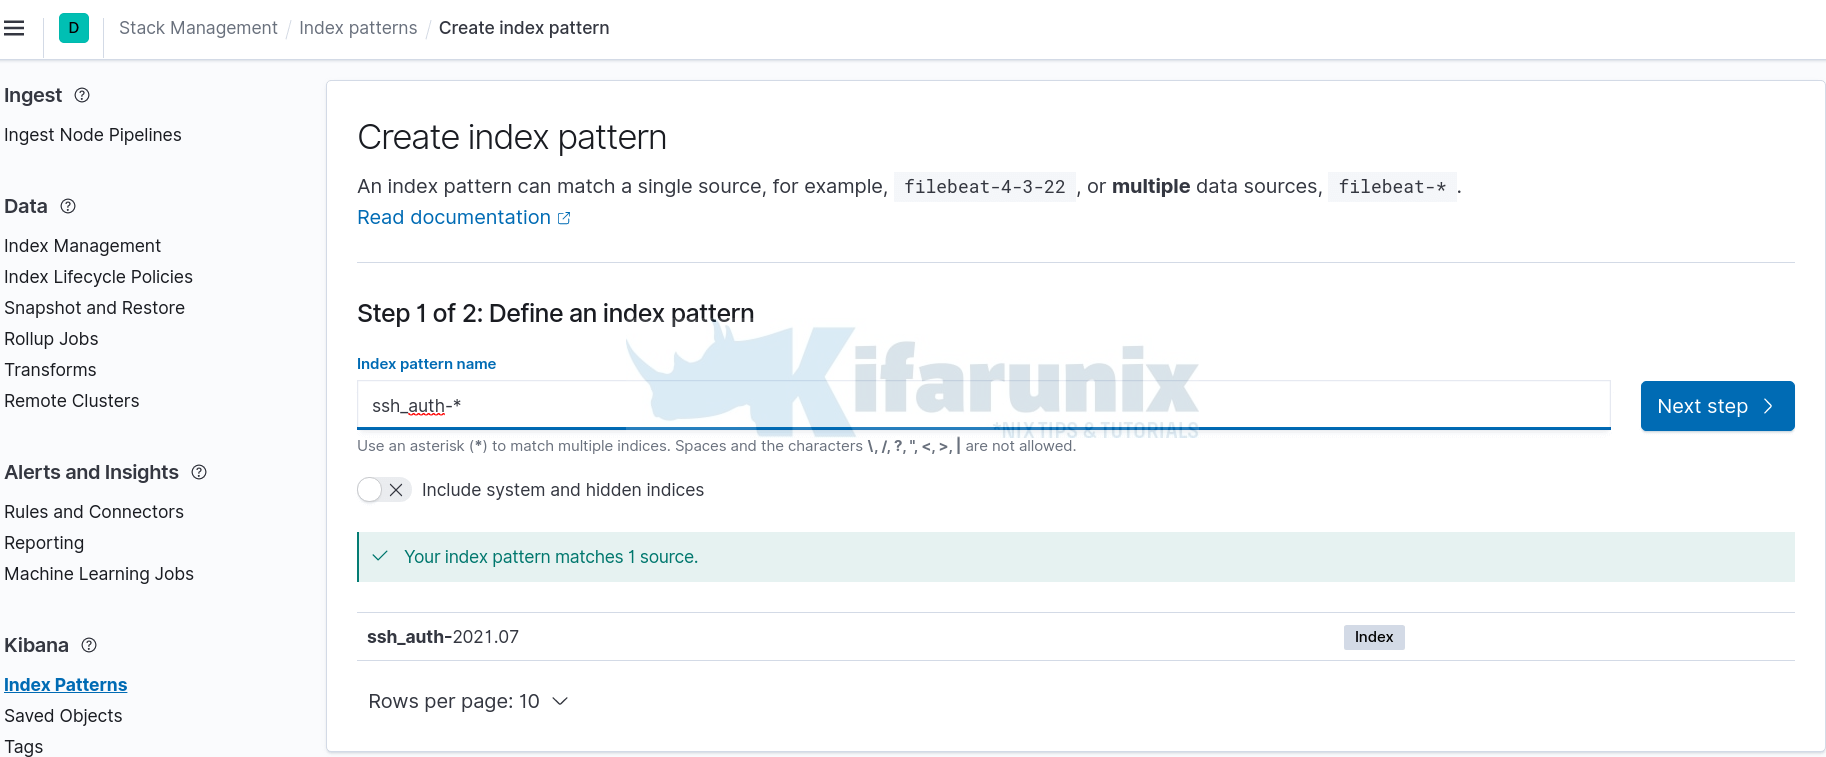
To visualize and explore data in Kibana, you need to create an index pattern to retrieve data from Elasticsearch.
In this demo, our index pattern is ssh_auth-*, as defined on the Logstash Elasticsearch output plugin, index => "ssh_auth-%{+YYYY.MM}".
On Kibana Dashboard, Navigate to Management > Stack Management > Kibana > Index Patterns > Create index pattern.
An index pattern can match the name of a single index, or include a wildcard (*) to match multiple indices.

Click Next and select @timestamp as the time filter and click Create index pattern.
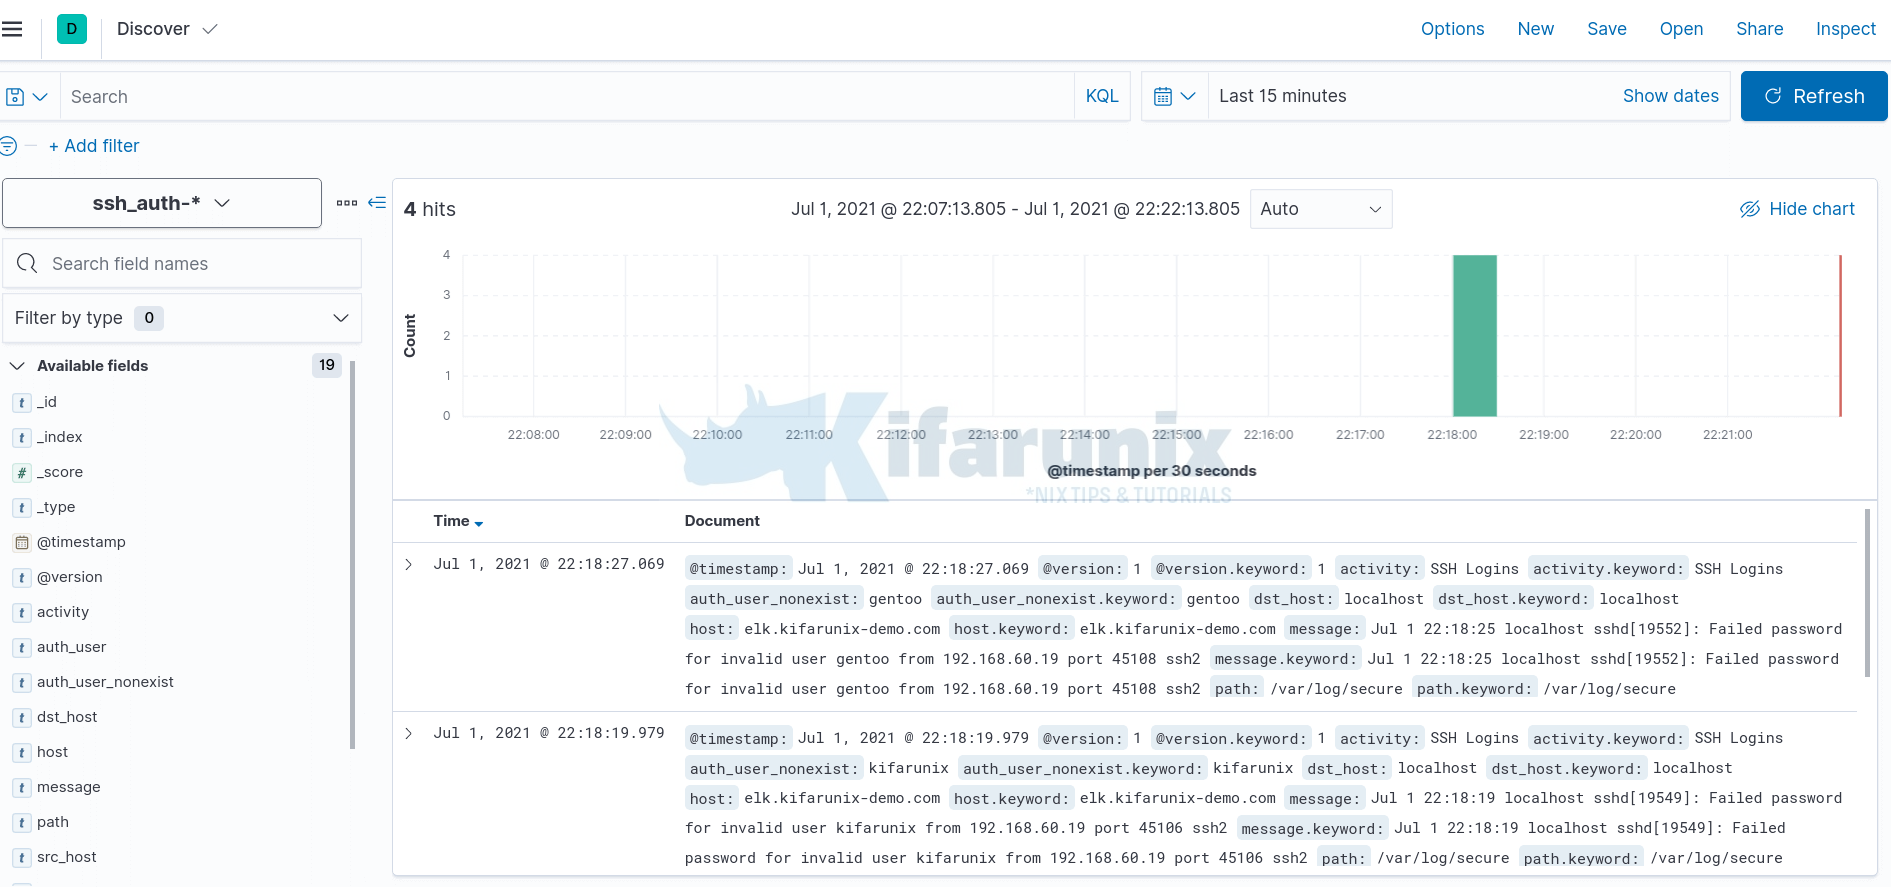
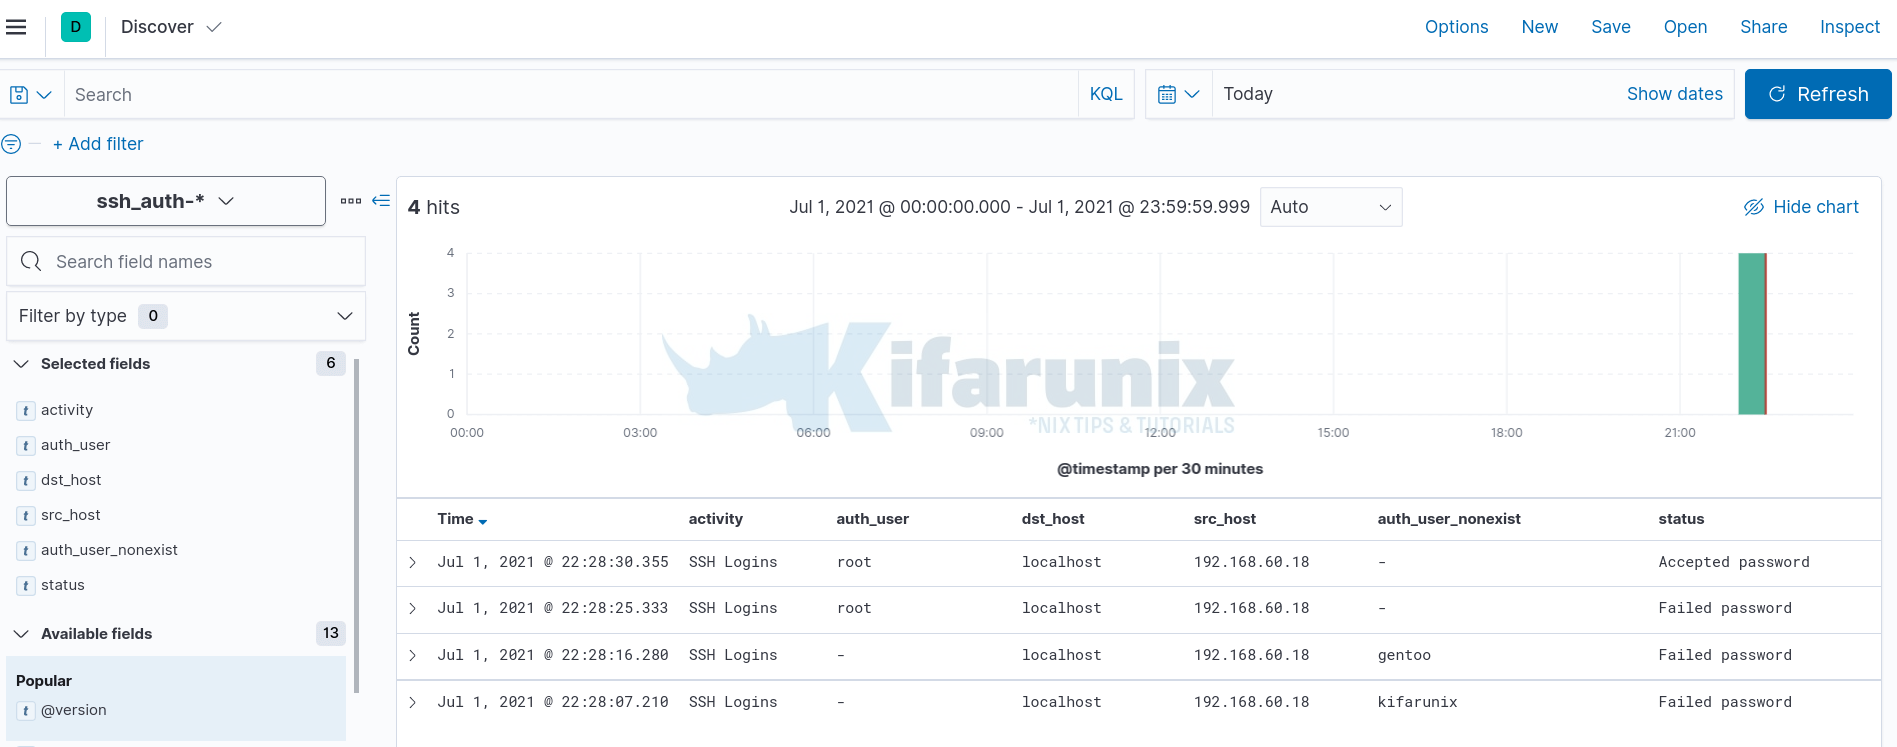
After that, click Discover tab on the left pane to view the data. Expand time range appropriately.

You can as well select the fields that you want to view based on your grok pattern. In the screenshot below, time range is last 15 minutes.

Be sure to customize your Grok patterns to your liking if using Logstash as your data processing engine.
Reference;
Other Tutorials
Integrate Wazuh Manager with ELK Stack

