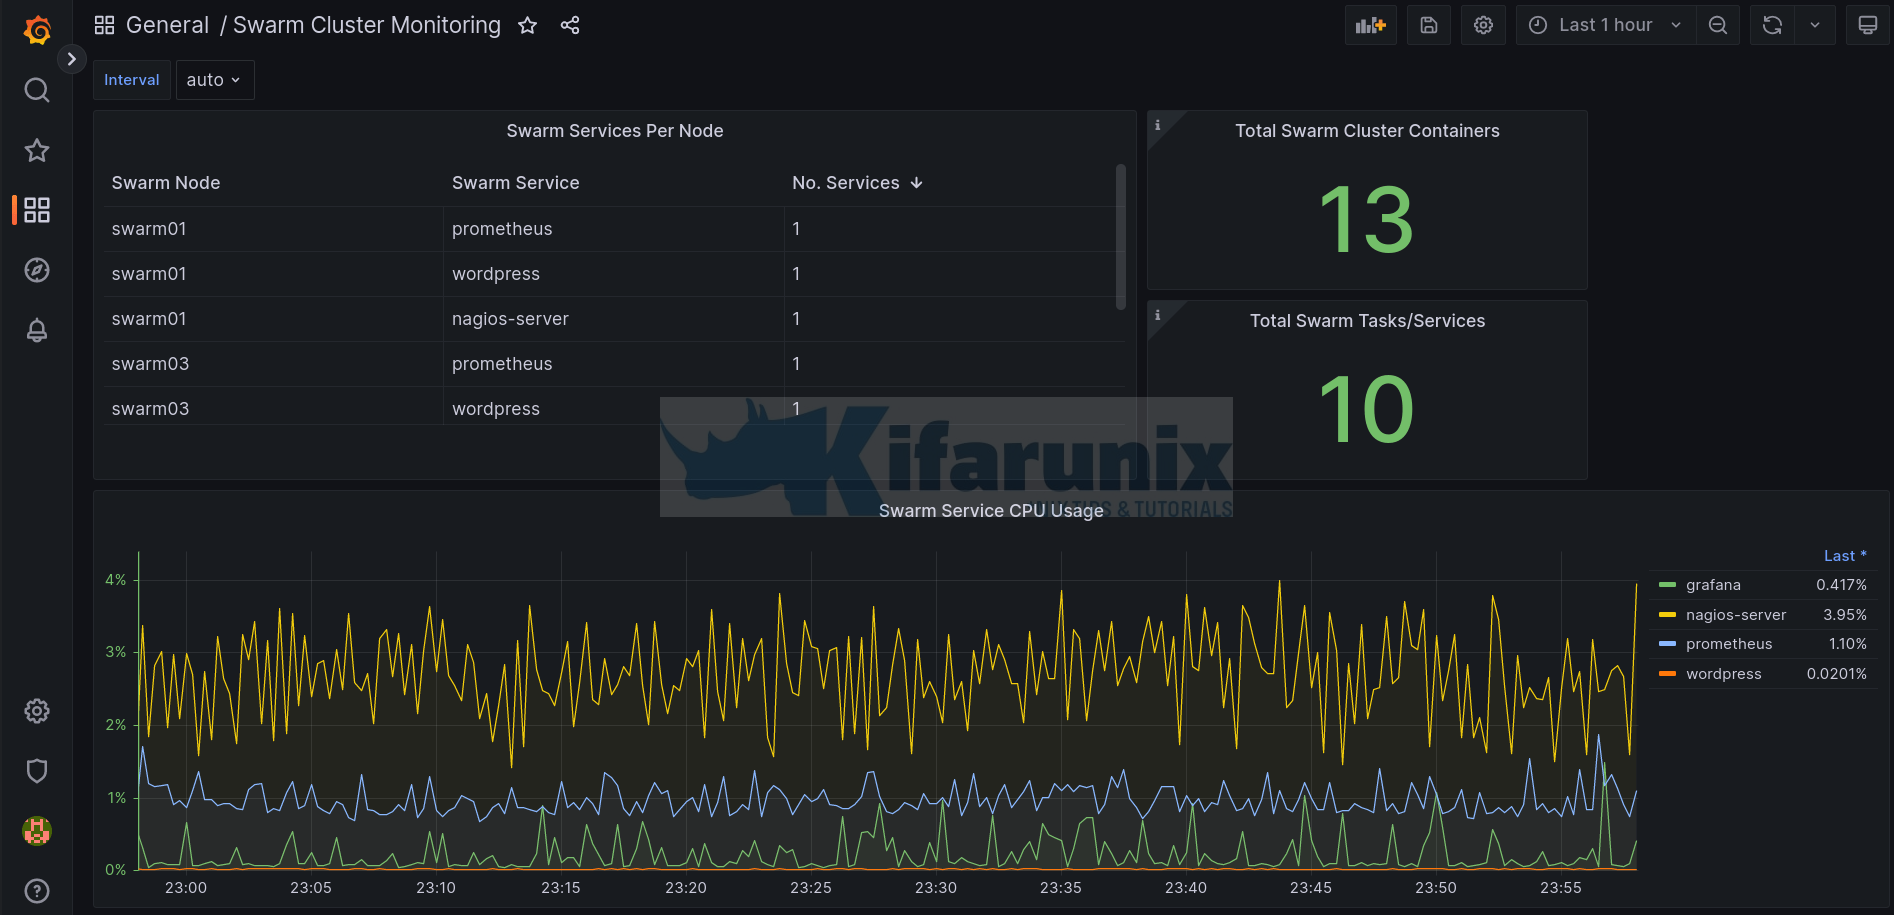
Monitor Docker Swarm Service Metrics using Grafana
How can I monitor Docker swarm service metrics? In this tutorial, you will learn how to monitor Docker swarm service metrics using Grafana. Coupled with

How can I monitor Docker swarm service metrics? In this tutorial, you will learn how to monitor Docker swarm service metrics using Grafana. Coupled with
In this tutoria, we are going to learn how to monitor Linux system metrics with Prometheus Node Exporter. Node Exporter is a Prometheus exporter for
In this guide, you will learn how to install Prometheus Node Exporter on CentOS 8. Prometheus Node Exporter is used to expose the system hardware
Follow through this tutorial to learn how to install LibreNMS on Ubuntu 22.04/Ubuntu 20.04. LibreNMS is a fully featured MySQL/PHP and SNMP based network monitoring
In this guide, we are going to learn how to install Icinga Web 2 on Debian 10 Buster as our continuation for our guide on

Welcome to our guide on how to install Prometheus on Rocky Linux 8. Prometheus is an open-source time series collection and processing monitoring system with a dimensional data

This guide will walk you through how to install Nagios Plugins on Rocky Linux 8. Nagios plugins are standalone extensions to Nagios Core that enables Nagios to

In this guide, we are going to learn how to install OSSEC Agent on Debian 10 Buster. OSSEC is an open source host intrusion detection

In this tutorial we are going to learn how to install and configure Nagios Core from Repos on Ubuntu 18.04. Nagios is an enterprise grade

This simple guide will take you through how to Measure CPU Usage in Linux. CPU is critical to every other system operations. If a process