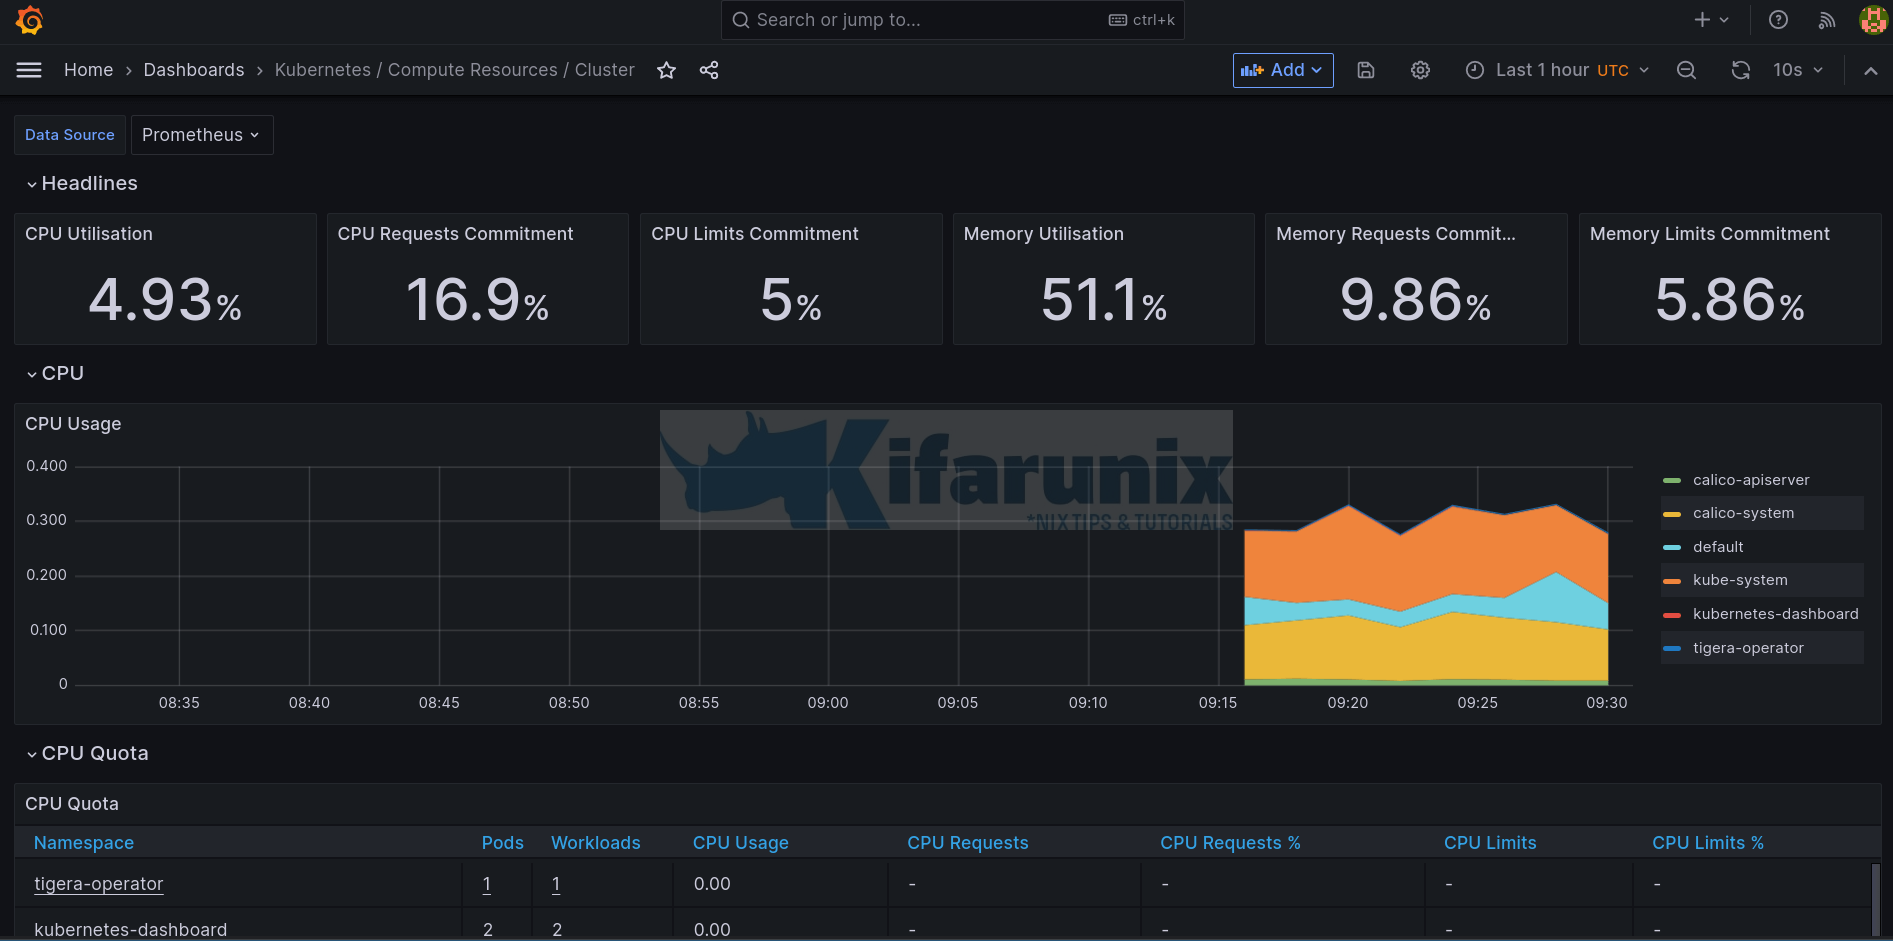
In this tutorial, we will provide you with a step by step guide on Kubernetes monitoring with Prometheus and Grafana. Being able to monitor a Kubernetes cluster is fundamental in ensuring the health of the cluster, performance and scalability. You can use Prometheus and Grafana to provide real-time visibility into your cluster’s metrics usage. With real time monitoring, you can be able to identify bottlenecks, and optimize resource utilization in the cluster.
Table of Contents
Step-by-Step Guide: Monitoring Kubernetes with Prometheus and Grafana
Setup Kubernetes Cluster
Of course, you cannot start to monitor what is not setup already. However, if you are looking at how to setup Kubernetes cluster, then check the guide below;
Setup Kubernetes Cluster on Ubuntu 22.04/20.04
Install Helm on Kubernetes Cluster
There are different methods in which you can use to install Kubernetes cluster monitoring tools;
- Creating seperate YAML files for Kubernetes application resources such as deployments, services, pods, etc.
- Using Helm Charts. Helm charts are packages of Kubernetes resources that have been created by Helm community to make installation of various K8s packages easy and convenient.
- Using Kubernetes operators to automate application deployment.
- e.t.c
In this tutorial, we will be using Helm charts to deploy Prometheus and Grafana. In that case, you need to have Helm client installed.
Follow the guide below to learn how to install Helm on Kubernetes cluster.
How to Install Helm on Kubernetes Cluster
Install Prometheus and Grafana Helm Charts Repositories
in order to be able to install Prometheus and Grafana charts on Kubernetes cluster, you first need to install their Helm charts community repositories.
Install Prometheus Helm charts repositories;
helm repo add prometheus-community https://prometheus-community.github.io/helm-chartsInstall Grafana Helm charts repositories;
helm repo add grafana https://grafana.github.io/helm-chartsConfirm that the repos are in place;
helm repo listNAME URL
prometheus-community https://prometheus-community.github.io/helm-charts
grafana https://grafana.github.io/helm-charts
bitnami https://charts.bitnami.com/bitnami You can search for any Kubernetes helm chart on the K8s charts hub.
Install Prometheus and Grafana on Kubernetes Cluster
Prometheus can collect and store metrics from a variety of sources while Grafana helps you visualize the metrics collected by Prometheus.
There are different charts related to Prometheus/Grafana on the Artifact Hub that offers different functionality.
In this guide, we will install kube-prometheus-stack chart which offers a complete monitoring solution for K8s cluster. kube-prometheus-stack installs the following components;
Prometheus Operator: The Prometheus Operator is a Kubernetes-native operator that manages and automates the lifecycle of Prometheus and related monitoring components. It simplifies the deployment, configuration, and management of Prometheus instances in a Kubernetes environment.- Highly available
Prometheuswhich scrapes metrics from various endpoints in the cluster. - Highly available
Alertmanager: The Alertmanager is responsible for processing and managing alerts generated by Prometheus. It allows you to define alerting rules and configure how alerts are sent and handled. The highly available Alertmanager component ensures the reliability and availability of the alerting system. Prometheus node-exporter: The Prometheus node-exporter is an agent that runs on each Kubernetes node and exposes system-level metrics, such as CPU usage, memory usage, disk utilization, and network statistics. which can be scraped by Prometheus- The
Prometheus Adapterwhich allows you to use custom and external metrics collected by Prometheus in Kubernetes Horizontal Pod Autoscaling (HPA) and other scaling mechanisms. It enables the Kubernetes API server to retrieve metric values from Prometheus and make scaling decisions based on those metrics. kube-state-metricsa component which exposes metrics about the state of Kubernetes objects, such as pods, deployments, services, and nodes, providing insights into the current state and health of your Kubernetes resources.Grafana, the visualization tool itself.
To install kube-prometheus-stack chart, run the command below
helm install prometheus prometheus-community/kube-prometheus-stackOnce the installation is complete, you will see such an output;
NAME: prometheus
LAST DEPLOYED: Tue May 23 19:30:09 2023
NAMESPACE: default
STATUS: deployed
REVISION: 1
NOTES:
kube-prometheus-stack has been installed. Check its status by running:
  kubectl --namespace default get pods -l "release=prometheus"

Visit https://github.com/prometheus-operator/kube-prometheus for instructions on how to create & configure Alertmanager and Prometheus instances using the Operator.
So, what resources for Prometheus stack are installed? You can get using the kubectl get command as follows;
kubectl get all --selector release=prometheusThe command will display the pods, services, daemonsets, deployments, replicatsets, statefulsets related to Prometheus.
NAME                                                       READY   STATUS    RESTARTS   AGE
pod/prometheus-kube-prometheus-operator-54cfc96db7-r6k6k   1/1     Running   0          3m34s
pod/prometheus-kube-state-metrics-5f5f8b8fdd-nzwsp         1/1     Running   0          3m34s
pod/prometheus-prometheus-node-exporter-92wtx              1/1     Running   0          3m34s
pod/prometheus-prometheus-node-exporter-c2zdq              1/1     Running   0          3m34s
pod/prometheus-prometheus-node-exporter-f6867              1/1     Running   0          3m34s
pod/prometheus-prometheus-node-exporter-wf8qd              1/1     Running   0          3m34s

NAME                                              TYPE        CLUSTER-IP       EXTERNAL-IP   PORT(S)    AGE
service/prometheus-kube-prometheus-alertmanager   ClusterIP   10.98.95.240             9093/TCP   3m35s
service/prometheus-kube-prometheus-operator       ClusterIP   10.101.213.133           443/TCP    3m35s
service/prometheus-kube-prometheus-prometheus     ClusterIP   10.110.12.91             9090/TCP   3m35s
service/prometheus-kube-state-metrics             ClusterIP   10.98.72.100             8080/TCP   3m35s
service/prometheus-prometheus-node-exporter       ClusterIP   10.107.130.247           9100/TCP   3m35s

NAME                                                 DESIRED   CURRENT   READY   UP-TO-DATE   AVAILABLE   NODE SELECTOR   AGE
daemonset.apps/prometheus-prometheus-node-exporter   4         4         4       4            4                     3m34s

NAME                                                  READY   UP-TO-DATE   AVAILABLE   AGE
deployment.apps/prometheus-kube-prometheus-operator   1/1     1            1           3m34s
deployment.apps/prometheus-kube-state-metrics         1/1     1            1           3m34s

NAME                                                             DESIRED   CURRENT   READY   AGE
replicaset.apps/prometheus-kube-prometheus-operator-54cfc96db7   1         1         1       3m34s
replicaset.apps/prometheus-kube-state-metrics-5f5f8b8fdd         1         1         1       3m34s

NAME                                                                    READY   AGE
statefulset.apps/alertmanager-prometheus-kube-prometheus-alertmanager   1/1     3m21s
statefulset.apps/prometheus-prometheus-kube-prometheus-prometheus       1/1     3m21s
Some resources do not have the all resource type. In this case, you can list individual resource types e.g;
kubectl get pods -n <namespace>kubectl get svc -n <namespace>You can also check the config maps related to Prometheus using the command below. ConfigMaps are used to store and manage non-confidential configuration data for your applications
kubectl get configmaps --selector release=prometheus
NAME                                                           DATA   AGE
prometheus-kube-prometheus-alertmanager-overview               1      6m3s
prometheus-kube-prometheus-apiserver                           1      6m3s
prometheus-kube-prometheus-cluster-total                       1      6m3s
prometheus-kube-prometheus-controller-manager                  1      6m3s
prometheus-kube-prometheus-etcd                                1      6m3s
prometheus-kube-prometheus-grafana-datasource                  1      6m3s
prometheus-kube-prometheus-grafana-overview                    1      6m3s
prometheus-kube-prometheus-k8s-coredns                         1      6m3s
prometheus-kube-prometheus-k8s-resources-cluster               1      6m3s
prometheus-kube-prometheus-k8s-resources-multicluster          1      6m3s
prometheus-kube-prometheus-k8s-resources-namespace             1      6m3s
prometheus-kube-prometheus-k8s-resources-node                  1      6m3s
prometheus-kube-prometheus-k8s-resources-pod                   1      6m3s
prometheus-kube-prometheus-k8s-resources-workload              1      6m3s
prometheus-kube-prometheus-k8s-resources-workloads-namespace   1      6m3s
prometheus-kube-prometheus-kubelet                             1      6m3s
prometheus-kube-prometheus-namespace-by-pod                    1      6m3s
prometheus-kube-prometheus-namespace-by-workload               1      6m3s
prometheus-kube-prometheus-node-cluster-rsrc-use               1      6m3s
prometheus-kube-prometheus-node-rsrc-use                       1      6m3s
prometheus-kube-prometheus-nodes                               1      6m3s
prometheus-kube-prometheus-nodes-darwin                        1      6m3s
prometheus-kube-prometheus-persistentvolumesusage              1      6m3s
prometheus-kube-prometheus-pod-total                           1      6m3s
prometheus-kube-prometheus-prometheus                          1      6m3s
prometheus-kube-prometheus-proxy                               1      6m3s
prometheus-kube-prometheus-scheduler                           1      6m3s
prometheus-kube-prometheus-workload-total                      1      6m3s
There are also service monitors used by Prometheus operators to define the scraping configuration required to monitor services and endpoints within your Kubernetes cluster.
kubectl get servicemonitor --selector release=prometheus
NAME                                                 AGE
prometheus-kube-prometheus-alertmanager              13m
prometheus-kube-prometheus-apiserver                 13m
prometheus-kube-prometheus-coredns                   13m
prometheus-kube-prometheus-kube-controller-manager   13m
prometheus-kube-prometheus-kube-etcd                 13m
prometheus-kube-prometheus-kube-proxy                13m
prometheus-kube-prometheus-kube-scheduler            13m
prometheus-kube-prometheus-kubelet                   13m
prometheus-kube-prometheus-operator                  13m
prometheus-kube-prometheus-prometheus                13m
prometheus-kube-state-metrics                        13m
prometheus-prometheus-node-exporter                  13m
Accessing Prometheus Outside K8S cluster
You can check services related to Prometheus on the default namespace;
kubectl get svc --selector release=prometheus
NAME                                      TYPE        CLUSTER-IP       EXTERNAL-IP   PORT(S)    AGE
prometheus-kube-prometheus-alertmanager   ClusterIP   10.98.95.240             9093/TCP   10m
prometheus-kube-prometheus-operator       ClusterIP   10.101.213.133           443/TCP    10m
prometheus-kube-prometheus-prometheus     ClusterIP   10.110.12.91             9090/TCP   10m
prometheus-kube-state-metrics             ClusterIP   10.98.72.100             8080/TCP   10m
prometheus-prometheus-node-exporter       ClusterIP   10.107.130.247           9100/TCP   10m
As you can see, the Prometheus services are only meant for internal access within the cluster as depicted by the service type ClusterIP.
Check for example, Prometheus endpoint on port 9090/tcp, prometheus-kube-prometheus-prometheus, this service exposes Prometheus on internal cluster IP address.
To be able to access Prometheus from outside the cluster, we need to change service type to NodePort. This exposes the service on a static port on each selected node in the cluster and the service becomes accessible on each node’s IP address and the static port.
Thus, edit the service;
kubectl edit service prometheus-kube-prometheus-prometheusBy default, this is how the service manifest looks like;
# Please edit the object below. Lines beginning with a '#' will be ignored,
# and an empty file will abort the edit. If an error occurs while saving this file will be
# reopened with the relevant failures.
#
apiVersion: v1
kind: Service
metadata:
  annotations:
    meta.helm.sh/release-name: prometheus
    meta.helm.sh/release-namespace: default
  creationTimestamp: "2023-05-23T19:30:49Z"
  labels:
    app: kube-prometheus-stack-prometheus
    app.kubernetes.io/instance: prometheus
    app.kubernetes.io/managed-by: Helm
    app.kubernetes.io/part-of: kube-prometheus-stack
    app.kubernetes.io/version: 46.1.0
    chart: kube-prometheus-stack-46.1.0
    heritage: Helm
    release: prometheus
    self-monitor: "true"
  name: prometheus-kube-prometheus-prometheus
  namespace: default
  resourceVersion: "124975"
  uid: 177fb969-6d22-46f5-8e39-0b3c451b4da2
spec:
  clusterIP: 10.108.24.96
  clusterIPs:
  - 10.108.24.96
  internalTrafficPolicy: Cluster
  ipFamilies:
  - IPv4
  ipFamilyPolicy: SingleStack
  ports:
  - name: http-web
    port: 9090
    protocol: TCP
    targetPort: 9090
  selector:
    app.kubernetes.io/name: prometheus
    prometheus: prometheus-kube-prometheus-prometheus
  sessionAffinity: None
  type: ClusterIP
status:
  loadBalancer: {}
We will edit this file and change type: ClusterIP to type: NodePort. Also, we will bind it to static NodePort that is currently not being used, 30002.
  ports:
  - name: http-web
    port: 9090
    protocol: TCP
    targetPort: 9090
    nodePort: 30002
  selector:
    app.kubernetes.io/name: prometheus
    prometheus: prometheus-kube-prometheus-prometheus
  sessionAffinity: None
  type: NodePort
Save and exit the file.
Confirm the changes;
kubectl get svc prometheus-kube-prometheus-prometheusNAME TYPE CLUSTER-IP EXTERNAL-IP PORT(S) AGE
prometheus-kube-prometheus-prometheus NodePort 10.108.24.96 <none> 9090:30002/TCP 12mYou should now be able to access Prometheus interface on any node IP via the address http://<NodeIP>:30002.
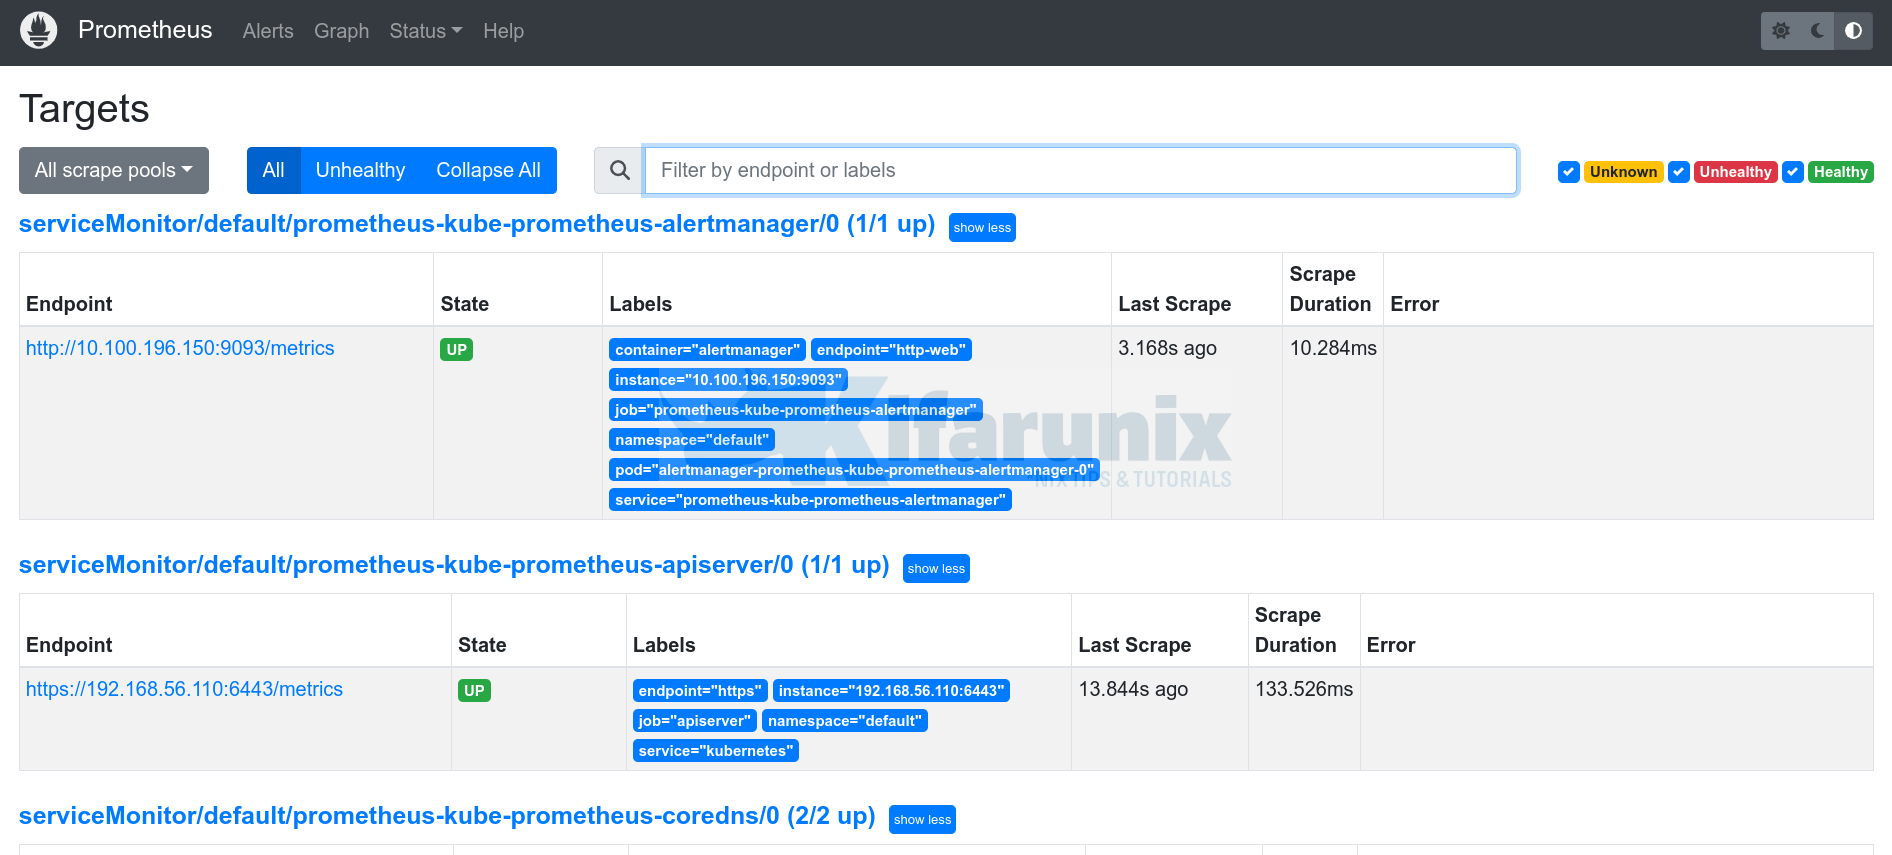
You may realize that some endpoints metrics are giving connection refused errors;
In order to resolve this, we need to change the bind addresses for kube-controller-manager, etcd, kube-scheduler and kube-proxy.
They all listen on loopback interfaces by default.
ss -altnp | grep -E "10257|2381|10249|10259"We will update the configurations and bind the address to 0.0.0.0. Please note this opens up access to these services from any interface. Be sure to setup proper firewall rules in place to prevent unauthorized access.
- Update Kube Proxy bind address (
cmis short form ofconfigmaps)
kubectl edit cm kube-proxy -n kube-systemUnder the section, config.conf: |-, change the metricsBindAddress: "" to metricsBindAddress: "0.0.0.0:10249"
Save and exit.
To apply the changes, delete all kube-proxy pods to recreate new ones with updated bind address;
kubectl delete pods -l k8s-app=kube-proxy -n kube-systemCheck if Kube proxy pods have been recreated;
kubectl get pod -l k8s-app=kube-proxy -n kube-systemcheck ports;
ss -altnp | grep 10249- Change ETCD Metrics bind address
Edit the configuration file used by etcd and change the metrics bind address as follows;
sudo vim /etc/kubernetes/manifests/etcd.yamlChange the line;
--listen-metrics-urls=http://127.0.0.1:2381to;
--listen-metrics-urls=http://0.0.0.0:2381Save and exit the file.
Relevant pods will automatically restart and set the bind address to 0.0.0.0.
- Change Kube Scheduler bind address
Edit the configuration file used by scheduler and change the bind address as follows;
sudo vim /etc/kubernetes/manifests/kube-scheduler.yamlChange the line;
--bind-address=127.0.0.1to;
--bind-address=0.0.0.0Save and exit the file.
Relevant pods will automatically restart and set the bind address to 0.0.0.0.
- Change Kube controller manager bind address;
Edit the manifest configuration file used by controller manager and change the bind address as follows;
sudo vim /etc/kubernetes/manifests/kube-controller-manager.yamlChange the line;
--bind-address=127.0.0.1to;
--bind-address=127.0.0.1Save and exit the file.
Relevant pods will automatically restart and set the bind address to 0.0.0.0.
Confirm the ports;
sudo lsof -i :2381,10249,10257,10259
COMMAND    PID USER   FD   TYPE DEVICE SIZE/OFF NODE NAME
kube-sche 1239 root    3u  IPv6  22234      0t0  TCP *:10259 (LISTEN)
etcd      1245 root   14u  IPv6  22268      0t0  TCP *:2381 (LISTEN)
kube-cont 1261 root    3u  IPv6  22936      0t0  TCP *:10257 (LISTEN)
kube-prox 1866 root   11u  IPv6  24294      0t0  TCP *:10249 (LISTEN)
This should resolve issue with kube-prometheus-stack connection refused.
Accessing Grafana Outside K8S Cluster
The kube-prometheus-stack helm chart installed, also install Grafana. The Grafana is can only be accessed within the cluster via port 80/TCP.
In order to access it externally, we will edit the service and change service type to NodePort as we did above for Prometheus.
kubectl edit svc prometheus-grafana
spec:
spec:
  clusterIP: 10.111.147.239
  clusterIPs:
  - 10.111.147.239
  externalTrafficPolicy: Cluster
  internalTrafficPolicy: Cluster
  ipFamilies:
  - IPv4
  ipFamilyPolicy: SingleStack
  ports:
  - name: service
    port: 80
    protocol: TCP
    targetPort: 3000
    nodePort: 30003
  selector:
    app.kubernetes.io/instance: grafana
    app.kubernetes.io/name: grafana
  sessionAffinity: None
    #type: ClusterIP
  type: NodePort
..
kubectl get svcNAME TYPE CLUSTER-IP EXTERNAL-IP PORT(S) AGE
...
grafana NodePort 10.111.147.239 <none> 80:30003/TCP 21m
...Login to Grafana Web Interface
You should now be able to Access Grafana outside the cluster on any cluster node’s IP on port 30003.
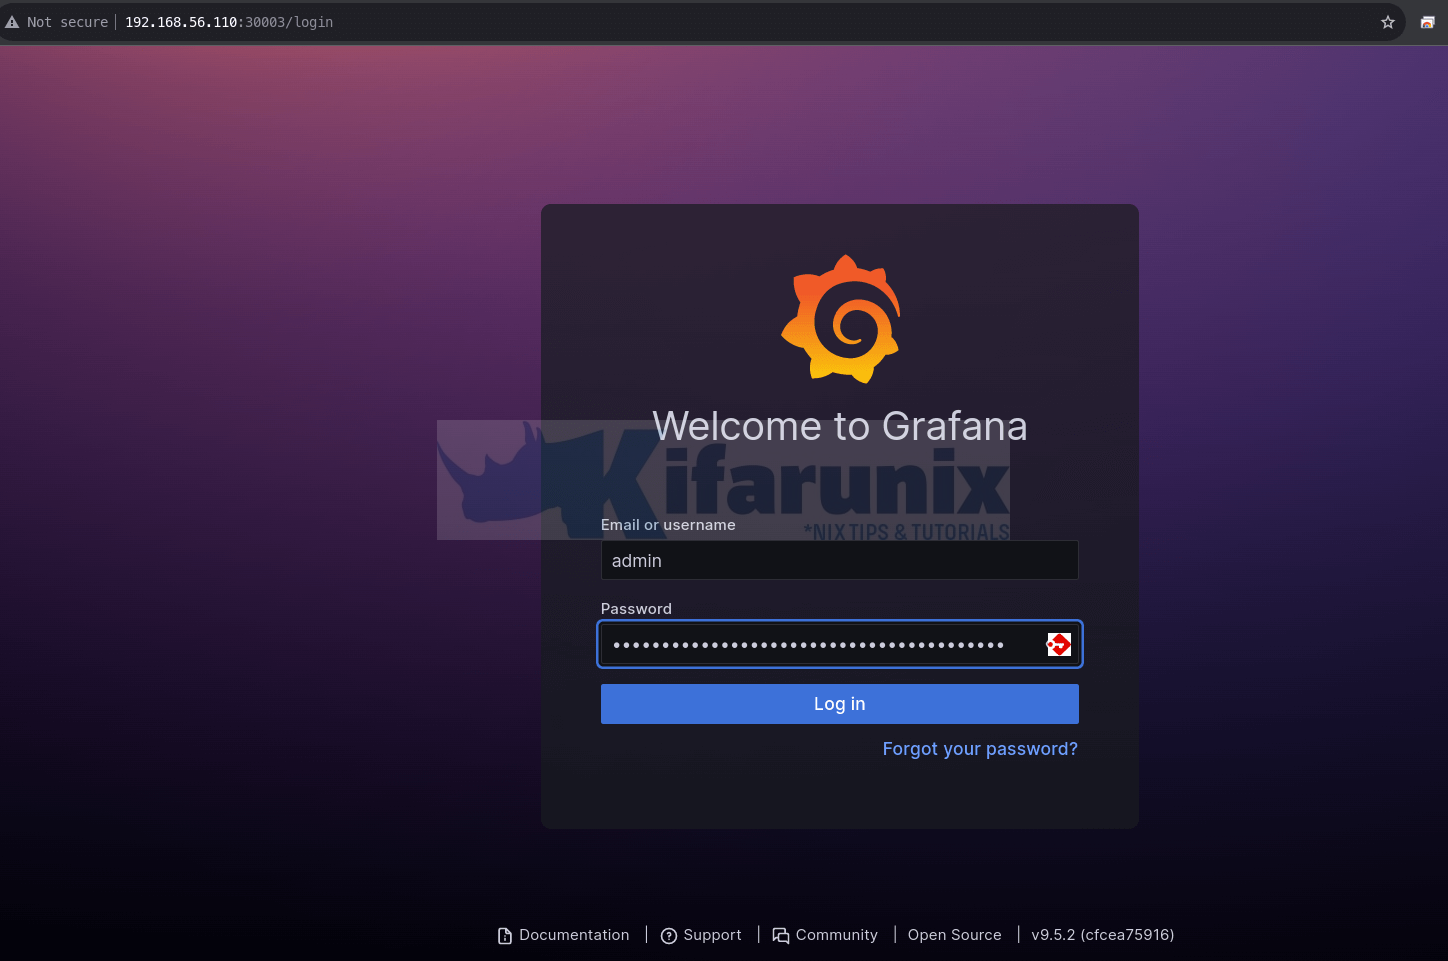
You can generate Grafana admin user password by running the command below;
kubectl get secret prometheus-grafana \
-o jsonpath="{.data.admin-password}" | base64 --decode ; echo
Sample output;
prom-operatorThe default dashboard;
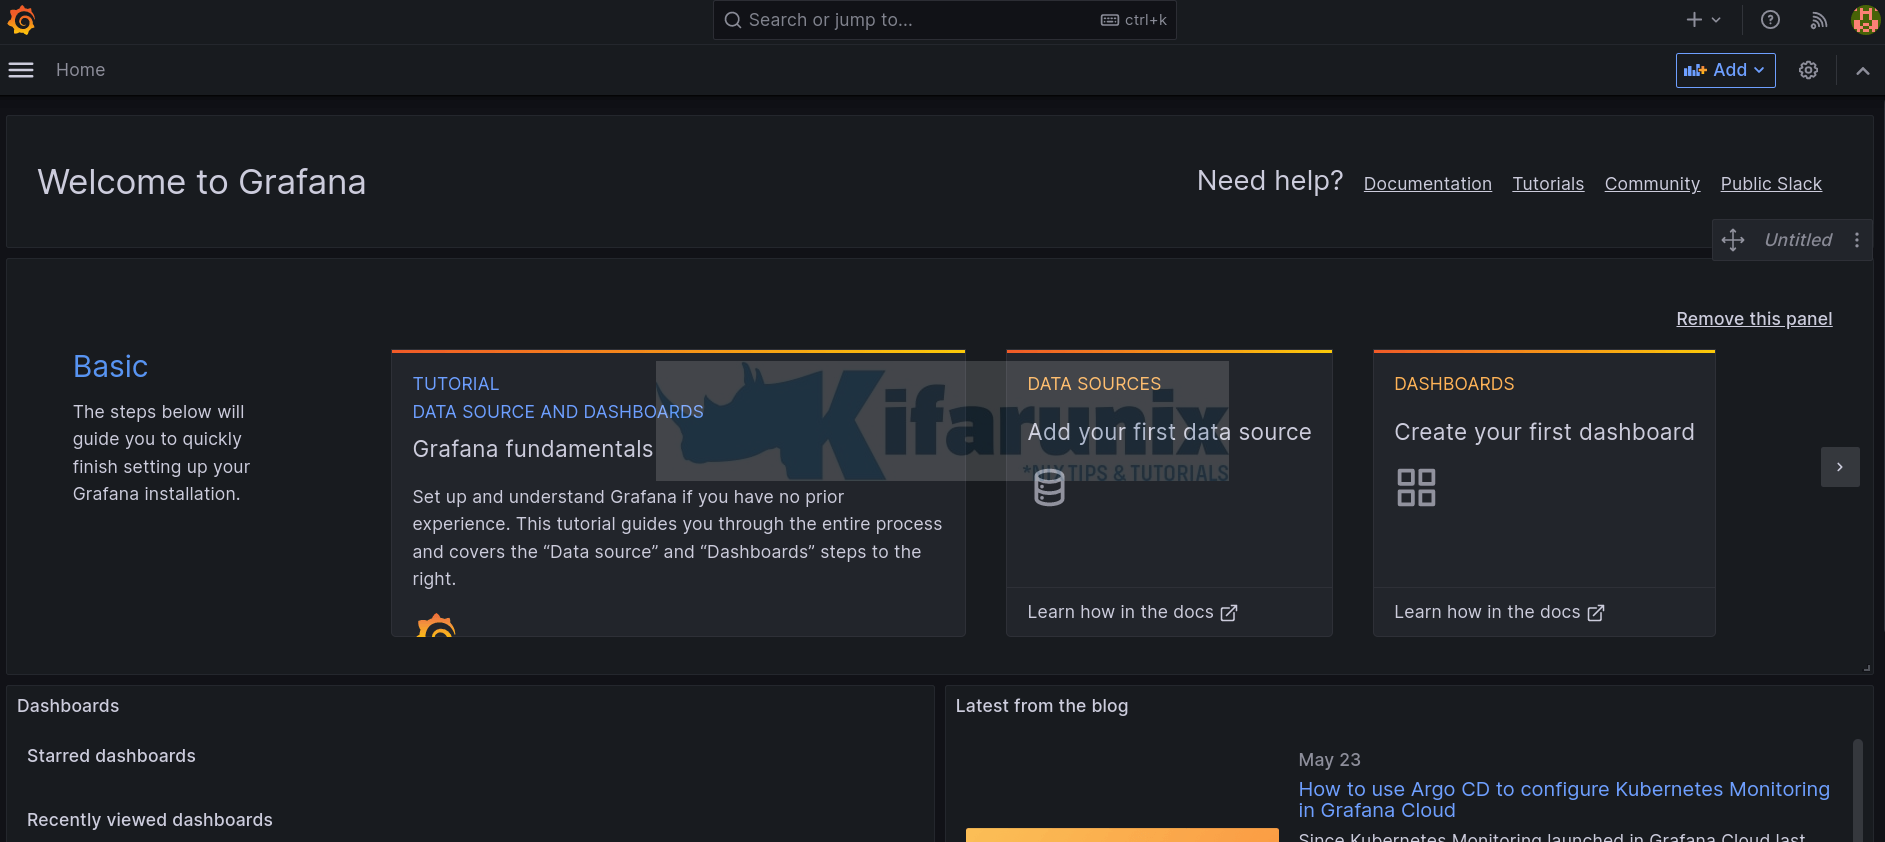
Grafana Prometheus Datasource
The stack already preconfigured. Prometheus data source has already been added.

Grafana Kubernetes Dashboards
The stack also comes with some dashboard preconfigured.
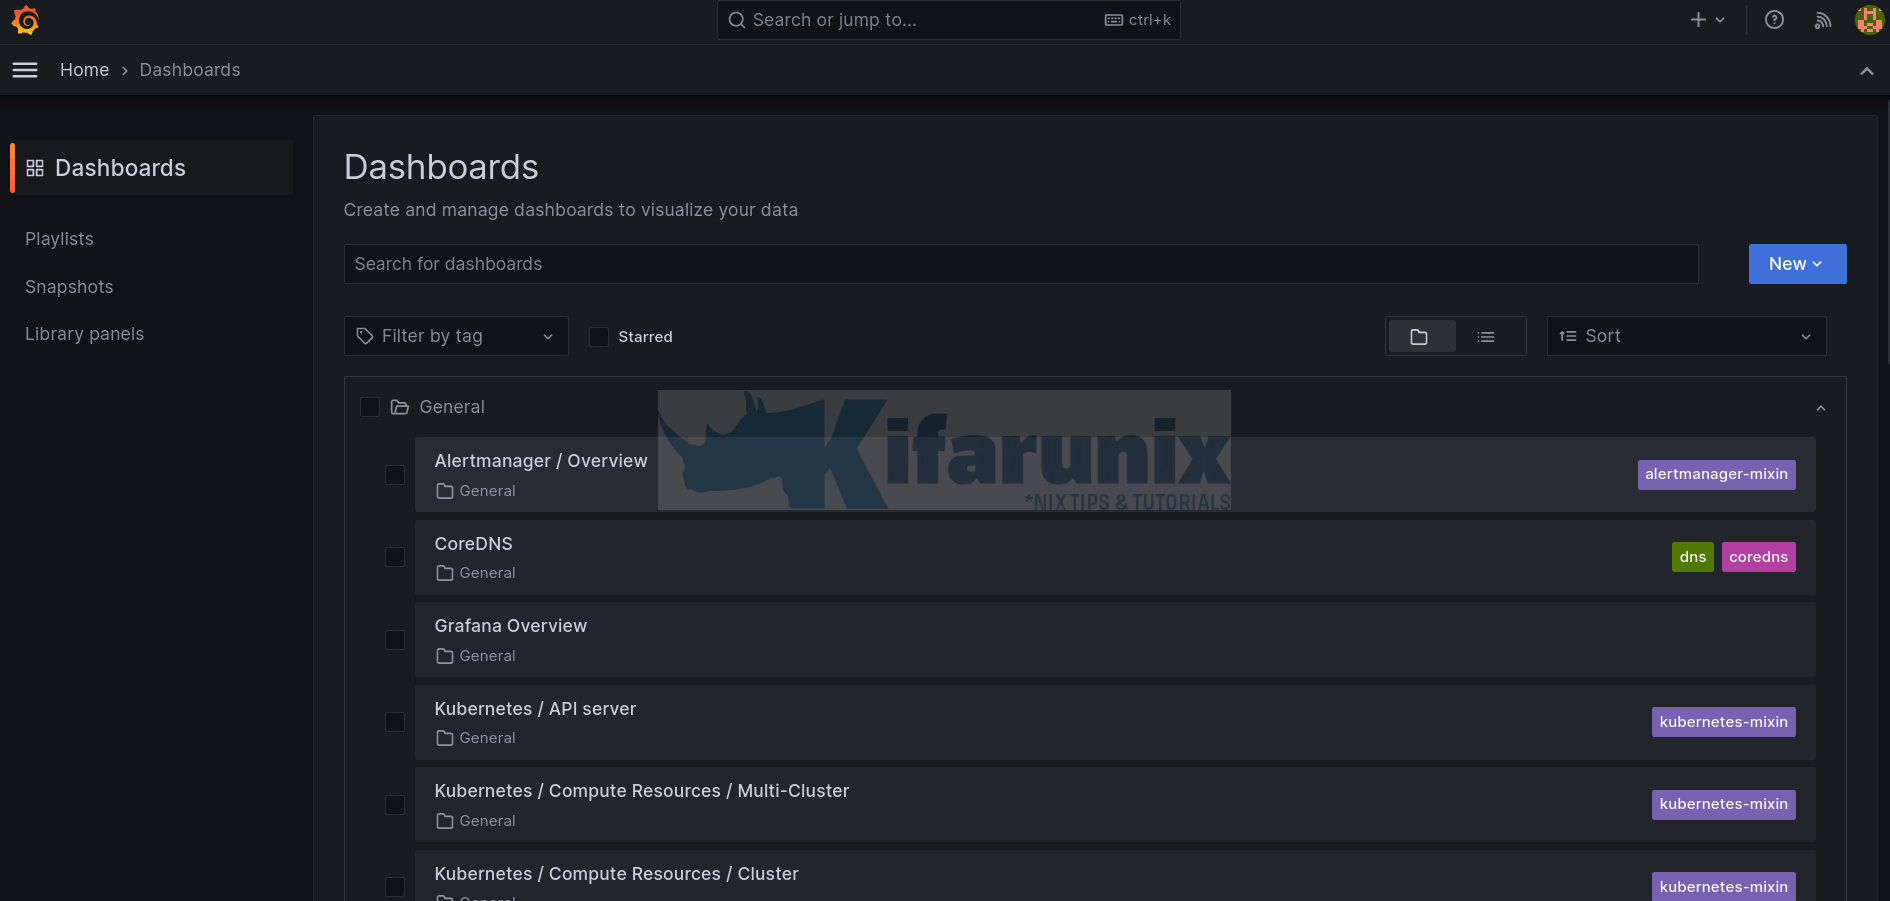
Let’s check some dashboard;

Explore other dashboards.
Update everything to suite your needs!
That concludes our guide on monitoring Kubernetes with Prometheus and Grafana.

