Follow through this tutorial to learn how to integrate Suricata with Wazuh for log processing. With its ability to write its logs in YAML and JSON formats, Suricata can be integrated with other tools such as SIEMs, Splunk, Logstash/Elasticsearch, Kibana for further logs processing and visualization. In this tutorial, we will see how you can easily integrated it with Wazuh, an open-source threat detection, security monitoring, incident response and regulatory compliance tool to process the Suricata generated alerts for better monitoring and visualization network traffic.
How to Integrate Suricata with Wazuh for Log Processing
Install and Setup Wazuh Server
To begin with, ensure that you have a Wazuh manager up and running. You can check the sample tutorials below;
Install Wazuh Server on Rocky Linux 8
Install and Configure Wazuh Manager on Ubuntu 22.04
Install and Setup Suricata
On the end point where you are monitoring Network traffic, install and configure Suricata. Sample tutorials
Install and Setup Suricata on Rocky Linux
Install and Setup Suricata on Ubuntu 22.04/Ubuntu 20.04
Install Wazuh Agents
On the hosts where Suricata is installed and monitoring network traffic, install Wazuh agents.
Wazuh agents are required to read and collect and push the Suricata alerts logs into Wazuh server/manager for processing.
Sample tutorials to install Wazuh agents;
Install Wazuh Agent on Rocky Linux 8
Easy Way to Install Wazuh Agents on Ubuntu/Debian
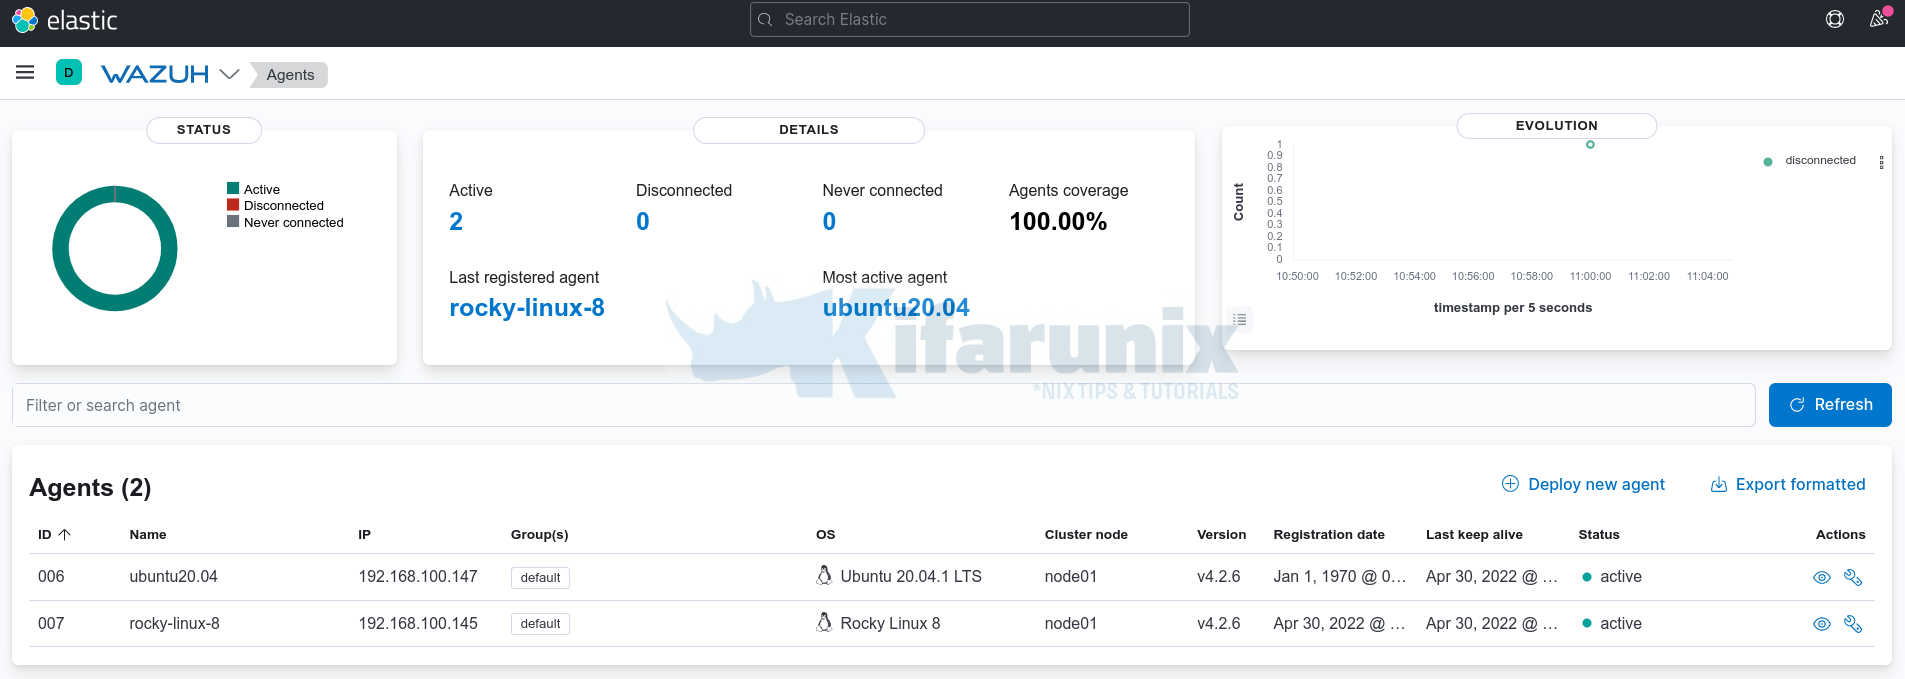
In this tutorial, we have two agents connected;
Configure Suricata Logging
By default, Suricata logs alerts to two different files;
fast.log: which contains line based alerts logeve.json: which stores the event logs in JSON format
# Configure the type of alert (and other) logging you would like.
outputs:
  - fast:
      enabled: yes
      filename: fast.log
      append: yes

  # Extensible Event Format (nicknamed EVE) event log in JSON format
  - eve-log:
      enabled: yes
      filetype: regular
      filename: eve.json
...
Configure Wazuh Agent to Collect Suricata Logs
In order to be able to integrate Suricata with Wazuh, you need to configure Wazuh agent to read the Suricata EVE logs.
The Suricata EVE log file is usually /var/log/suricata/eve.json by default.
Thus, open the Wazuh agent configuration file for editing;
sudo vi /var/ossec/etc/ossec.confAdd the lines below, just before the last line, </ossec_config>.
  <localfile>
    <log_format>json</log_format>
    <location>/var/log/suricata/eve.json</location>
  </localfile>
This basically instructs Wazuh agent to collect Suricata EVE logs and push them to Wazuh manager for processing.
Wazuh manager ships with preinstalled rules for processing Suricata EVE JSON logs by default. These rules are stored in the file /var/ossec/ruleset/rules/0475-suricata_rules.xml.
<!--
  -  Suricata rules
  -  Created by Wazuh, Inc.
  -  Copyright (C) 2015-2020, Wazuh Inc.
  -  This program is a free software; you can redistribute it and/or modify it under the terms of GPLv2.
-->

<!-- ID: 86600 - 86699 -->

<group name="ids,suricata,">

    <!--
    {"timestamp":"2016-05-02T17:46:48.515262+0000","flow_id":1234,"in_iface":"eth0","event_type":"alert","src_ip":"16.10.10.10","src_port":5555,"dest_ip":"16.10.10.11","dest_port":80,"proto":"TCP","alert":{"action":"allowed","gid":1,"signature_id":2019236,"rev":3,"signature":"ET WEB_SERVER Possible CVE-2014-6271 Attempt in HTTP Version Number","category":"Attempted Administrator Privilege Gain","severity":1},"payload":"abcde","payload_printable":"hi test","stream":0,"host":"suricata.com"}
    -->
    <rule id="86600" level="0">
        <decoded_as>json</decoded_as>
        <field name="timestamp">\.+</field>
        <field name="event_type">\.+</field>
        <description>Suricata messages.</description>
        <options>no_full_log</options>
    </rule>

    <rule id="86601" level="3">
        <if_sid>86600</if_sid>
        <field name="event_type">^alert$</field>
        <description>Suricata: Alert - $(alert.signature)</description>
        <options>no_full_log</options>
    </rule>

    <rule id="86602" level="0">
        <if_sid>86600</if_sid>
        <field name="event_type">^http$</field>
        <description>Suricata: HTTP.</description>
        <options>no_full_log</options>
    </rule>

    <rule id="86603" level="0">
        <if_sid>86600</if_sid>
        <field name="event_type">^dns$</field>
        <description>Suricata: DNS.</description>
        <options>no_full_log</options>
    </rule>

    <rule id="86604" level="0">
        <if_sid>86600</if_sid>
        <field name="event_type">^tls$</field>
        <description>Suricata: TLS.</description>
        <options>no_full_log</options>
    </rule>

</group>
Save and exit the file.
Restart Wazuh agent service
Before you can restart Wazuh agent, run the command below to check if any configuration syntax error;
sudo /var/ossec/bin/wazuh-syscheckd -texit status should be 0 if no error. Otherwise, you will see a message about the error.
sudo systemctl restart wazuh-agentAlso ensure Suricata is running and monitoring traffic on the correct network interface.
Test Wazuh Suricata Log Processing
It is now time to test if Wazuh can actually read and process Suricata event logs.
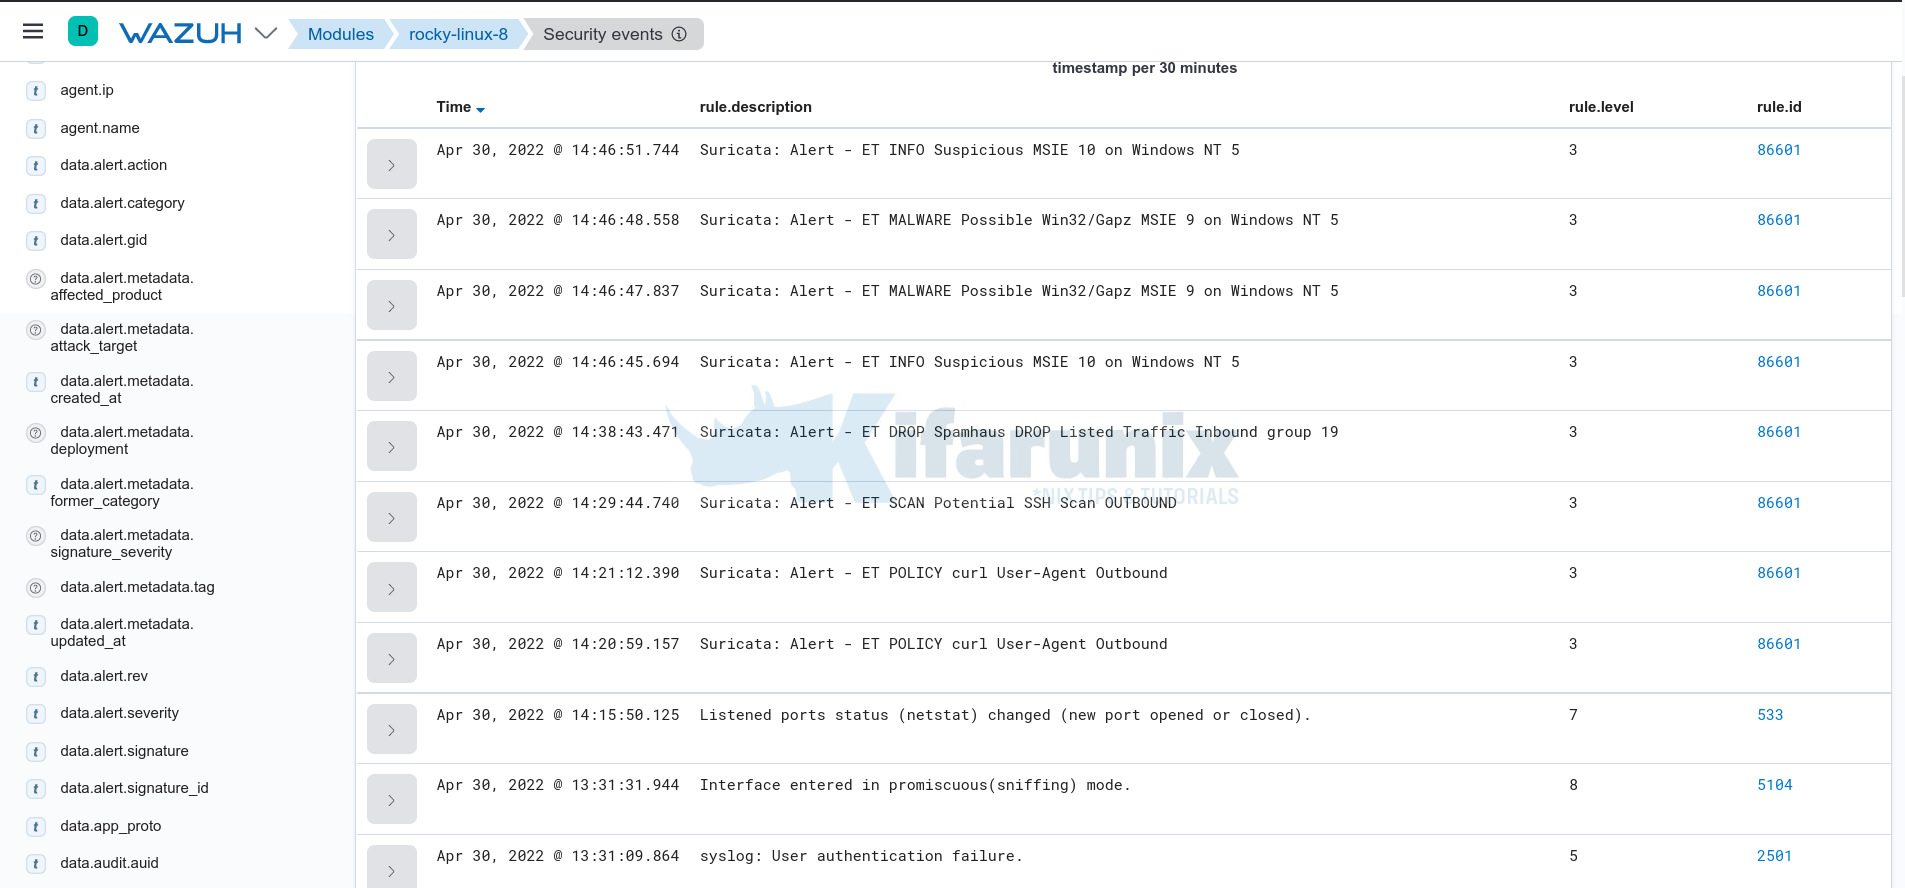
If Suricata is running on a live system with realtime traffic, there are high chances that you will sport the events related to network traffic on the respective Suricata server agent events.
See sample screenshot below;
That is evident enough to show that Wazuh is now collecting and processing Suricata events in realtime.
That brings us to a close of our tutorial on how to process Suricata logs with Wazuh.
Other Tutorials
Detecting Malicious Files with Wazuh and VirusTotal
Detect Changes to Critical Files in Linux using Auditbeat and ELK


Uncomment Lines in a File using SED in Linux