This is yet another guide on how to install Grafana monitoring tool on Fedora 29.
Install Grafana Monitoring Tool on Fedora 29
To install Grafana on Fedora 29, we are going to use any of the following two methods;
- Installing Grafana using RPM file
- Installing Grafana from YUM repos
Before you can start to install Grafana on Fedora 29, you may want to re-synchronize your system packages to the latest versions.
sudo dnf update
sudo dnf upgrade
You can check our previous similar articles be following the following links;
- Install Grafana Data Visualization Tool on Ubuntu 18.04
- Install Grafana Metrics Monitoring Tool on Debian 9
Install Grafana on Fedora 29 using RPM file
This method involves installing Grafana using an RPM file. You can either download an RPM file and install using rpm package manager or you can use yum package manager directly. In our case, we will use the later since it take cares of might be required dependencies.
sudo yum install https://dl.grafana.com/oss/release/grafana-5.4.2-1.x86_64.rpm
Install Grafana on Fedora 29 from YUM Repos
Since the default repositories for Fedora do not contain Grafana, you need to create the Grafana repos and put the content below;
sudo vim /etc/yum.repos.d/grafana.repo
[grafana]
name=grafana
baseurl=https://packages.grafana.com/oss/rpm
repo_gpgcheck=1
enabled=1
gpgcheck=1
gpgkey=https://packages.grafana.com/gpg.key
sslverify=1
sslcacert=/etc/pki/tls/certs/ca-bundle.crt
Update your system packages.
sudo dnf update
grafana                                         66  B/s | 488  B     00:07
grafana                                        744  B/s | 1.7 kB     00:02
Importing GPG key 0x24098CB6:
 Userid     : "Grafana <[email protected]>"
 Fingerprint: 4E40 DDF6 D76E 284A 4A67 80E4 8C8C 34C5 2409 8CB6
 From       : https://packages.grafana.com/gpg.key
Is this ok [y/N]: y
grafana                                         84 kB/s | 937 kB     00:11
...
Install Grafana with YUM.
sudo dnf install grafana
Start Grafana server service
sudo systemctl start grafana-server
Enable Grafana to start when system reboots
sudo systemctl enable grafana-server
Check the status of Grafana server service
systemctl status grafana-server
● grafana-server.service - Grafana instance
   Loaded: loaded (/usr/lib/systemd/system/grafana-server.service; enabled; vendor preset: disabled)
   Active: active (running) since Tue 2019-01-15 22:38:49 EAT; 18min ago
     Docs: http://docs.grafana.org
 Main PID: 4547 (grafana-server)
    Tasks: 8 (limit: 1749)
   Memory: 10.6M
   CGroup: /system.slice/grafana-server.service
...
Open Grafana TCP port 3000 on firewall.
sudo firewall-cmd --add-port=3000/tcp --permanent
sudo firewall-cmd --reload
Check that Grafana TCP is opened and listening.
netstat -altnp | grep grafana
tcp6       0      0 :::3000                 :::*                    LISTEN      4547/grafana-server
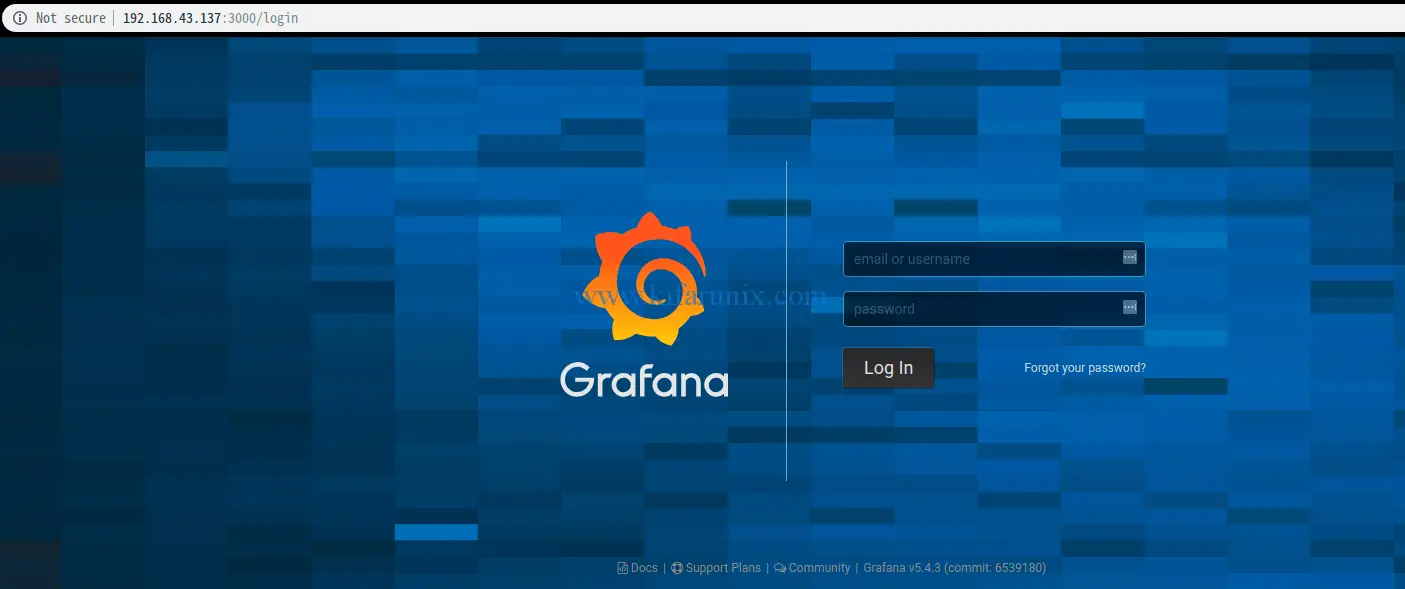
Grafana is now running on Fedora 29. To access the web user interface use the URL, http://server-IP:3000. The Grafana login page welcomes you.
Login using admin as both the username as password. Reset Grafana admin’s password.
Save the new password and proceed to the Grafana dashboard.
Beautiful. That is how to install Grafana monitoring tool on Fedora 29. Stay connected since we will be covering how to collect data from data stores such as Prometheus, InfluxDB into Grafana for graphing and analysis.


