Follow through this guide to learn how to install Filebeat on FreeBSD.
Installing Filebeat on FreeBSD
Filebeat is not available on the default FreeBSD repositories but can be installed from FreeBSD ports.
We use FreeBSD 13.0 in this setup;
freebsd-version13.0-RELEASEInstall Ports Collection on FreeBSD
To use ports to install software in FreeBSD, you need to install portsnap. Portsnap is a fast and user-friendly tool for retrieving the Ports Collection. It connects to a FreeBSD site, verifies the secure key, and downloads a new copy of the Ports Collection.
Thus, to install Ports run system update and upgrade
pkg updatepkg upgrade -f
Download a compressed snapshot of the Ports Collection. The snapshot will be stored under /var/db/portsnap.
portsnap fetchOnce the command above completes, extract. This can only be done if the snapshot was being fetched for the first time.
portsnap extractThe ports are extracted and stored under to /usr/ports.
If the Ports Collection snapshot has already been downloaded before, you can simply update it by running the commands below;
portsnap fetchportsnap update
You can however run this as a single command;
portsnap fetch updateInstalling Filebeat on FreeBSD
To install Filebeat, navigate to beats7 ports directory;
cd /usr/ports/sysutils/beats7Next, you can install Filebeat from FreeBSD beats ports by running the command below;
make install cleanThe command can be used to install various Elastic beats including Filebeat, metricsbeat, packetbeat and heartbeat.
Therefore, since we are installing Filebeat on FreeBSD, we select only Filebeat from the provided options. Select and deselect using space bar.

Once selected, press ENTER to proceed with installation of Filebeat on FreeBSD.
If you noticed, this is gonna install Filebeat 7.10.1;
====> Compressing man pages (compress-man)
===> Staging rc.d startup script(s)
===>  Installing for beats7-7.10.1
===>  Checking if beats7 is already installed
===>   Registering installation for beats7-7.10.1
Installing beats7-7.10.1...
Configuring Filebeat on FreeBSD
The filebeat configuration files are placed under, /usr/local/etc/beats/. In this directory, you can find filebeat sample configuration and the modules directory;
ls /usr/local/etc/beats/filebeat.modules.d filebeat.yml.reference filebeat.yml.sampleThe Filebeat binary is located under /usr/local/sbin/filebeat.
To configure Filebeat, just rename the sample configuration file.
cp /usr/local/etc/beats/filebeat.yml{.sample,}You can now open the /usr/local/etc/beats/filebeat.yml for editing.
vim /usr/local/etc/beats/filebeat.ymlConfigure Filebeat inputs
You can choose to read the log files directly by enabling the type: log input like as shown below;
# filestream is an experimental input. It is going to replace log input in the future.
- type: filestream

  # Change to true to enable this input configuration.
  enabled: true

  # Paths that should be crawled and fetched. Glob based paths.
  paths:
    - /var/log/*.log
Or simply use Filebeat modules.
For example, to enable Filebeat system module;
cd /usr/local/etc/beatsList available modules;
filebeat modules listEnabled:
Disabled:
apache
auditd
elasticsearch
haproxy
icinga
iis
kafka
kibana
logstash
mongodb
mysql
nats
nginx
osquery
postgresql
redis
santa
system
traefikAs you can see, none is enabled by default. Let us enable the system module;
filebeat modules enable systemSample output;
Enabled systemThe Filebeat system modules read system logs from the default system location and this is how the its configuration file looks like;
less /usr/local/etc/beats/filebeat.modules.d/system.yml# Module: system
# Docs: https://www.elastic.co/guide/en/beats/filebeat/7.10/filebeat-module-system.html
- module: system
# Syslog
syslog:
enabled: true
# Set custom paths for the log files. If left empty,
# Filebeat will choose the paths depending on your OS.
#var.paths:
# Authorization logs
auth:
enabled: true
# Set custom paths for the log files. If left empty,
# Filebeat will choose the paths depending on your OS.
#var.paths:Configure Filebeat Output
Next, configure Filebeat to sent event data to Elastic stack. Filebeat can ship logs directly to Elasticsearch or to Logstash or other outputs. The Filebeat output is defined on the Filebeat configuration file, /usr/local/etc/beats/filebeat.yml.
Elasticsearch Output
To send event data or event logs directly to Elasticsearch, open the configuration file and define Elasticsearch output as follows;
vi /usr/local/etc/beats/filebeat.ymlElasticsearch is the default output. All you need to do is update the IP address, Elasticsearch, which is set to localhost by default;
...
#================================ Outputs =====================================

# Configure what output to use when sending the data collected by the beat.

#-------------------------- Elasticsearch output ------------------------------
output.elasticsearch:
  # Array of hosts to connect to.
  #hosts: ["localhost:9200"]
  hosts: ["192.168.57.20:9200"]
...
Logstash Output
If you are instead pushing event data to Logstash, comment out the Elasticsearch output and define Logstash output as shown below;
#================================ Outputs =====================================

# Configure what output to use when sending the data collected by the beat.

#-------------------------- Elasticsearch output ------------------------------
#output.elasticsearch:
  # Array of hosts to connect to.
  #hosts: ["localhost:9200"]

  # Protocol - either `http` (default) or `https`.
  #protocol: "https"

  # Authentication credentials - either API key or username/password.
  #api_key: "id:api_key"
  #username: "elastic"
  #password: "changeme"

#----------------------------- Logstash output --------------------------------
output.logstash:
  # The Logstash hosts
  #hosts: ["localhost:5044"]
  hosts: ["192.168.57.20:5044"]
Save and exit the file.
For each output chosen, ensure that the ports are reachable. For example you can verify connection to Logstash;
telnet 192.168.57.20 5044Trying 192.168.57.20...
Connected to 192.168.57.20.
Escape character is '^]'.Similarly, if you are using Elasticsearch directly, ensure that you can reach port 9200/tcp.
telnet 192.168.57.20 9200
Trying 192.168.57.20...
Connected to 192.168.57.20.
Escape character is '^]'.Test Filebeat Output Destination Connection
Verify that Filebeat can connect to the output destination you have chosen.
To test output connection using the current configuration settings;
filebeat test output -c /usr/local/etc/beats/filebeat.ymlSample output;
elasticsearch: http://192.168.57.20:9200...
  parse url... OK
  connection...
    parse host... OK
    dns lookup... OK
    addresses: 192.168.57.20
    dial up... OK
  TLS... WARN secure connection disabled
  talk to server... OK
  version: 7.10.0
As you can see, our filebeat can connect to our Elasticsearch output.
Test Filebeat Configuration file
To ensure that there is no syntax issues on the current Filebeat configuration file, run the command below;
filebeat test config -c /usr/local/etc/beats/filebeat.ymlIf you get the output, Config OK, then you are good to go.
Load the Filebeat index template in Elasticsearch
If you are sending data directly to Elasticsearch, Filebeat will load the template automatically after successfully connecting to Elasticsearch.
However, if you are using Logstash as the event data process engine, you need to manually load the index template into Elasticsearch. Hence, ensure that there a connection to Elasticsearch before you can load the index template.
If all is well., load the template.
filebeat setup -c /usr/local/etc/beats/filebeat.yml --index-management -E output.logstash.enabled=false -E 'output.elasticsearch.hosts=["192.168.57.20:9200"]'If you see the output, Index setup finished, template load was successful.
If the host doesn’t have direct connectivity to Elasticsearch, you can generate the index template, copy it to Elastic Stack Server and install it locally.
To generate the template;
filebeat -c /usr/local/etc/beats/filebeat.yml export template > filebeat.template.jsonTo install the template on Elastic Stack server, copy it (filebeat.template.json) and load locally on Elasticsearch server.
curl -XPUT -H 'Content-Type: application/json' http://192.168.57.20:9200/_template/filebeat-7.10.1 [email protected]If loaded successfully, you should get such an output, {"acknowledged":true}.
Running Filebeat on FreeBSD
You can run Filebeat in debug mode using the command below;
filebeat -e -c /usr/local/etc/beats/filebeat.yml --path.config /usr/local/etc/beats/ --path.home /usr/local/share/beats/filebeat/ --path.data /var/db/beats/filebeat --path.logs /var/log/beatsThe filebeat will start to harvest the system logs and sent them to the output defined.
You should see such a line;
...
2021-04-16T12:47:08.990+0300	INFO	[registrar]	registrar/registrar.go:109	States Loaded from registrar: 2
2021-04-16T12:47:08.990+0300	INFO	[crawler]	beater/crawler.go:71	Loading Inputs: 2
2021-04-16T12:47:08.992+0300	INFO	log/input.go:157	Configured paths: [/var/log/auth.log* /var/log/secure*]
2021-04-16T12:47:08.992+0300	INFO	log/input.go:157	Configured paths: [/var/log/messages* /var/log/syslog*]
2021-04-16T12:47:08.992+0300	INFO	[crawler]	beater/crawler.go:108	Loading and starting Inputs completed. Enabled inputs: 0
2021-04-16T12:47:08.992+0300	INFO	cfgfile/reload.go:164	Config reloader started
2021-04-16T12:47:08.995+0300	INFO	log/input.go:157	Configured paths: [/var/log/auth.log* /var/log/secure*]
2021-04-16T12:47:08.995+0300	INFO	log/input.go:157	Configured paths: [/var/log/messages* /var/log/syslog*]
2021-04-16T12:47:08.995+0300	INFO	eslegclient/connection.go:99	elasticsearch url: http://192.168.57.20:9200
...
...
2021-04-16T12:48:27.496+0300	INFO	[publisher_pipeline_output]	pipeline/output.go:151	Connection to backoff(elasticsearch(http://192.168.57.20:9200)) established
Well, if you see such errors as;
2021-04-16T12:45:39.840+0300	ERROR	instance/metrics_file_descriptors.go:39	Error while retrieving FD information: error retrieving process stats: cannot find matching process for pid=90737
2021-04-16T12:45:39.840+0300	ERROR	instance/metrics.go:98	Error while getting memory usage: error retrieving process stats: cannot find matching process for pid=90737
2021-04-16T12:45:39.840+0300	ERROR	instance/metrics.go:142	Error retrieving CPU percentages: error retrieving process stats: cannot find matching process for pid=90737
You can disable metrics monitoring;
echo "logging.metrics.enabled: false" >> /usr/local/etc/beats/filebeat.ymlRunning Filebeat as Service on FreeBSD
Enable Filebeat to run on system boot and
You can run Filebeat as service using the command below;
sysrc filebeat_enable="YES"Start Filebeat on FreeBSD;
service filebeat startCheck the logs;
tail -f /var/log/beats/filebeat2021-04-16T13:00:07.421+0300 INFO [index-management.ilm] ilm/std.go:139 do not generate ilm policy: exists=true, overwrite=false
2021-04-16T13:00:07.421+0300 INFO [index-management] idxmgmt/std.go:274 ILM policy successfully loaded.
2021-04-16T13:00:07.421+0300 INFO [index-management] idxmgmt/std.go:407 Set setup.template.name to '{filebeat-7.10.1 {now/d}-000001}' as ILM is enabled.
2021-04-16T13:00:07.421+0300 INFO [index-management] idxmgmt/std.go:412 Set setup.template.pattern to 'filebeat-7.10.1-*' as ILM is enabled.
2021-04-16T13:00:07.421+0300 INFO [index-management] idxmgmt/std.go:446 Set settings.index.lifecycle.rollover_alias in template to {filebeat-7.10.1 {now/d}-000001} as ILM is enabled.
2021-04-16T13:00:07.421+0300 INFO [index-management] idxmgmt/std.go:450 Set settings.index.lifecycle.name in template to {filebeat {"policy":{"phases":{"hot":{"actions":{"rollover":{"max_age":"30d","max_size":"50gb"}}}}}}} as ILM is enabled.
2021-04-16T13:00:07.422+0300 INFO template/load.go:97 Template filebeat-7.10.1 already exists and will not be overwritten.
2021-04-16T13:00:07.422+0300 INFO [index-management] idxmgmt/std.go:298 Loaded index template.
2021-04-16T13:00:07.424+0300 INFO [index-management] idxmgmt/std.go:309 Write alias successfully generated.
2021-04-16T13:00:07.429+0300 INFO [publisher_pipeline_output] pipeline/output.go:151 Connection to backoff(elasticsearch(http://192.168.57.20:9200)) establishedVerify Elasticsearch Index Data Reception
Next, login to Elastic stack server and verify data reception.
curl -X GET 192.168.57.20:9200/_cat/indices?vhealth status index uuid pri rep docs.count docs.deleted store.size pri.store.size
yellow open filebeat-7.10.1-2021.04.16-000001 CbQmXaRzQ4G9n1wldgvwbg 1 1 1022 0 222.2kb 222.2kb
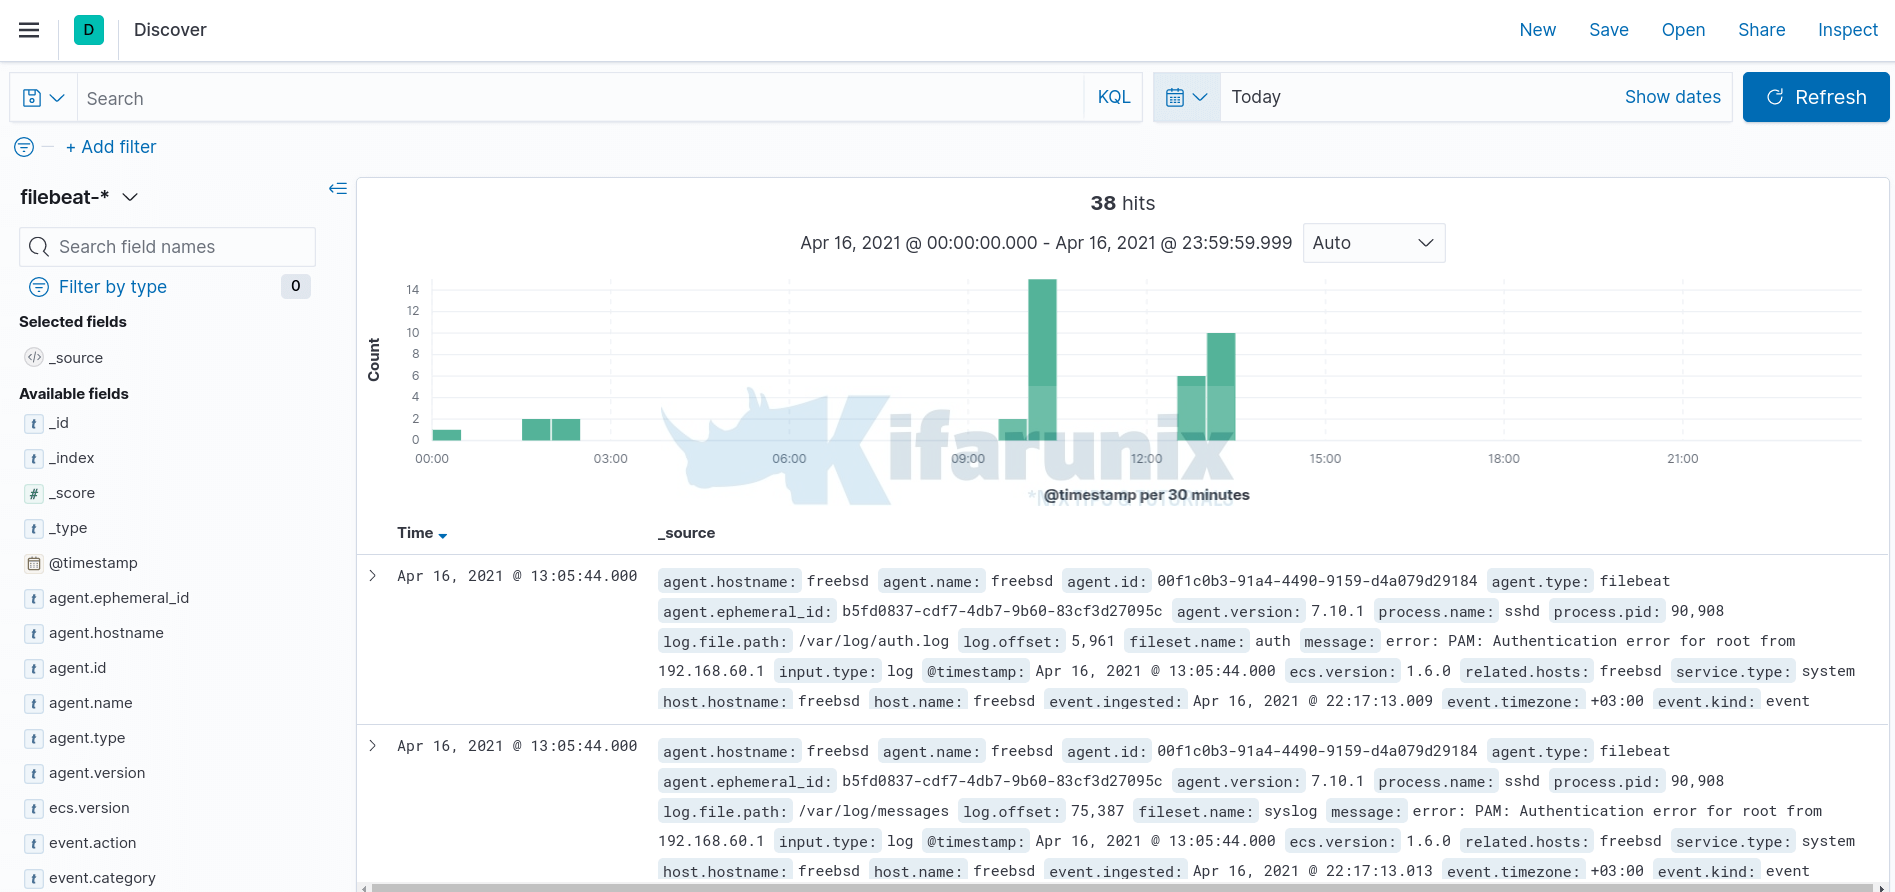
green open .apm-custom-link YUZ3YLcBRqqA16bFXrPWEg 1 0 0 0 208b ...After that, proceed to the Kibana and Create Index Pattern. and check your index data on Discover;
I have simulated some few authentication events as evident here;

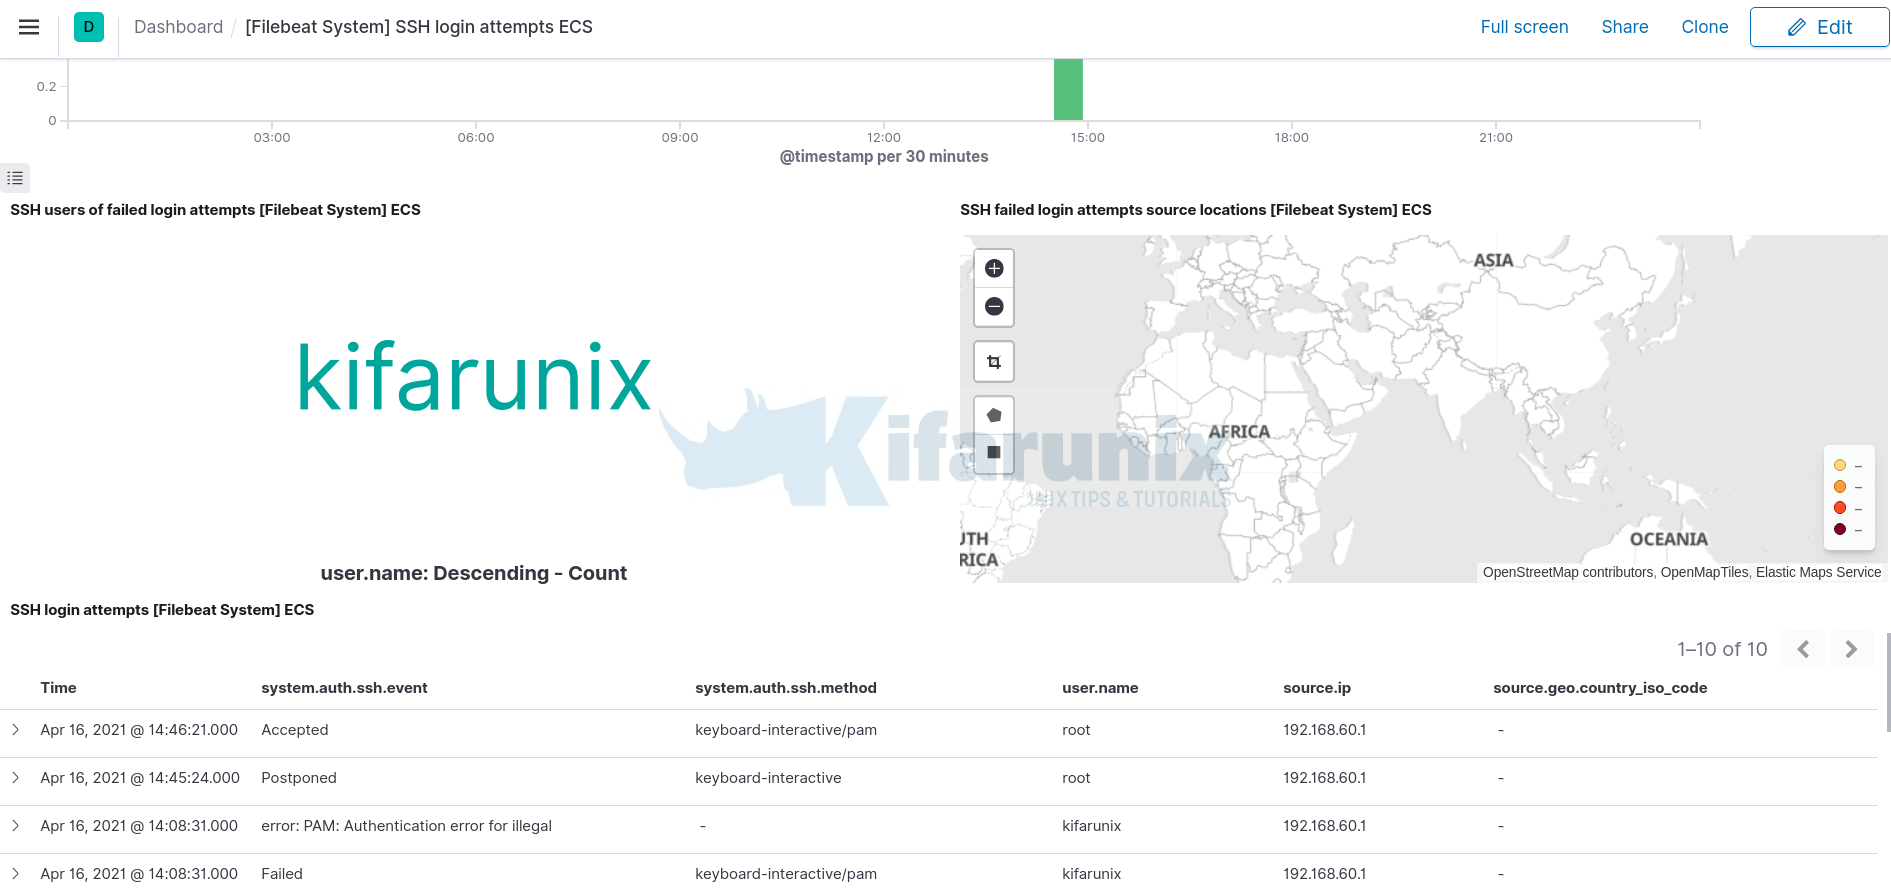
If you have already loaded the default dashboards, you should be able to visualize authentication events on dashboard.

And that marks our end on how to install Filebeat.
Other Tutorials
How to run Multiple Filebeat Instances in Linux

