This tutorial will take you through how you can install and enroll Elastic agents to Fleet manager in Linux. According to Elastic Fleet and Elastic Agent overview page;
- Elastic Agent is a single, unified way to add monitoring for logs, metrics, and other types of data to each host. A single agent makes it easier and faster to deploy monitoring across your infrastructure. The agent’s single, unified policy makes it easier to add integrations for new data sources.
- Fleet provides a web-based UI in Kibana to add and manage integrations for popular services and platforms, as well as manage a fleet of Elastic Agents.
Installing Elastic Agents to Fleet Manager in Linux
Setup Elastic Fleet Server
In our previous tutorial, we learned how to ship logs to ELK stack using Elastic agents. The guide focused on setting up Fleet Server and installing Elastic agent on the Fleet server.
Ship System Logs to ELK Stack using Elastic Agents
Install Elastic Agent on Remote Hosts to Monitor
In this example setup, we have two remote hosts to monitor; Debian 11 and Rocky Linux systems.
There are various ways in which you can install Elastic agents;
- Using Tar archive
- Using DEB or RPM binary
- Install directly from Elastic repositories.
In Linux systems, it is recommended to install Elastic agent using the TAR archive over system packages (RPM/DEB) as it makes it easy to upgrade the agent in Fleet.
Thus, we will be installing our Elastic agents in Linux using this method.
Download Elastic Agent Tar Archive
Navigate to Elastic Agents downloads page and grab the installer for your respective system architecture.
The command below downloads Elastic Agent v7.16.0 for x86_64 systems;
wget https://artifacts.elastic.co/downloads/beats/elastic-agent/elastic-agent-7.16.0-linux-x86_64.tar.gzExtract the installer
Once download is complete, extract the installer;
tar xzf elastic-agent-7.16.0-linux-x86_64.tar.gzAdd Elastic Agent to Fleet
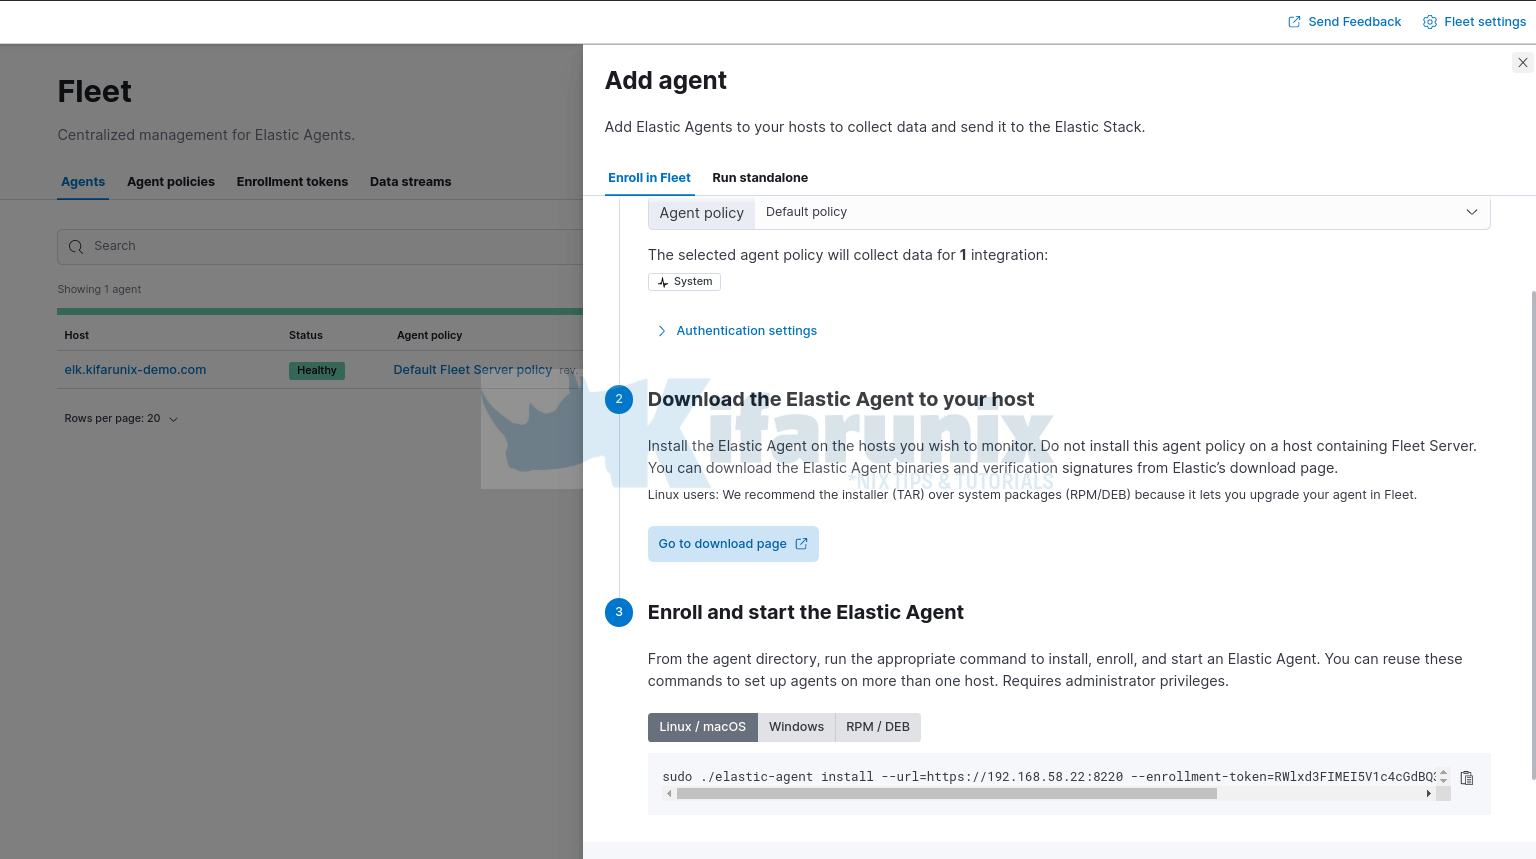
Next, login back to Kibana and head over to Fleet > Agents > Add agent.
- Choose the default agent policy already defined
- Skip the agent installer download as this is already done above.

Enroll Elastic Agent into Fleet Server
Copy the enrollment command and run on the remote host where you are installing the agent.
The command for my case looks like;
sudo ./elastic-agent install --url=https://192.168.58.22:8220 --enrollment-token=RWlxd3FIMEI5V1c4cGdBQ3dPdks6ZFpNTmp3d1BSWUtER0RJYjlwSzQtdw==On the remote host where you downloaded the Elastic agent installer, navigate to agent installer directory;
cd elastic-agent-7.16.0-linux-x86_64/Paste the copied agent installation and enrollment command from the Fleet server and execute it within the agent archive directory.
NOTE: if your Fleet server is using TLS certificates, you need to copy the Fleet server CA to some directory on the agent host.
In our agent host, we used /etc/elasticsearch/ca/ca.crt from our Fleet server setup and placed it in the file /etc/ssl/certs/ca.crt.
sudo ./elastic-agent install -f \
--url=https://192.168.58.22:8220 \
--certificate-authorities=/etc/ssl/certs/ca.crt \
--enrollment-token=RWlxd3FIMEI5V1c4cGdBQ3dPdks6ZFpNTmp3d1BSWUtER0RJYjlwSzQtdw==
Sample installation output;
2021-12-12T20:07:06.564+0300	INFO	cmd/enroll_cmd.go:442	Starting enrollment to URL: https://192.168.58.22:8220/
2021-12-12T20:07:11.089+0300	INFO	cmd/enroll_cmd.go:250	Successfully triggered restart on running Elastic Agent.
Successfully enrolled the Elastic Agent.
Elastic Agent has been successfully installed.
You can reuse the same installation command across multiple hosts.
The agent will be installed at /opt/Elastic/Agent and will run as a service.
ls -1 /opt/Elastic/Agent/data
elastic-agent
elastic-agent-20211212203445
elastic-agent.reference.yml
elastic-agent.yml
elastic-agent.yml.2021-12-12T20-34-44.0411.bak
fleet.yml
fleet.yml.lock
LICENSE.txt
NOTICE.txt
README.md
Checking the status of the Elastic agent;
systemctl status elastic-agent● elastic-agent.service - Elastic Agent is a unified agent to observe, monitor and protect your system.
Loaded: loaded (/etc/systemd/system/elastic-agent.service; enabled; vendor preset: disabled)
Active: active (running) since Sun 2021-12-12 20:34:39 EAT; 1min 55s ago
Main PID: 5825 (elastic-agent)
Tasks: 10 (limit: 11388)
Memory: 43.8M
CGroup: /system.slice/elastic-agent.service
└─5825 elastic-agent
Dec 12 20:34:40 rocky8 elastic-agent[5825]: 2021-12-12T20:34:40.974+0300 INFO [api] api/server.go:64 Metrics endpoint listening on: /opt/Elasti>
Dec 12 20:34:40 rocky8 elastic-agent[5825]: 2021-12-12T20:34:40.975+0300 INFO application/local_mode.go:178 Agent is stopped
Dec 12 20:34:40 rocky8 elastic-agent[5825]: 2021-12-12T20:34:40.975+0300 INFO application/periodic.go:79 Configuration changes detected
Dec 12 20:34:40 rocky8 elastic-agent[5825]: 2021-12-12T20:34:40.980+0300 INFO stateresolver/stateresolver.go:48 New State ID is aqYAlQPW
Dec 12 20:34:40 rocky8 elastic-agent[5825]: 2021-12-12T20:34:40.981+0300 INFO stateresolver/stateresolver.go:49 Converging state requires execution of>
Dec 12 20:34:45 rocky8 elastic-agent[5825]: 2021-12-12T20:34:45.091+0300 INFO operation/operator.go:216 waiting for installer of pipeline 'default' to>
Dec 12 20:34:45 rocky8 elastic-agent[5825]: 2021-12-12T20:34:45.350+0300 INFO application/periodic.go:101 No configuration change
Dec 12 20:34:45 rocky8 elastic-agent[5825]: 2021-12-12T20:34:45.350+0300 INFO process/app.go:176 Signaling application to stop because of shutdown: me>
Dec 12 20:34:45 rocky8 elastic-agent[5825]: 2021-12-12T20:34:45.357+0300 INFO stateresolver/stateresolver.go:48 New State ID is aqYAlQPW
Dec 12 20:34:45 rocky8 elastic-agent[5825]: 2021-12-12T20:34:45.695+0300 INFO stateresolver/stateresolver.go:49 Converging state requires execution
Stop the agent;
systemctl stop elastic-agentConfigure Elasticsearch – Elastic Agent TLS connection
If Elasticsearch is running on HTTP, the command above should just work and the agent should start sending logs immediately to the server.
However, if you setup Elasticsearch with TLS as we did in our guide above while setting up Fleet server, then you need to configure Elastic agent Filebeat and Metricbeat to connect to Elasticsearch via an encrypted and authenticated channel.
Therefore, copy the Elasticsearch CA to the agent host.
In our Fleet server setup, the cert is /etc/elasticsearch/kifarunix-demo-fleet-server/kifarunix-demo-fleet-server.crt.
Hence, we copied and placed it on the agent host under, /etc/ssl/certs/kifarunix-demo-fleet-server.crt.
Edit both Elastic agent Filebeat and Metricbeat configuration files and;
- Set the IP address of Elasticsearch (localhost by default).
- Specify protocol (https) and the path to Elasticsearch CA cert if using HTTPS protocol
- Set the authenticating username and credentials (You can create separate user and roles for this purpose. But in this demo setup, we used default Elastic user credentials. NOTE that ir is not recommended to use the superuser elastic).
Update Filebeat configs;
vim /opt/Elastic/Agent/data/elastic-agent-4bcd95/install/filebeat-7.16.0-linux-x86_64/filebeat.ymlUpdate Elasticsearch output configs;
# ---------------------------- Elasticsearch Output ----------------------------
output.elasticsearch:
  # Array of hosts to connect to.
  hosts: ["192.168.58.22:9200"]

  # Protocol - either `http` (default) or `https`.
  protocol: "https"
  ssl.certificate_authorities: ["/etc/ssl/certs/kifarunix-demo-fleet-server.crt"]

  # Authentication credentials - either API key or username/password.
  #api_key: "id:api_key"
  username: "elastic"
  password: "WSZdCjtgn9c8Pphd4St4"
Similarly, update the Metricbeat configs just like above;
vim /opt/Elastic/Agent/data/elastic-agent-4bcd95/install/metricbeat-7.16.0-linux-x86_64/metricbeat.yml# ---------------------------- Elasticsearch Output ----------------------------
output.elasticsearch:
# Array of hosts to connect to.
hosts: ["192.168.58.22:9200"]
# Protocol - either `http` (default) or `https`.
protocol: "https"
ssl.certificate_authorities: ["/etc/ssl/certs/kifarunix-demo-fleet-server.crt"]
# Authentication credentials - either API key or username/password.
#api_key: "id:api_key"
username: "elastic"
password: "WSZdCjtgn9c8Pphd4St4"
Start Elastic Agent
systemctl start elastic-agentVerify Elastic Agent Enrollment
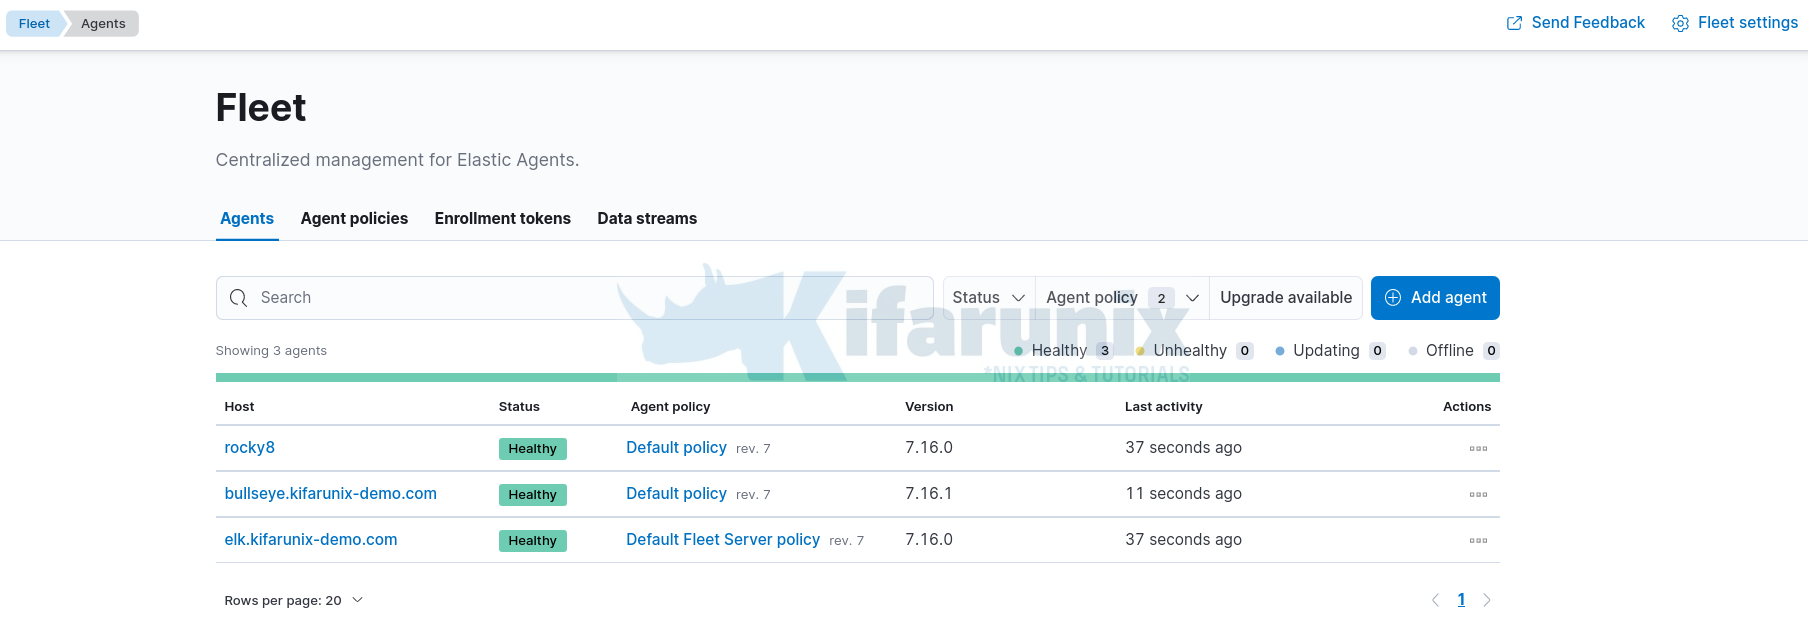
The Elastic agents have now been installed and enrolled to the Fleet Server. Check on the Fleet UI;
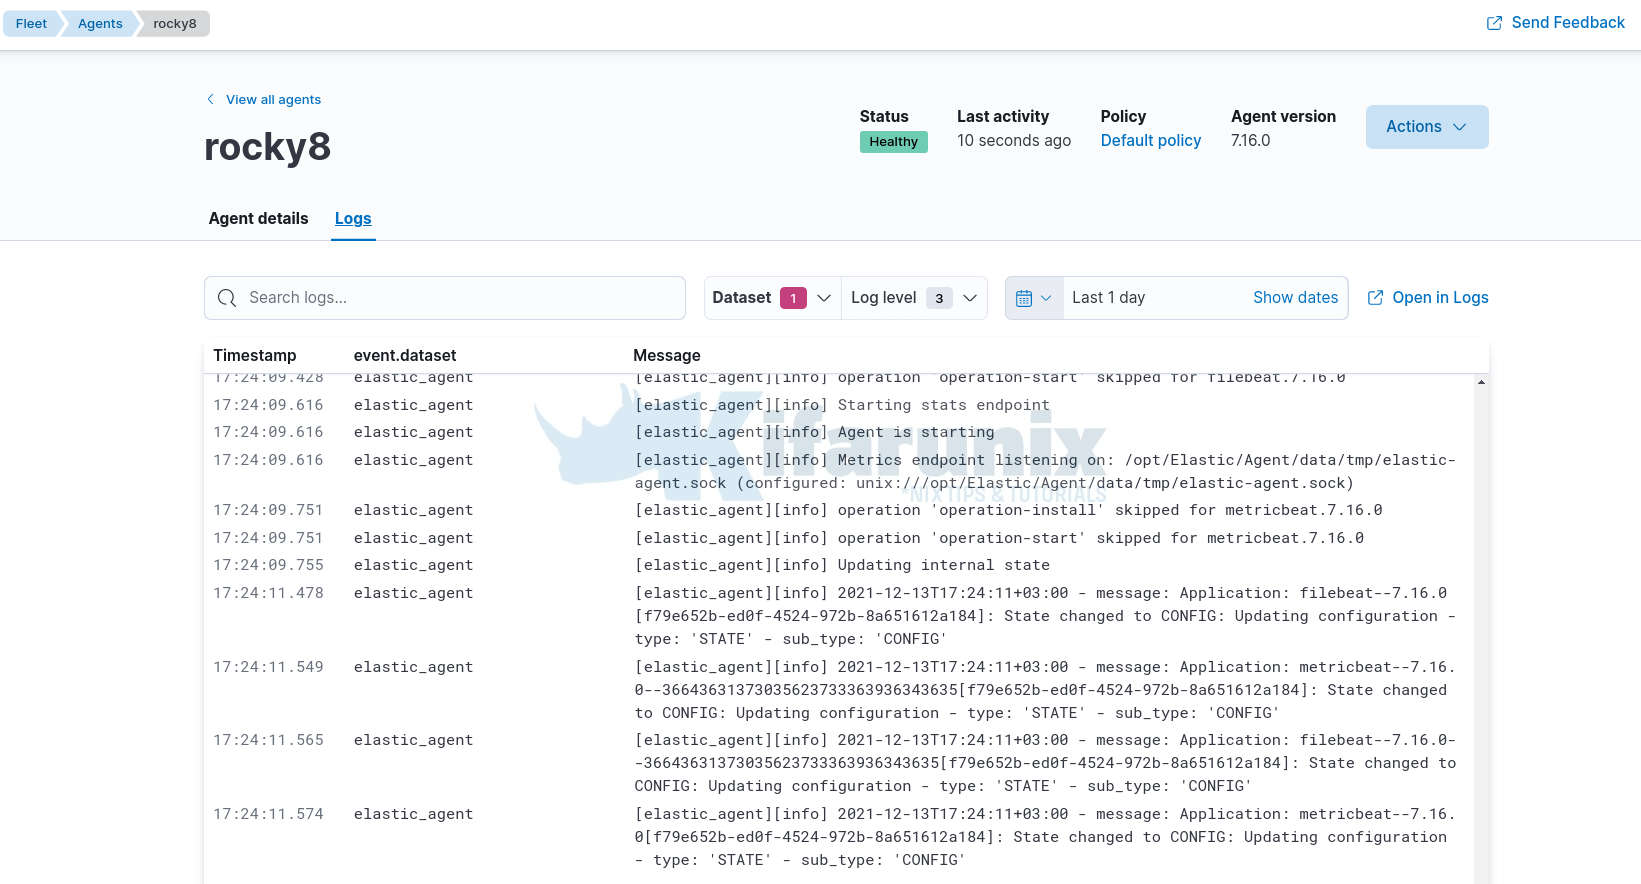
Agent status should at least be Healthy.

Click on the agent to view details.

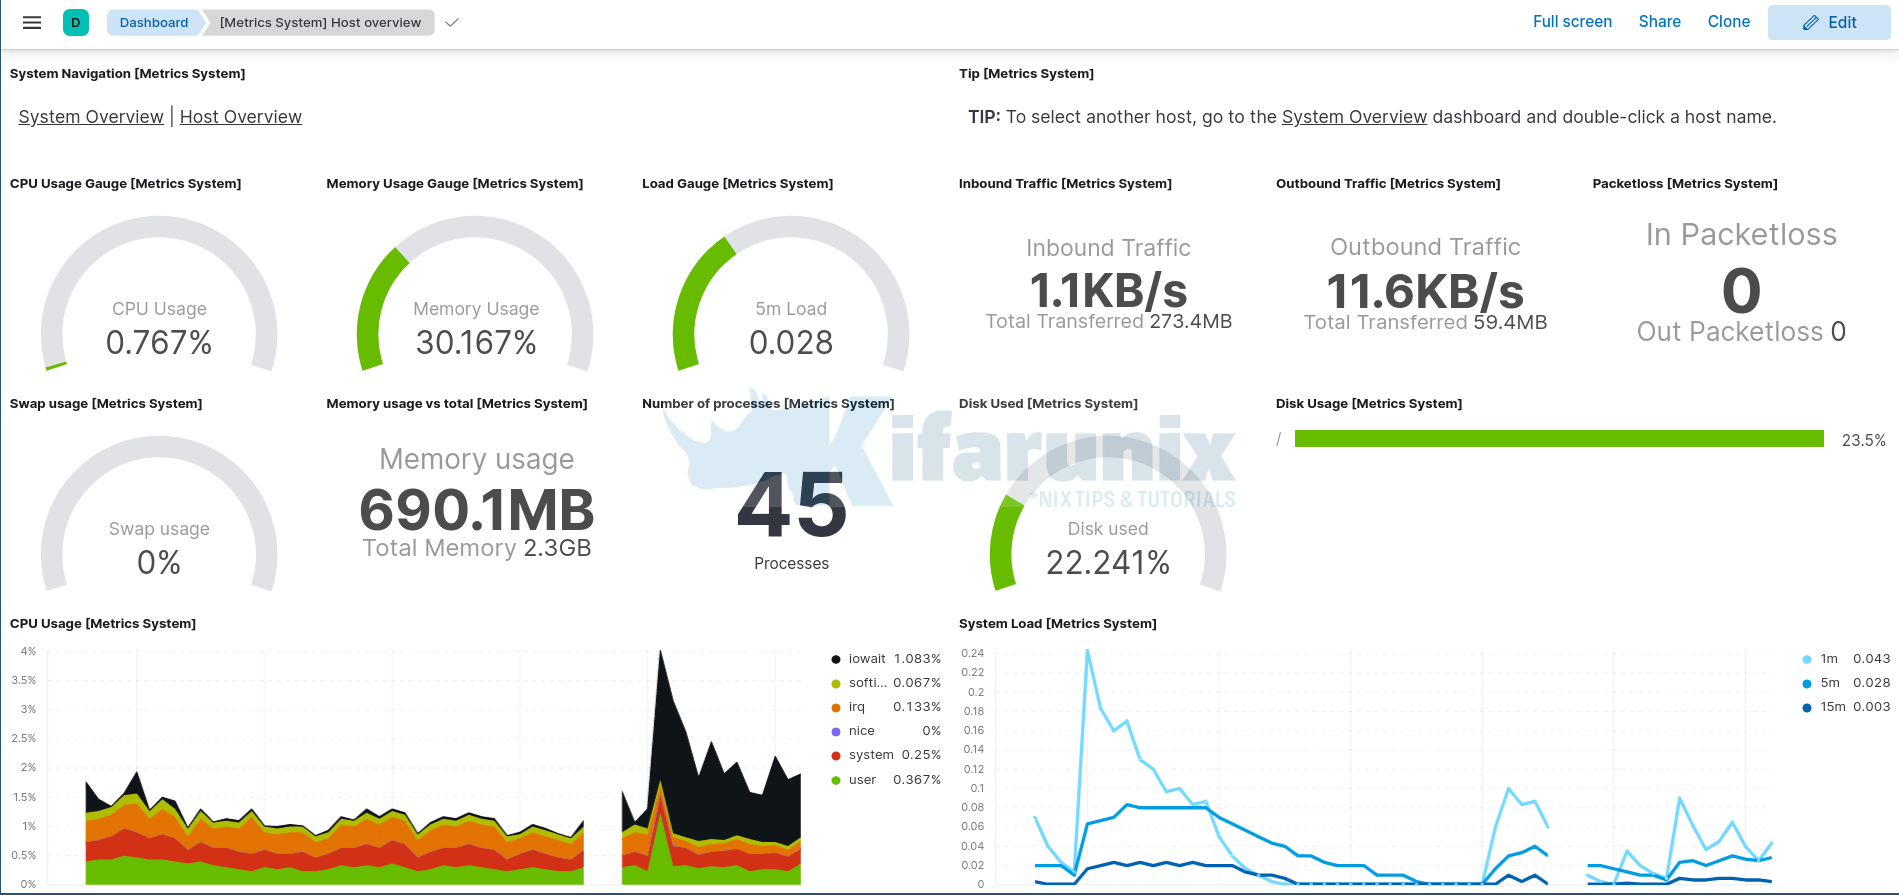
Sample dashboards.

You can filter for specific host using the respective filters on the search bar.
And that concludes our guide.
Also see how you can enroll and monitor Windows systems using Elastic Osquery Manager;
Monitor Windows Systems using Elastic Osquery Manager
Reference
Other Tutorials
Integrate Wazuh Manager with ELK Stack


Wow wow
This is am awesome articles on spinning up elastic stack cluster. After struggling to get my elasticsearch 7.17.1 cluster right for more than 2 weeks, I found this blog and followed it carefully and all now is working.
Keep on doing great job.
Thank you so much
We are glad the tutorial helped! enjoy