Welcome to our guide on how to install and configure Prometheus on CentOS 8. Prometheus is an open-source time series collection and processing monitoring system with a dimensional data model, flexible query language, efficient time series database and modern alerting approach.
Installing Prometheus on CentOS 8
Want to Install Prometheus on Ubuntu 18/Debian 9. Check the links below;
Install Prometheus on Ubuntu 18.04
Install and Configure Prometheus on Debian 9
Create Prometheus System User and Group
Run the command below to create prometheus system user and group.
useradd -M -r -s /bin/false prometheusTo verify this, you can try to print prometheus user and group information using the id command;
getent passwd prometheus
prometheus:x:986:985::/home/prometheus:/bin/false
Create Prometheus Configuration Directories
Since we are installing Prometheus from source, you need to create the respective configuration directories.
mkdir /etc/prometheus
mkdir /var/lib/prometheus
Download Prometheus Tarball
In order to install the latest version of Prometheus, navigate to the Download’s Page and grab Prometheus binary for your platform. You can simply run the command below to download version 2.14.0 (latest version as of this writing) for Linux systems.
wget https://github.com/prometheus/prometheus/releases/download/v2.14.0/prometheus-2.14.0.linux-amd64.tar.gz -P /tmpExtract Prometheus Tarball
Once the download is done, extract the archive.
cd /tmptar -xzf prometheus-2.14.0.linux-amd64.tar.gzls prometheus-2.14.0.linux-amd64console_libraries consoles LICENSE NOTICE prometheus prometheus.yml promtool tsdbCopy the two Prometheus binary files, prometheusand promtool, under the extracted Prometheus archive directory to the /usr/local/bin directory.
cp prometheus-2.14.0.linux-amd64/{prometheus,promtool} /usr/local/bin/Copy the consoles/ and console_libraries/ directories to /etc/prometheus directory created above.
cp -r prometheus-2.14.0.linux-amd64/{consoles,console_libraries} /etc/prometheus/Configure Prometheus on CentOS 8
The sample Prometheus configuration file, prometheus.yml, is located under the extracted archive directory.
Since we are doing a basic setup, we will copy the configuration file and modify it as follows such that it can scrape the local system only (Prometheus server).
cp prometheus-2.14.0.linux-amd64/prometheus.yml /etc/prometheus/Next, open the configuration file for modification and adjust it such that it looks like;
vim /etc/prometheus/prometheus.yml# my global config
global:
scrape_interval: 15s # Set the scrape interval to every 15 seconds. Default is every 1 minute.
evaluation_interval: 15s # Evaluate rules every 15 seconds. The default is every 1 minute.
# scrape_timeout is set to the global default (10s).
# A scrape configuration containing exactly one endpoint to scrape:
# Here it's Prometheus itself.
scrape_configs:
# The job name is added as a label `job=<job_name>` to any timeseries scraped from this config.
- job_name: 'prometheus'
# metrics_path defaults to '/metrics'
# scheme defaults to 'http'.
static_configs:
- targets: ['localhost:9090']Allow Prometheus through firewall.
firewall-cmd --add-port=9090/tcp --permanentReload firewalld
firewall-cmd --reloadSet Proper Ownership on Configuration Files and Directories
Run the command below to set the ownership (owner and group) of Prometheus configuration files and directories to prometheus.
chown -R prometheus:prometheus /etc/prometheuschown -R prometheus:prometheus /var/lib/prometheuschown prometheus.prometheus /usr/local/bin/{prometheus,promtool}Starting Prometheus
To start Prometheus with our basic configuration file,run:
prometheus --config.file=/etc/prometheus/prometheus.yml...
level=info ts=2019-11-13T17:33:55.867Z caller=main.go:743 msg="Loading configuration file" filename=/etc/prometheus/prometheus.yml
level=info ts=2019-11-13T17:33:56.353Z caller=main.go:771 msg="Completed loading of configuration file" filename=/etc/prometheus/prometheus.yml
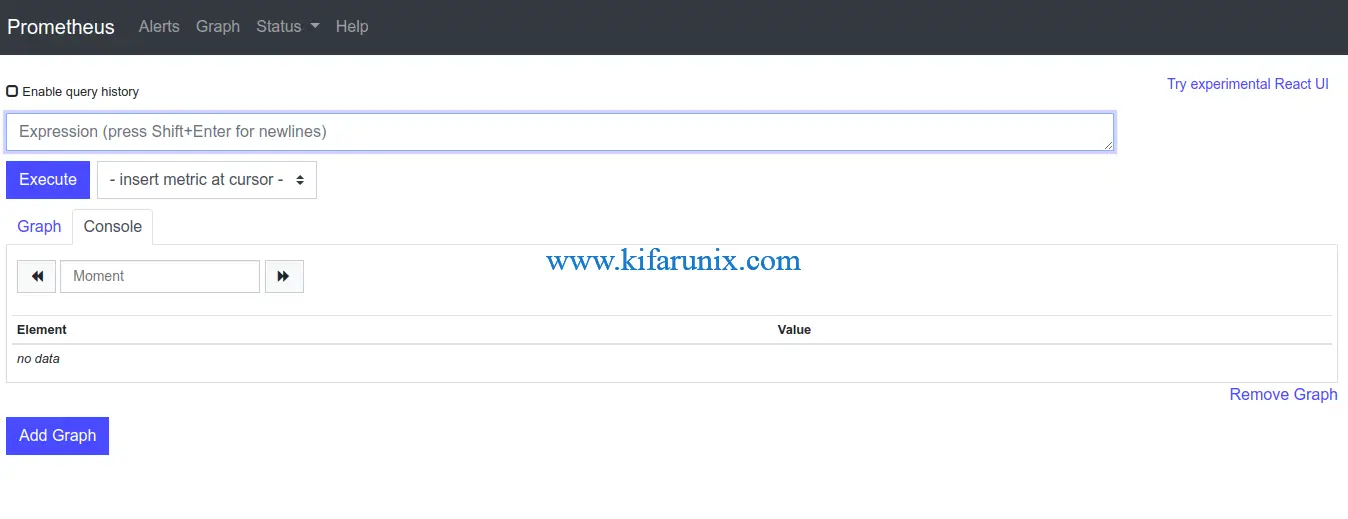
level=info ts=2019-11-13T17:33:56.353Z caller=main.go:626 msg="Server is ready to receive web requests."You should able to access the Prometheus status page at http://localhost:9090 if you are accessing the server locally or http://<server-IP>:9090 if you are accessing remotely.

Create Prometheus Systemd Service file
To be able to run Prometheus as a service, you need to create a systemd service file, /etc/systemd/system/prometheus.service, configured as follows.
Note that this assumes Prometheus server is listening on default port 9090.
vim /etc/systemd/system/prometheus.service[Unit]
Description=Prometheus Time Series Collection and Processing Server
Wants=network-online.target
After=network-online.target
[Service]
User=prometheus
Group=prometheus
Type=simple
ExecStart=/usr/local/bin/prometheus \
--config.file /etc/prometheus/prometheus.yml \
--storage.tsdb.path /var/lib/prometheus/ \
--web.console.templates=/etc/prometheus/consoles \
--web.console.libraries=/etc/prometheus/console_libraries
[Install]
WantedBy=multi-user.targetReload systemd daemon configuration.
systemctl daemon-reloadStart and Enable Prometheus service to run at boot time.
systemctl enable --now prometheusCheck the status
systemctl status prometheus● prometheus.service - Prometheus Time Series Collection and Processing Server
Loaded: loaded (/etc/systemd/system/prometheus.service; enabled; vendor preset: disabled)
Active: active (running) since Wed 2019-11-13 20:47:02 EAT; 24s ago
Main PID: 2931 (prometheus)
Tasks: 7 (limit: 5072)
Memory: 23.2M
CGroup: /system.slice/prometheus.service
└─2931 /usr/local/bin/prometheus --config.file /etc/prometheus/prometheus.yml --storage.tsdb.path /var/lib/prometheus/ --web.console.libraries=/etc/prometheus/console_librariesCheck that prometheus is listening on TCP port 9090.
lsof -i :9090COMMAND PID USER FD TYPE DEVICE SIZE/OFF NODE NAME
prometheu 2931 prometheus 3u IPv6 39243 0t0 TCP localhost:websm->localhost:45648 (ESTABLISHED)
prometheu 2931 prometheus 7u IPv6 39251 0t0 TCP localhost:47936->localhost:websm (ESTABLISHED)
prometheu 2931 prometheus 8u IPv6 39239 0t0 TCP *:websm (LISTEN)
prometheu 2931 prometheus 9u IPv6 39252 0t0 TCP localhost:websm->localhost:47936 (ESTABLISHED)
prometheu 2931 prometheus 10u IPv4 39242 0t0 TCP localhost:45648->localhost:websm (ESTABLISHED)Great, Prometheus is now running as a service.
You can now check the status of the connected targets. Click Status dropdown and then Targets. At the moment, we only have Prometheus scraping the localhost on which it is running.

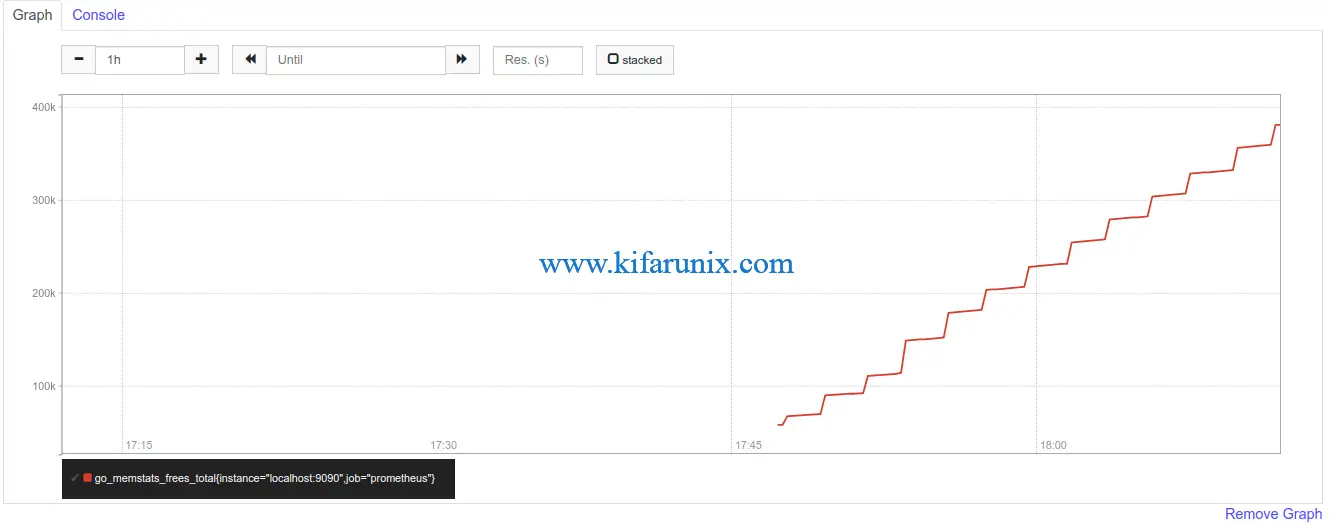
You can also check local system metrics for example to check memory statistics for example “go_memstats_frees_total“.

For graphical overview, click Graph.

Feel free to explore more about Prometheus here.
In our next guides, we will be covering how to monitor other targets using Prometheus. Enjoy.
Related Tutorials
Integrate Prometheus with Grafana for Monitoring

