In this tutorial, you will learn how to monitor Linux system metrics using Sensu. Sensu is an opensource infrastructure and application monitoring tool. You will learn to monitor such metrics as CPU usage, memory usage, disk usage e.t.c.
Table of Contents
Monitor Linux System Metrics using Sensu
In order to monitor Linux system metrics using Sensu, you need to have a running Sensu Backend server as well Sensu agent installed on the remote system whose metrics is being monitored.
The guides below can help setup the backend server as well deploy Sensu agent on some Linux distros.
Installing Sensu Backend;
Install Sensu Go on Ubuntu 22.04
Installing Sensu Agent;
Install Sensu Agent on Ubuntu/Debian
Install Sensu Agent on Rocky Linux
Once you are set, so how can you monitor Linux system metrics using Sensu?
Configure Sensu Agent Entity Subscription
- Sensu agent entity is a remote monitoring agent being monitored
- Sensu works in a pubsub (Publish/Subcribe) communication model whereby Sensu backend publishes the service monitoring checks and the Sensu agent entities running on the remote end points being monitored subscribe to the service monitoring checks (topics) published by the Sensu backend.
- checks are the commands or scripts that the Sensu agent executes, output data and produce an exit code to indicate a state.
- A subscription thus can contain multiple types of checks. For example, you have a subscription named Linux with the CPU load, Memory usage, disk usage… checks.
You can manage Sensu agent entities using the sensuctl entity command;
sensuctl entity --helpTo configure a Sensu agent entity subscription, first extract the ID of the agent;
sensuctl entity listSample output;
     ID      Class    OS      Subscriptions              Last Seen
─────────── ─────── ─────── ───────────────── ────────────────────────────────
  debian11   agent   linux   entity:debian11   2022-05-07 08:04:05 +0000 UTC
  rocky8     agent   linux   entity:rocky8     2022-05-07 08:03:57 +0000 UTC
From the output above, you can see the subscriptions for the agents. We need to update the subscriptions for these agents.
For example, since we have two Linux systems, let’s enroll them in a subscription called linux by updating these agents entities.
Use the command;
sensuctl entity update [ID] [flags]For example, to update the Subscription to debian11 agent entity;
sensuctl entity update debian11When prompted, enter agent for Entity Class and linux for subscription.
Sample output;
? Entity Class: agent
? Subscriptions: linux
Updated
Do the same for the other agents;
Confirm the changes;
sensuctl entity listInstall Sensu Check Plugins on the Sensu Backend
Next, install Sensu check plugins on the Sensu backend. We use dynamic runtime assets in this setup.
There are multiple plugins available that can be used to monitor system metrics using Sensu. You can check them on the Bonsai Sensu Assets repository.
As an example, we will install the Sensu check plugins to check CPU usage, memory usage, disk usage
Install Sensu CPU Usage check plugin;
sensuctl asset add sensu/check-cpu-usage -r check-cpu-usageOption -r changes the name of the Check on the system.
Sample installation output;
no version specified, using latest: 0.2.2
fetching bonsai asset: sensu/check-cpu-usage:0.2.2
added asset: sensu/check-cpu-usage:0.2.2

You have successfully added the Sensu asset resource, but the asset will not get downloaded until
it's invoked by another Sensu resource (ex. check). To add this runtime asset to the appropriate
resource, populate the "runtime_assets" field with ["check-cpu-usage"].
Install Sensu Disk Usage check plugin;
sensuctl asset add sensu/check-disk-usage -r check-disk-usageInstall Sensu Memory and Swap Usage check plugin;
sensuctl asset add sensu/check-memory-usage -r check-memory-usageList the installed dynamic runtime assets;
sensuctl asset list Name URL Hash
───────────────────── ─────────────────────────────────────────────────────────────────────────────── ──────────
check-cpu-usage //assets.bonsai.sensu.io/.../check-cpu-usage_0.2.2_windows_amd64.tar.gz 900cfdf
check-cpu-usage //assets.bonsai.sensu.io/.../check-cpu-usage_0.2.2_darwin_amd64.tar.gz db81ee7
check-cpu-usage //assets.bonsai.sensu.io/.../check-cpu-usage_0.2.2_linux_armv7.tar.gz 400aacc
check-cpu-usage //assets.bonsai.sensu.io/.../check-cpu-usage_0.2.2_linux_arm64.tar.gz bef7802
check-cpu-usage //assets.bonsai.sensu.io/.../check-cpu-usage_0.2.2_linux_386.tar.gz a2dcb53
check-cpu-usage //assets.bonsai.sensu.io/.../check-cpu-usage_0.2.2_linux_amd64.tar.gz 2453973
check-disk-usage //assets.bonsai.sensu.io/.../check-disk-usage_0.7.0_windows_amd64.tar.gz e28c0da
check-disk-usage //assets.bonsai.sensu.io/.../check-disk-usage_0.7.0_darwin_amd64.tar.gz 2b3a8f1
check-disk-usage //assets.bonsai.sensu.io/.../check-disk-usage_0.7.0_linux_armv7.tar.gz 0c2c5ce
check-disk-usage //assets.bonsai.sensu.io/.../check-disk-usage_0.7.0_linux_arm64.tar.gz f5234e9
check-disk-usage //assets.bonsai.sensu.io/.../check-disk-usage_0.7.0_linux_386.tar.gz 102f2ca
check-disk-usage //assets.bonsai.sensu.io/.../check-disk-usage_0.7.0_linux_amd64.tar.gz 0b76e77
check-memory-usage //assets.bonsai.sensu.io/.../check-memory-usage_0.2.2_windows_amd64.tar.gz 90a997a
check-memory-usage //assets.bonsai.sensu.io/.../check-memory-usage_0.2.2_darwin_amd64.tar.gz 57ebebe
check-memory-usage //assets.bonsai.sensu.io/.../check-memory-usage_0.2.2_linux_armv7.tar.gz 6f7d0d2
check-memory-usage //assets.bonsai.sensu.io/.../check-memory-usage_0.2.2_linux_arm64.tar.gz 94a41f3
check-memory-usage //assets.bonsai.sensu.io/.../check-memory-usage_0.2.2_linux_386.tar.gz 125f9c1
check-memory-usage //assets.bonsai.sensu.io/.../check-memory-usage_0.2.2_linux_amd64.tar.gz 663985d
Create Sensu Monitoring Command Checks
Now that we have the monitoring plugin assets in place, you then need to create the monitoring command checks based to the dynamic monitoring assets installed.
The command checks can be created using the command sensuctl check create.
sensuctl check create --helpAt the very list, you need to define the;
--command/-c: command to run and respective threshold parameters. E.G to use the check CPU usage runtime plugin installed above,check-cpu-usage -w 80 -c 90. This sets warning at 80% cpu usage and critical alert on 90% cpu usage.--interval/-i: interval, in seconds, at which the check is run--subscriptions/-s: comma separated list of topics check requests will be sent to.--runtime-assets/-r: comma separated list of assets this check depends on.
Create Command check for CPU Usage
sensuctl check create check_cpu -c 'check-cpu-usage -w 80 -c 90' -i 300 -s linux -r check-cpu-usageOutput should be Created.
Create Command check for Disk Usage
sensuctl check create check_disk -c 'check-disk-usage -w 75 -c 85' -i 300 -s linux -r check-disk-usageCreate Command check for Memory/Swap Usage
sensuctl check create check_mem -c 'check-memory-usage -w 75 -c 90' -i 300 -s linux -r check-memory-usagesensuctl check create check_swap -c 'check-swap-usage -w 75 -c 90' -i 300 -s linux -r check-memory-usageList Check commands;
sensuctl check list Name Command Interval Cron Timeout TTL Subscriptions Handlers Assets Hooks Publish? Stdin? Metric Format Metric Handlers
───────────── ──────────────────────────────── ────────── ────── ───────── ───── ─────────────── ────────── ──────────────────── ─────── ────────── ──────── ─────────────── ──────────────────
check_cpu check-cpu-usage -w 80 -c 90 300 0 0 linux check-cpu-usage true false
check_disk check-disk-usage -w 75 -c 85 300 0 0 linux check-disk-usage true false
check_mem check-memory-usage -w 75 -c 90 300 0 0 linux check-memory-usage true false
check_swap check-swap-usage -w 75 -c 90 300 0 0 linux check-memory-usage true false
You can also check the resource definition of a check using the command sensuctl check info [ID] [flags];
sensuctl check info check_mem --format yamltype: CheckConfig
api_version: core/v2
metadata:
created_by: sensuadmin
name: check_mem
namespace: default
spec:
check_hooks: null
command: check-memory-usage -w 75 -c 90
env_vars: null
handlers: []
high_flap_threshold: 0
interval: 300
low_flap_threshold: 0
output_metric_format: ""
output_metric_handlers: null
pipelines: []
proxy_entity_name: ""
publish: true
round_robin: false
runtime_assets:
- check-memory-usage
secrets: null
stdin: false
subdue: null
subscriptions:
- linux
timeout: 0
ttl: 0
Verify Sensu Remote Host Metrics Monitoring
The agent remote metrics should now be available on the Sensu backend.
Verify on command line;
sensuctl event list Entity Check Output Status Silenced Timestamp UUID
─────────── ──────────── ──────────────────────────────────────────────────────────────────────────────────────────────────────────────────────────────────────────────────────────────────────────────────────────────────────────── ──────── ────────── ─────────────────────────────── ───────────────────────────────────────
debian11 check_cpu check-cpu-usage OK: 22.16% CPU usage | cpu_idle=77.84, cpu_system=0.00, cpu_user=0.00, cpu_nice=0.00, cpu_iowait=22.16, cpu_irq=0.00, cpu_softirq=0.00, cpu_steal=0.00, cpu_guest=0.00, cpu_guestnice=0.00 0 false 2022-05-07 11:55:43 +0000 UTC a5a590c3-779e-4ced-8d94-2c0fb3be3d5e
debian11 check_disk check-disk-usage OK: / 11.89% - Total: 16 GB, Used: 1.8 GB, Free: 13 GB 0 false 2022-05-07 11:53:55 +0000 UTC b693cd32-0676-4c99-9a9a-1bd5a298a560
debian11 check_mem check-memory-usage OK: 11.20% memory usage | mem_total=1023901696, mem_available=767492096, mem_used=114630656, mem_free=523784192 0 false 2022-05-07 11:54:06 +0000 UTC 911bc150-cd06-4f15-b6ab-f5e43a3140d9
debian11 check_swap check-swap-usage OK: 0.00% swap usage | swap_total=1022357504, swap_free=1022357504, swap_used=0 0 false 2022-05-07 11:55:06 +0000 UTC 3319f7d9-3c9f-4d49-8703-59a418f2c91c
debian11 keepalive Keepalive last sent from debian11 at 2022-05-07 11:55:43 +0000 UTC 0 false 2022-05-07 11:55:44 +0000 UTC 7c0ce9a5-85e7-4504-a7f3-e9f77cc5cd09
rocky8 check_cpu check-cpu-usage OK: 1.27% CPU usage | cpu_idle=98.73, cpu_system=0.25, cpu_user=0.00, cpu_nice=0.00, cpu_iowait=0.00, cpu_irq=1.02, cpu_softirq=0.00, cpu_steal=0.00, cpu_guest=0.00, cpu_guestnice=0.00 0 false 2022-05-07 11:55:43 +0000 UTC faf0e324-2721-42e7-8c65-e344ef5b3401
rocky8 check_disk check-disk-usage OK: / 42.33% - Total: 18 GB, Used: 7.7 GB, Free: 10 GB 0 false 2022-05-07 11:53:55 +0000 UTC a6e74c49-9694-4c74-a63b-ab7d1b1694f5
check-disk-usage OK: /boot 33.89% - Total: 1.1 GB, Used: 360 MB, Free: 703 MB
rocky8 check_mem check-memory-usage OK: 61.59% memory usage | mem_total=1905209344, mem_available=567705600, mem_used=1173352448, mem_free=122142720 0 false 2022-05-07 11:54:06 +0000 UTC ca52cfe3-1c02-45e2-aeb7-69bc5089d7f0
rocky8 check_swap check-swap-usage OK: 14.89% swap usage | swap_total=2147479552, swap_free=1827684352, swap_used=319795200 0 false 2022-05-07 11:55:06 +0000 UTC b7c1a0a0-9b71-4405-b8a3-df7af22d1f74
rocky8 keepalive Keepalive last sent from rocky8 at 2022-05-07 11:55:53 +0000 UTC 0 false 2022-05-07 11:55:53 +0000 UTC 78327f99-e4c5-4180-a8c8-2177feff1edc
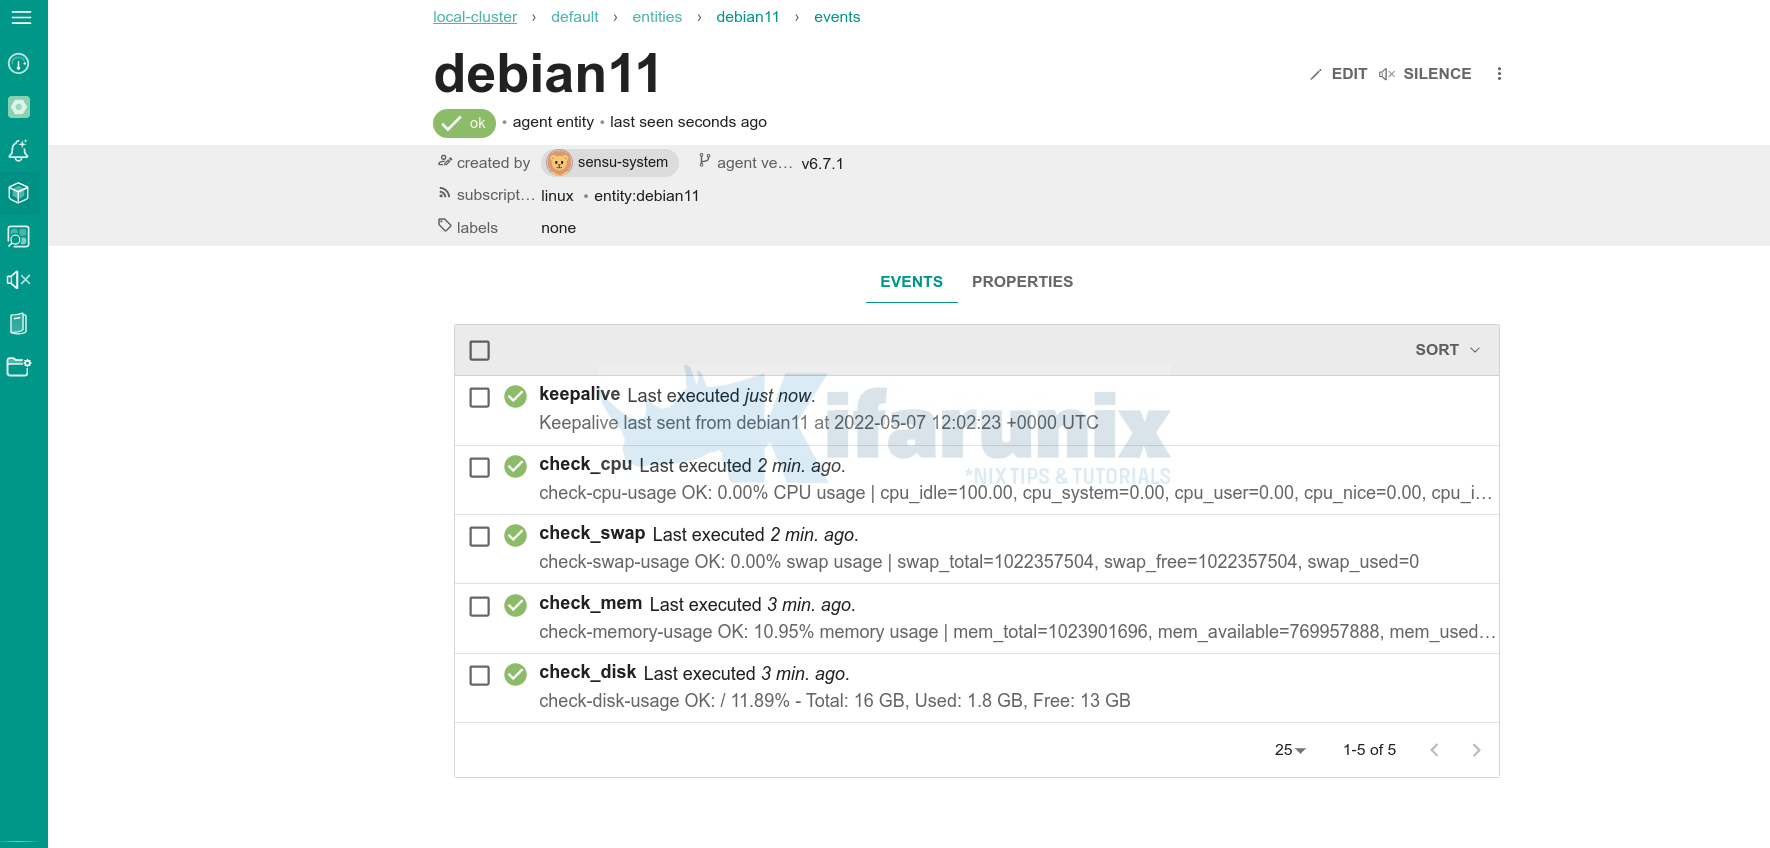
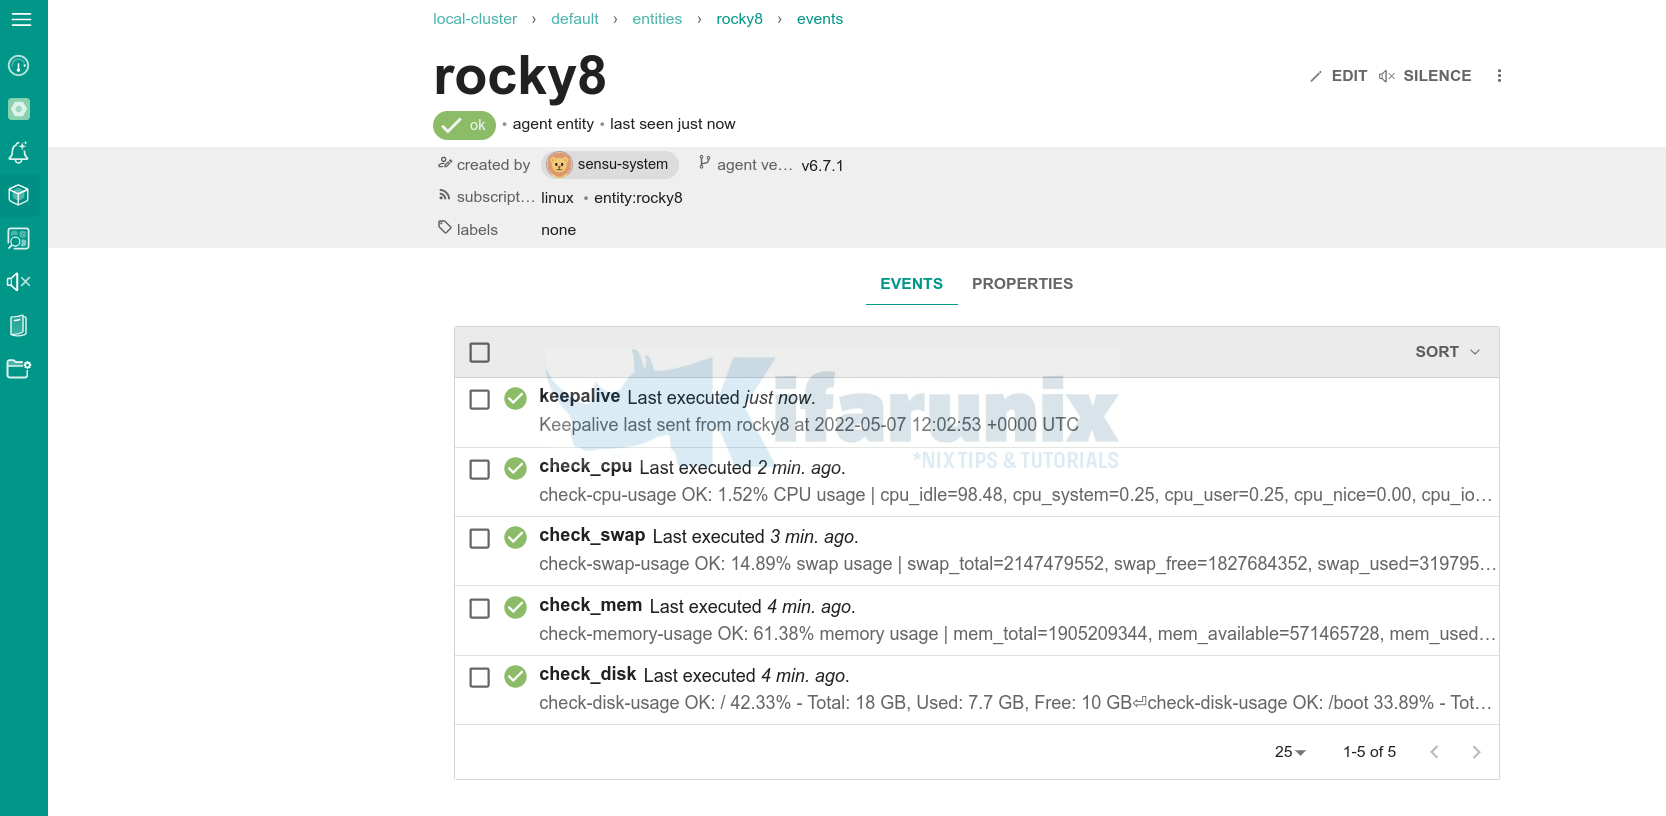
From the Sensu Go dashboard, navigate to entities dashboard.
For each asset entity, you should be able to check metric statistics;


And that is just it on how Linux system metrics can be monitored using Sensu Go.
Read more on Sensu documentation page.
Other related tutorials
Monitor Process Creation Events on Windows Systems using Wazuh and ELK stack

