In this tutorial, you will learn how to configure Prometheus Email alerting with AlertManager. AlertManager is used to handle alerts sent by client applications such as the Prometheus server. It takes care of deduplicating, grouping, and routing them to the correct receiver integration such as email, PagerDuty, or OpsGenie. It also takes care of silencing and inhibition of alerts.
There is more to Prometheus! Check the link below;
Prometheus: Up & Running: Infrastructure and Application Performance Monitoring
Configuring Prometheus Email Alerting with AlertManager
In our previous guide, we learnt how to monitor SSL/TLS certificate expiry using Prometheus and Grafana.
We integrated Telegraf with Prometheus for SSL/TLS certificate.

From the above screenshot, you can see that you have 2591897 seconds, which is equivalent to ~30 days (a month) before the certificate expires.
With that duration of time, one might end up forgetting that SSL/TLS certificates expires and hence may forget to renew the certificate. That is why it is important to configure Prometheus Email alerting such that, when a few days are due for certificate renewal, you can be notified via email.
So, assuming that you already have Prometheus up and running, how can you use AlertMnager to configure Prometheus Email alerting?
Therefore, open Prometheus configuration file and set alertmanager configurations, the Promtheus alert rules files as shown below;
vim /etc/prometheus/prometheus.ymlUpdate the lines below accordingly;
# Alertmanager configuration
alerting:
  alertmanagers:
  - static_configs:
    - targets:
       - localhost:9093

# Load rules once and periodically evaluate them according to the global 'evaluation_interval'.
rule_files:
   - "alert_rules.yml"
Without comment lines, this is how our Prometheus configuration file looks like;
global:
  scrape_interval:     15s # Set the scrape interval to every 15 seconds. Default is every 1 minute.
  evaluation_interval: 15s # Evaluate rules every 15 seconds. The default is every 1 minute.
alerting:
  alertmanagers:
  - static_configs:
    - targets:
       - localhost:9093
rule_files:
   - "alert_rules.yml"
scrape_configs:
  - job_name: 'prometheus'
    static_configs:
    - targets: ['localhost:9090']
  - job_name: 'SSL/TLS Certs'
    static_configs:
    - targets: ['192.168.59.12:9273']
Save and exit the configuration file.
Create Prometheus Alert Rules
“Alerting rules allow you to define alert conditions based on Prometheus expression language expressions and to send notifications about firing alerts to an external service. Whenever the alert expression results in one or more vector elements at a given point in time, the alert counts as active for these elements’ label sets“.
In our configuration file, we defined the Prometheus rules file as alert_rules.yml. This file should reside within the Prometheus configurations directory, /etc/prometheus.
Hence, create the rules file with the content similar to below;
vim /etc/prometheus/alert_rules.ymlNote that in this example, we will be creating rule to alert us when the SSL/TLS certificate is due to expire in a few days.
As shown above, we have a certificate that is due for renewal in the next 30 days. To make this demo easy, we will create a rule to alert when have 30 or less days to certificate renewal.
groups:
- name: alert_rules
  rules:
  - alert: SSL_TLS_Cert_Expiry
    expr: x509_cert_expiry{job="SSL/TLS Certs"} <= 2592000
    for: 1m
    labels:
      severity: critical
    annotations:
      summary: SSL/TLS Certificate Expiry
Various setting values have been explained here.
Save and exit the file.
Check if the rule files are valid or not;
promtool check rules /etc/prometheus/alert_rules.ymlChecking /etc/prometheus/alert_rules.yml
SUCCESS: 1 rules foundIf you check on Prometheus web interface Rules page;

Install and Configure AlertManager
Install AlertManager
AlertManager can be installed using pre-compiled binaries that can be downloaded from Prometheus downloads section.
Hence, before you can install AlertManager;
Create AlertManager system user and group as shown below;
useradd -M -r -s /bin/false alertmanagerNext, navigate to the downloads section and grab the latest version of AlertManager. You simply use wget to download it. The current release version as of this writing is 0.21.0.
VER=0.21.0wget https://github.com/prometheus/alertmanager/releases/download/v$VER/alertmanager-$VER.linux-amd64.tar.gzExtract the downloaded binary;
tar xzf alertmanager-0.21.0.linux-amd64.tar.gzCopy the AlertManager binary files, alertmanager and amtool to binary directory like /usr/local/bin/.
cp alertmanager-0.21.0.linux-amd64/{alertmanager,amtool} /usr/local/bin/Next, create a configuration directory for AlertManager and copy the YAML configuration to that directory;
cp alertmanager-0.21.0.linux-amd64/alertmanager.yml /etc/alertmanager/Set the ownership of the AlertManager configuration directory and the binaries to alertmanager user created above;
chown alertmanager: /etc/alertmanager/alertmanager.yml /usr/local/bin/{alertmanager,amtool}Configure AlertManager
In this setup, we will be sending the alerts via Email and we will use Gmail relay in that case.
Hence, configure AlertManager as follows;
vim /etc/alertmanager/alertmanager.ymlglobal:
resolve_timeout: 5m
route:
group_by: ['alertname']
group_wait: 10s
group_interval: 10s
repeat_interval: 24h
receiver: 'email'
receivers:
- name: 'email'
email_configs:
- to: '[email protected]'
from: '[email protected]'
smarthost: smtp.gmail.com:587
auth_username: '[email protected]'
auth_identity: '[email protected]'
auth_password: 'password'Save and exit the configuration file. Be sure to set the email settings appropriately.
More about the config on configuration page and git repo page.
Check the Alertmanager configuration file to validate it.
amtool check-config /etc/alertmanager/alertmanager.ymlChecking '/etc/alertmanager/alertmanager.yml' SUCCESS
Found:
- global config
- route
- 0 inhibit rules
- 1 receivers
- 0 templatesRunning AlertManager
You can run Alertmanager in standalone mode by executing the command below;
alertmanager --config.file /etc/alertmanager/alertmanager.ymlRemember, we set Prometheus to connect to Alertmanager via localhost:9093, hence replace the x.x.x.x with the correct address.
To run AlertManager as a service;
cat > /etc/systemd/system/alertmanager.service << 'EOL'
[Unit]
Description=AlertManager Server Service
Wants=network-online.target
After=network-online.target

[Service]
User=root
Group=root
Type=simple
ExecStart=/usr/local/bin/alertmanager --config.file /etc/alertmanager/alertmanager.yml

[Install]
WantedBy=multi-user.target
EOL
For other options, consult /usr/local/bin/alertmanager --help.
Reload systemd configurations and start Alertmanager;
systemctl daemon-reloadsystemctl enable --now alertmanagerCheck the status;
systemctl status alertmanager● alertmanager.service - AlertManager Server Service
Loaded: loaded (/etc/systemd/system/alertmanager.service; enabled; vendor preset: enabled)
Active: active (running) since Sat 2021-04-10 23:16:25 EAT; 1s ago
Main PID: 3959 (alertmanager)
Tasks: 8 (limit: 2359)
Memory: 13.5M
CGroup: /system.slice/alertmanager.service
└─3959 /usr/local/bin/alertmanager --config.file /etc/alertmanager/alertmanager.yml --web.external-url=http://localhost:9093
Apr 10 23:16:25 debian systemd[1]: Started AlertManager Server Service.
...
...
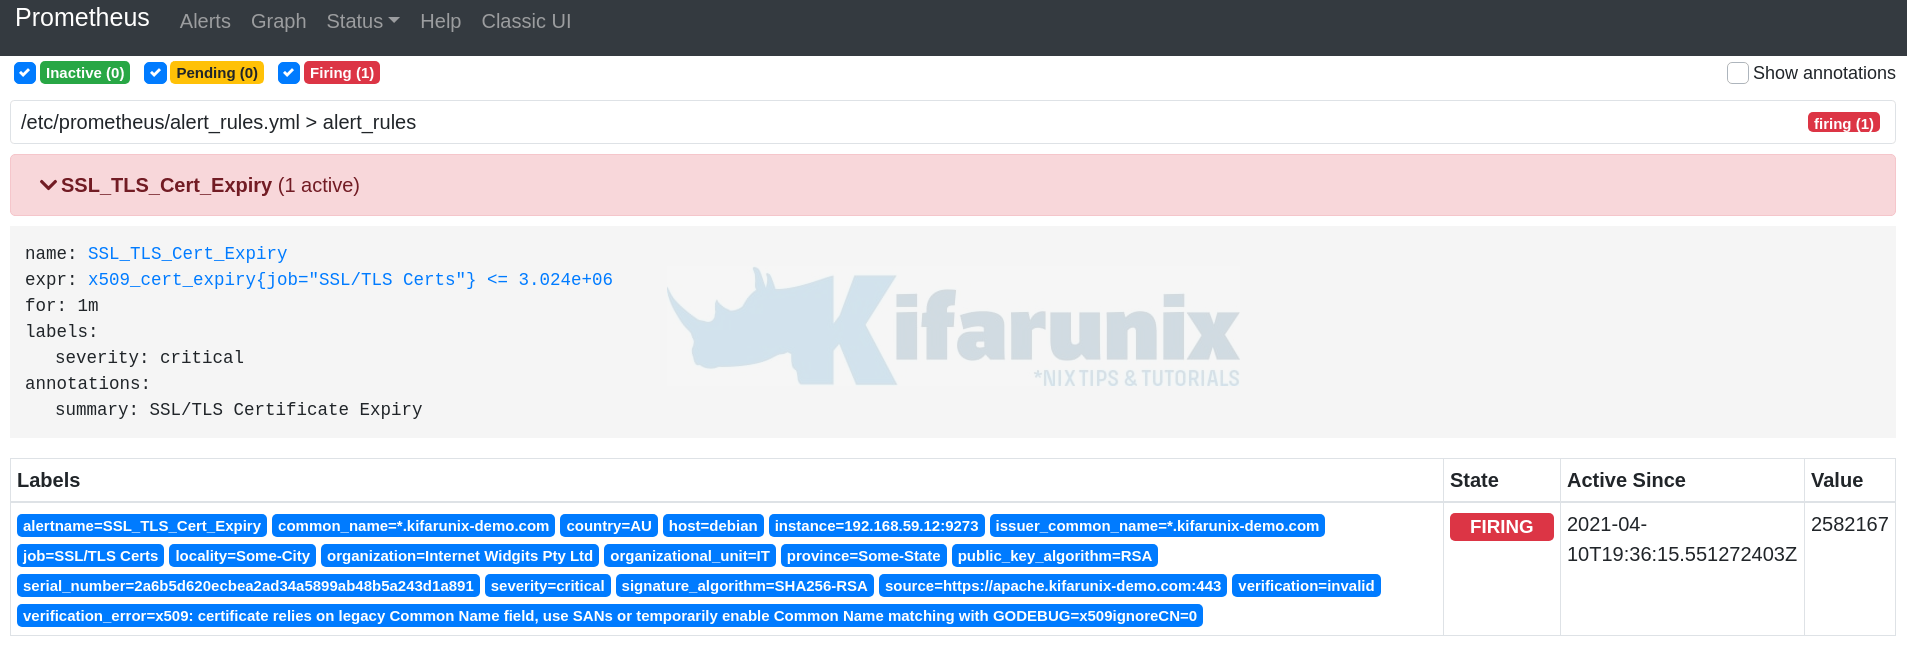
Apr 10 23:16:25 debian alertmanager[3959]: level=info ts=2021-04-10T20:16:25.745Z caller=main.go:485 msg=Listening address=:9093Check Prometheus Alerts page;

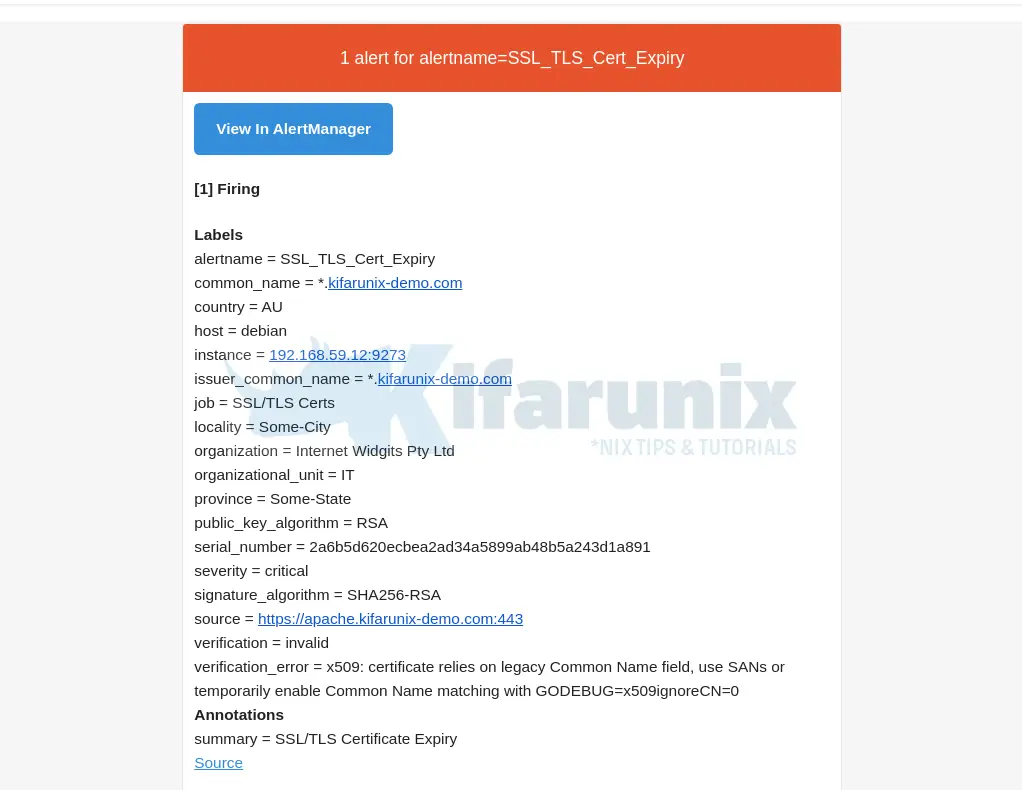
Also check your mail;

You can further customize the email template.
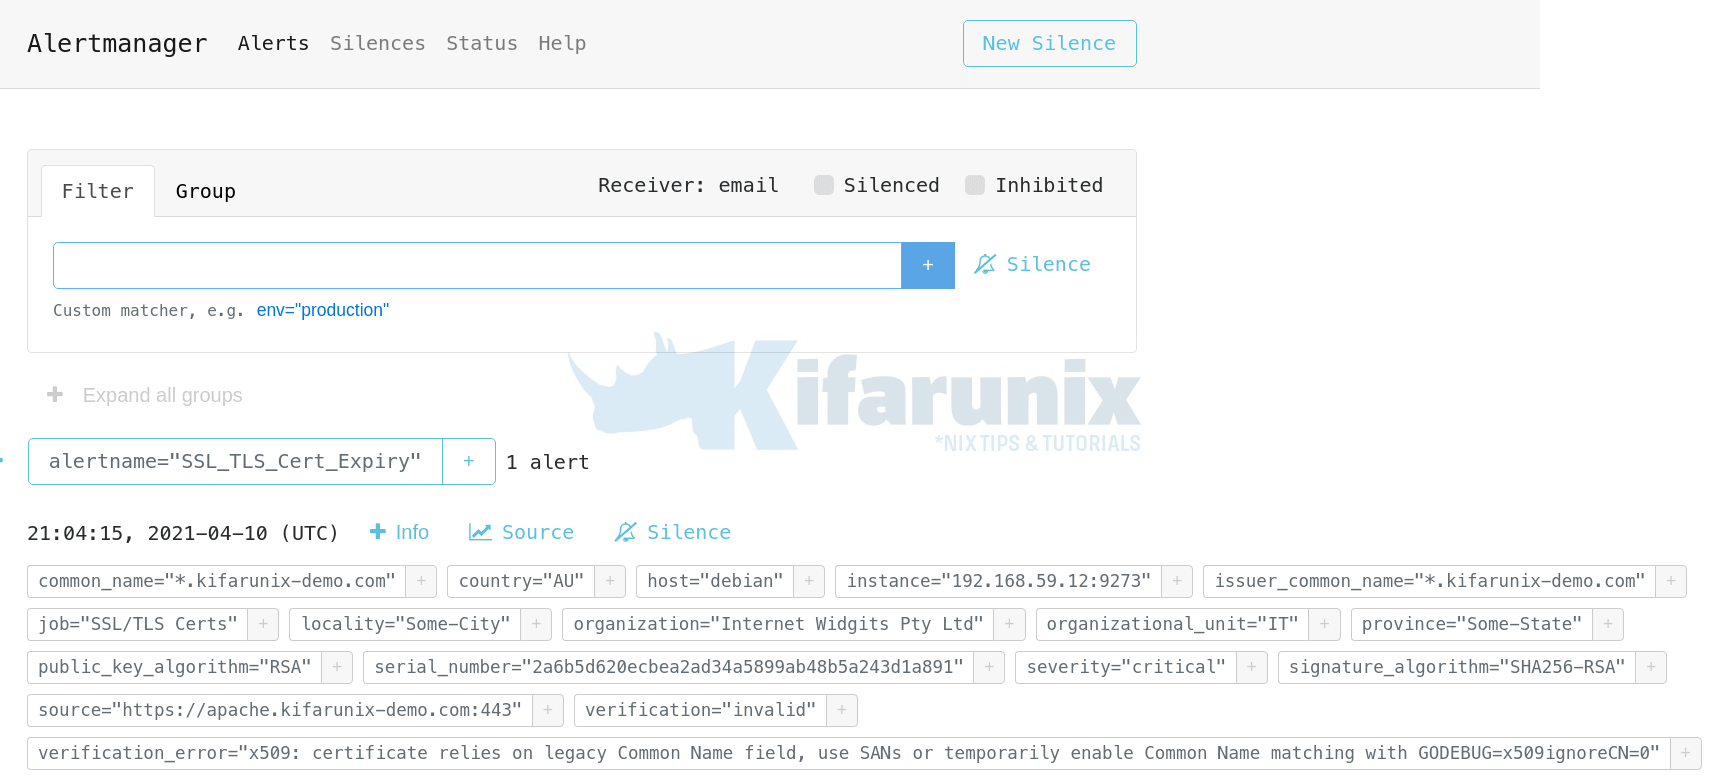
You can also view alerts in Alertmanager, http://x.x.x.x:9093/alerts;

Further Reading
Other Tutorials
Monitor SSL/TLS Certificates Expiry with Nagios
Monitor Linux System Metrics with Prometheus Node Exporter
Monitoring Gitlab Metrics with Prometheus and Grafana


Hello,
thanks for this tutorial.
I have setup Prometheus + AlertManager successfully.
However I failed to configure AlterManager to send notification via Email to different receivers, means I have e.g. 2 different alerts and I want to send it to different receives.
Can you please advise how to configure this?
THX
Hi Thomas, try to add recipients as suggested here. Haven’t tried this though!
Otherwise create a group mail/alias
Hi gen_too. You mentioned “You can further customize the email template.” Do you know how exactly? I’m using prometheus-community helm chart.