In this guide, we are going to learn how to monitor squid logs with Grafana and Graylog. You can check our other guides on installing Graylog, forwarding squid logs to Graylog and creating Graylog squid log field extractors by following the links below;
Install Graylog 3.0 on CentOS 7
Monitor Squid Access Logs with Graylog Server
Create Squid Logs Extractors on Graylog Server
Monitor Squid logs with Grafana and Graylog
Grafana is an opensource tool for visualizing data collected from different types of data stores such as Prometheus, InfluxDB, Elasticsearch, Graphite, MySQL and several other databases. In this case of integrating it with Graylog, we will use Elasticsearch as our Grafana datasource.
To learn how to install Grafana on Ubuntu, Debian or Fedora, see the links below;
- Install Grafana Monitoring Tool on Fedora 29
- Install Grafana Metrics Monitoring Tool on Debian 9
- Install Grafana Data Visualization Tool on Ubuntu 18.04
Configure Elasticsearch Remote Connection
Elasticsearch is listening on localhost by default in Graylog server. To configure it to allow remote connection, you need define an interface IP for the network.host parameter.
vim /etc/elasticsearch/elasticsearch.yml...
network.host: GRAYLOG_SERVER_IP
...If firewall is running, open the Elasticsearch ports
firewall-cmd --add-port=9200/tcp --permanent
firewall-cmd --reload
ufw allow from Graylog_IP to any port 9200 proto tcpRestart Elasticsearch
systemctl restart elasticsearchVerify Elasticsearch Connection
Login to Grafana and run the command below to verify connection to Elasticsearch by running the command below;
curl http://Graylog_IP_)R_HOSTNAME:9200
{
  "name" : "x55YNL_",
  "cluster_name" : "graylog",
  "cluster_uuid" : "CQBqPDoCRKW7tt955kq5Uw",
  "version" : {
    "number" : "6.8.0",
    "build_flavor" : "default",
    "build_type" : "rpm",
    "build_hash" : "65b6179",
    "build_date" : "2019-05-15T20:06:13.172855Z",
    "build_snapshot" : false,
    "lucene_version" : "7.7.0",
    "minimum_wire_compatibility_version" : "5.6.0",
    "minimum_index_compatibility_version" : "5.0.0"
  },
  "tagline" : "You Know, for Search"
}
Create Graylog Squid Logs Elasticsearch Index Set
Graylog uses one or more sets of Elasticsearch indices to optimize search and analysis operations for speed and low resource consumption.
To create an index, navigate to System > Indices. Hit Create index set. On the index configuration page, set the name of the index, description, a unique prefix for use in Elasticsearch, number of Elasticsearch shards, index rotation strategy.
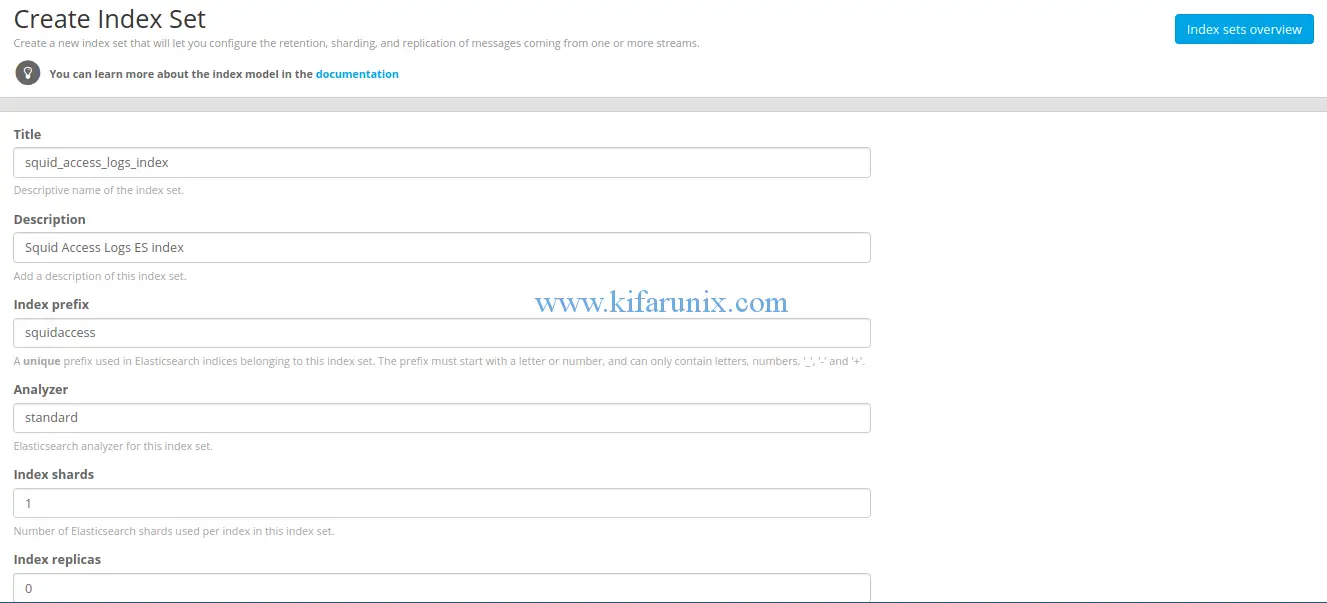
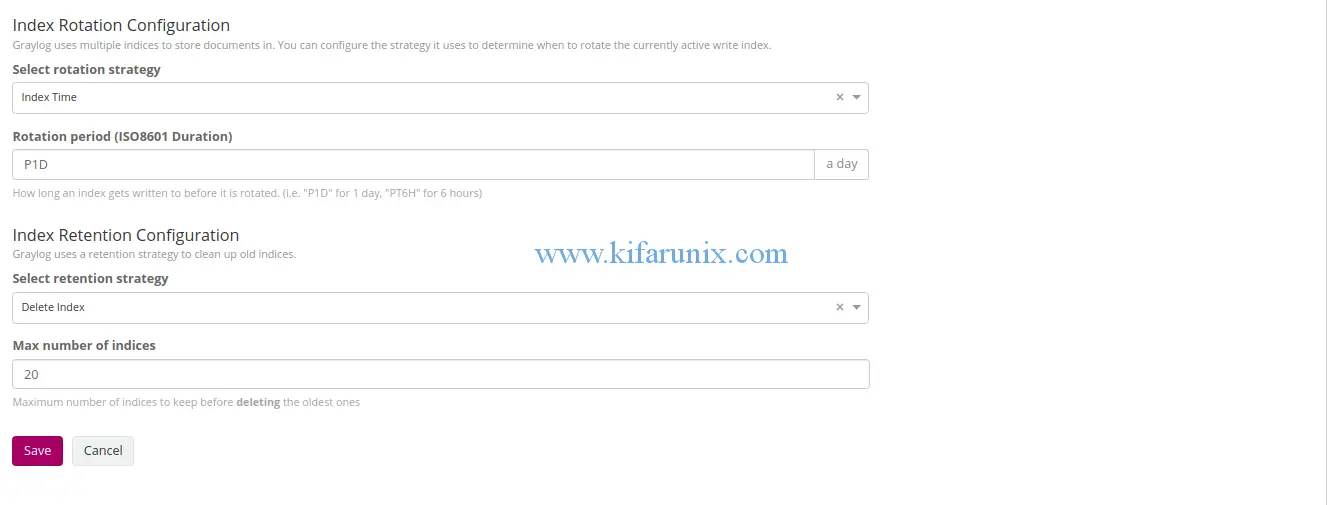
Once you are done, click save to save the index.
To verify the index name for your Elasticsearch datasource;
curl -XGET graylog.example.com:9200/_cat/indices?v
health status index         uuid                   pri rep docs.count docs.deleted store.size pri.store.size
green  open   squidaccess_0 EiMgXL2UQqWym-5VZ-atDg   1   0       8859            0      1.9mb          1.9mb
Our index in this case is squidaccess_0. Note that using the Graylog Elasticsearch indices may bring issues due to constant rotation. We will look at the possible work around in our next guide.
Add Grafana Datasource
If connection to Elasticsearch from Grafana server is okay, proceed to create Grafana Elasticsearch datasource. To add Grafana datasource, navigate to Configuration > Data Sources.

Click Add data source and choose Elasticsearch. Under the Elasticsearch datasource settings, set the name of the datasource, the URL of the Graylog Elasticsearch, Elasticsearch index prefix as defined in Graylog index above, time field name (timestamp).
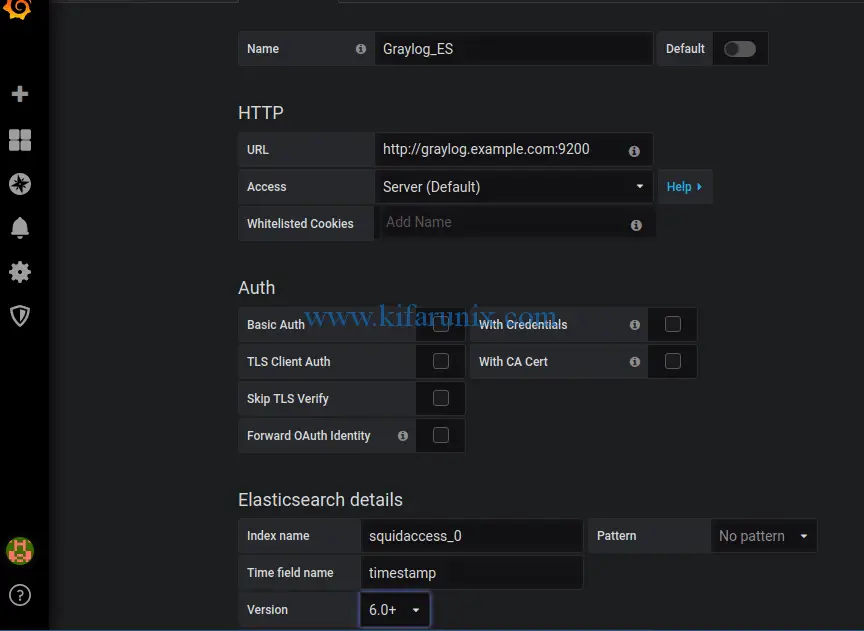
Next, click Save & Test to test the connection to Elasticsearch datasource. If everything is fine, then you should get Index Ok.

Create Grafana Dashboard for Squid Logs
Once you have you Graylog Elasticsearch datasource added to Grafana, you need to create the dashboards for visualizing the data. This involves creating various queries for different dashboards you may want to have. You can also import a ready made dashboard.
To create a new or import Grafana dashboard, click on the HOME dropdown on the top left corner and choose whether to import dashboard json file or create a new one.
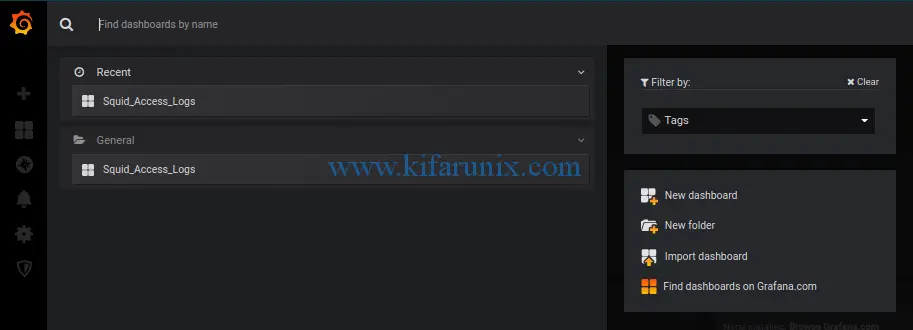
For example, based on my Graylog squid log extractor, this is a simple dashboard that we have created.
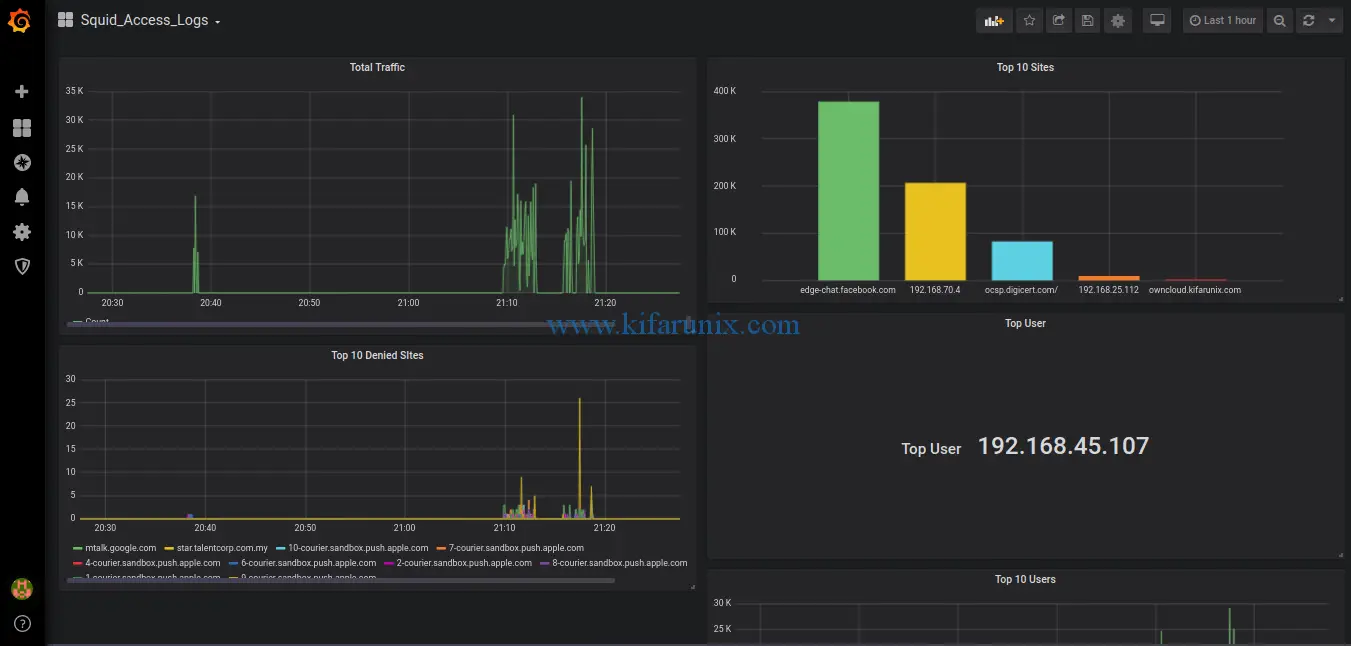
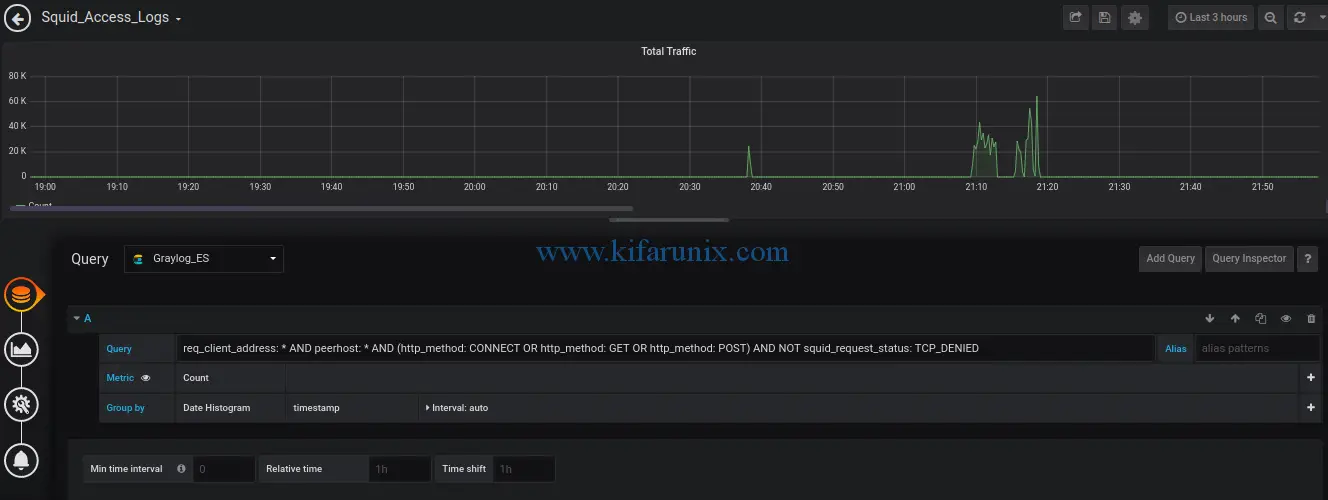
Below are the panels that makes up this dashboard.
Total Traffic:
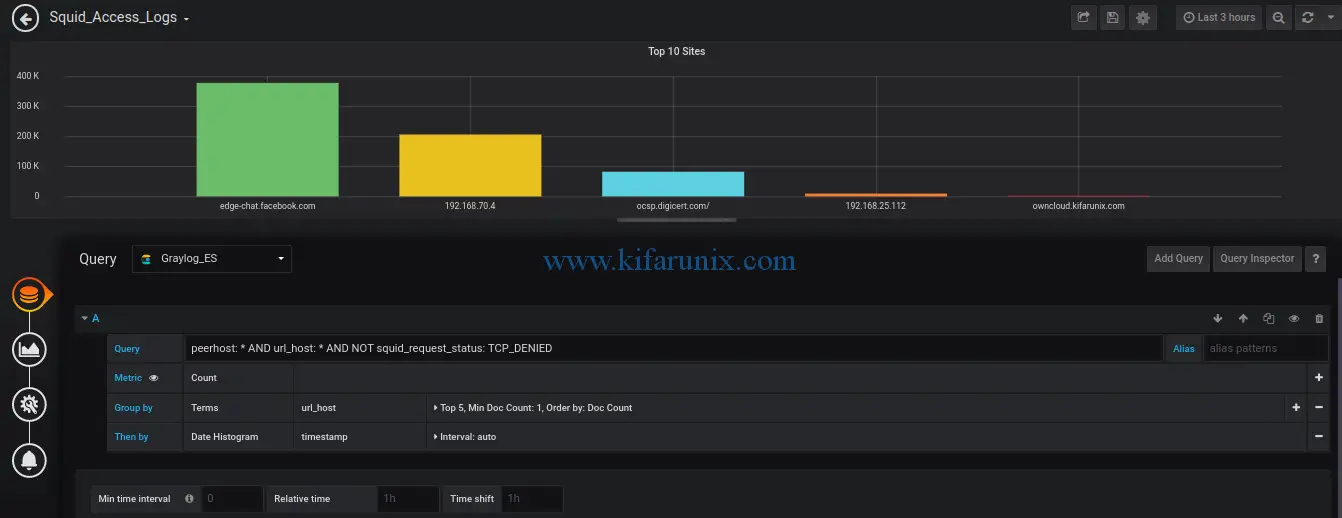
Top Sites:
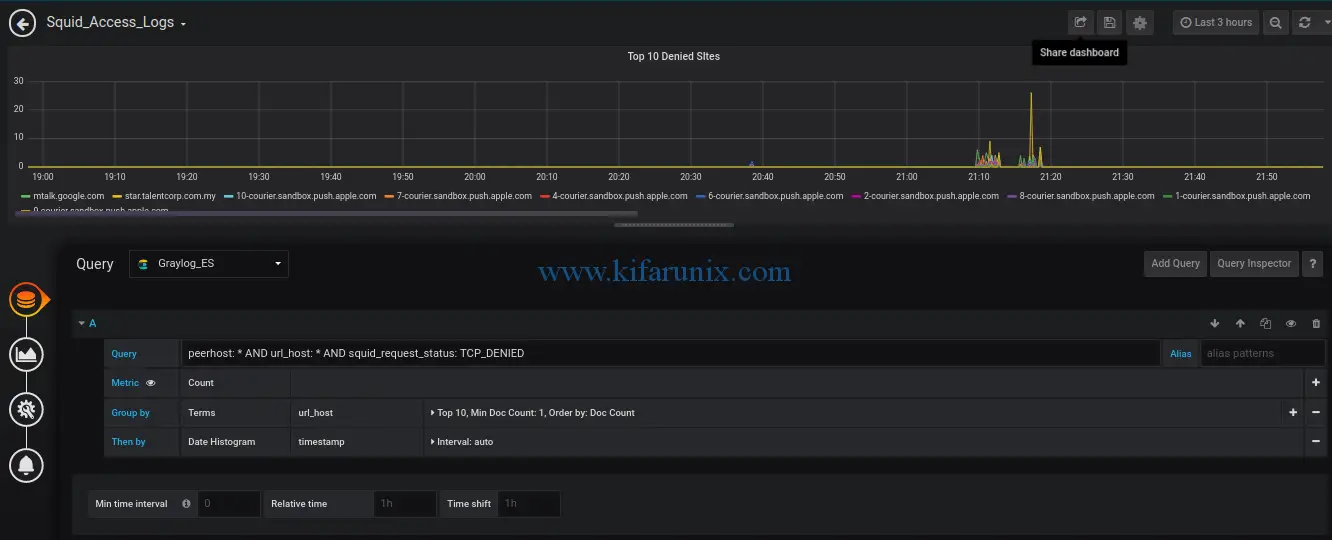
Top 10 Denied Sites:
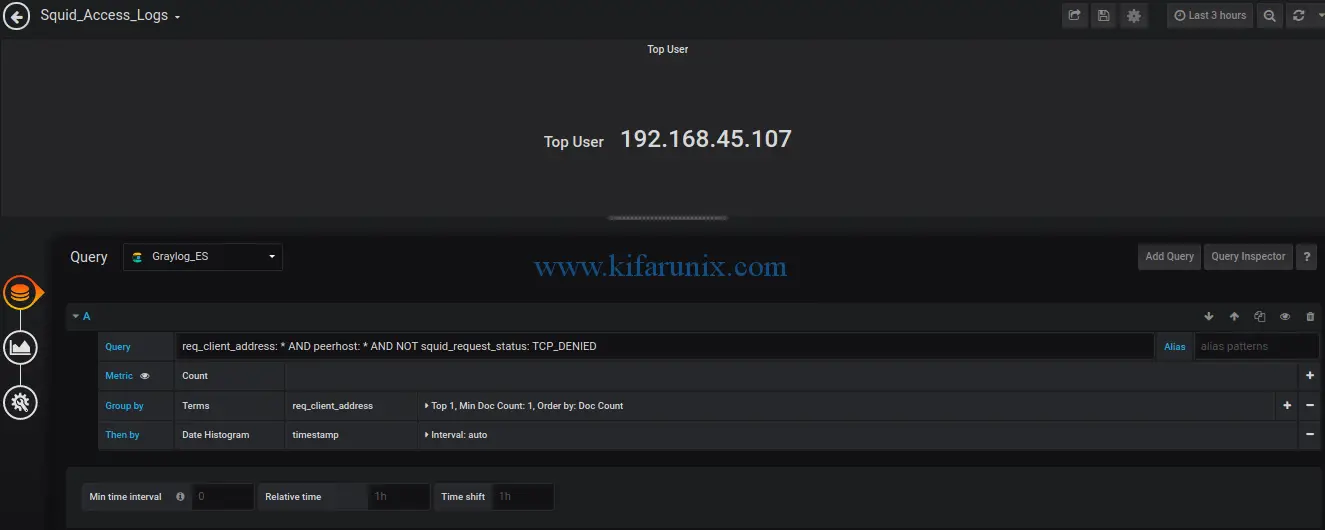
Top user:
That is just the basics on how to monitor squid logs with Grafana and Graylog. We hope this was informative enough. Feel free to drop your comments. Enjoy.


Hello,
I appreciate your handwork in providing knowledge..
Please also make tutorials to create dashboard that you have.
Thanks
Hi!
Thanks for articles! I have question:
how i can show in Grafana transfer size(in bytes) to megabytes?
I tryed like this but it not works:
client_ip: * AND HOSTNAME: * AND http_status_code: 200 AND transfer_size: (*/1024/1024)
Thanks!