How can I monitor Docker swarm node metrics? In this tutorial, you will learn how to monitor Docker swarm node metrics using Grafana. Prometheus node exporter can be used to collect hardware and OS metrics that are exposed by the kernel. Such metrics are scraped using Promethes, which acts as data source to Grafana which let’s you create visualization for all your Docker swarm node metrics for monitoring.
Monitoring Docker Swarm Node Metrics using Grafana
In this guide, we will use Grafana, Prometheus and Node Exporter to monitor Docker swarm node metrics.
We will run Grafana and Prometheus as swarm services, while Node exporter as separate docker containers on each swarm node.
Install Docker Engine
If you have not already installed Docker Engine, please refer to appropriate guides in the link below;
Setup Docker Swarm Cluster
Since we are dealing swarm services, you need to have setup swarm cluster that whose metrics need to be monitored.
If you haven’t, please refer to this guide to learn how to setup swarm cluster.
How to Setup Docker Swarm Cluster on Ubuntu
Create Docker Swarm Network to Interconnect Monitoring Tools
The monitoring tools should be in the same network for them to communicate with each other.
Since we are dealing with Docker swarm, then overlay networks can be used to provide communication between services.
If you need to configure Docker containers to use Docker swarm network, then you need to make the Docker swarm network you are creating to be attachable.
We have already created an overlay network called monitoring_stack.
You check available Docker networks using the command below;
docker network ls
NETWORK ID     NAME               DRIVER    SCOPE
816c7f48bbb3   bridge             bridge    local
841640b7368f   docker_gwbridge    bridge    local
45c3672051a1   host               host      local
sxnbs83rwn5f   ingress            overlay   swarm
e5mklugaqapm   monitoring_stack   overlay   swarm
05990914584e   none               null      local
You can use this command to create the network, replacing monitoring_stack with your preferred network name.
docker network create --driver overlay --attachable monitoring_stackDeploy Node Exporter Docker Container
On each Docker Swarm cluster node, deploy the Prometheus Node Exporter to collect individual node metrics;
We have three nodes in our swarm cluster;
docker node ls
ID                            HOSTNAME   STATUS    AVAILABILITY   MANAGER STATUS   ENGINE VERSION
him49eblt74amba1nghv2f8z1 *   swarm01    Ready     Active         Leader           20.10.22
4lxyd0f6d9h039y5itjiffqax     swarm02    Ready     Active         Reachable        20.10.12
dfmdl4wy4e7ouklu8mu7nqqh9     swarm03    Ready     Active         Reachable        20.10.22
You can simply run the command below to deploy Node Exporter and attach it to our custom Docker network above;
To deploy Node Exporter Docker container on our Swarm Node01;
docker run -d \
  --name node-swarm01 \
  --restart unless-stopped \
  --network monitoring_stack \
  --volume /:/rootfs:ro \
  --volume /var/run:/var/run:rw \
  --volume /sys:/sys:ro \
  --volume /var/lib/docker/:/var/lib/docker:ro \
  gcr.io/cadvisor/cadvisor:v0.47.1
On the rest of the nodes, run the command, replacing the name of the node exporter on each node.
By default, Node Exporter exposes metrics on port 9100. This port will be reachable within container networks.
You can check the status of the Node exporter container by running the command below on each node;
docker psAlso possible to get logs;
docker logs -f node-exp-swarm01Deploy Prometheus Docker Swarm Service
Next, let’s deploy Prometheus as a Docker swarm service to scrape collected swarm node metrics from Node Exporter containers.
First of all, before you can deploy Prometheus swarm service, create a Prometheus configuration file.
In our setup, we placed the Prometheus configuration file under /opt/prometheus directory. While creating Prometheus swarm service, we will mount this configuration file to the default Prometheus configuration file, /etc/prometheus/prometheus.yml.
vim /opt/prometheus/prometheus.yml
global:
  scrape_interval: 5s
  evaluation_interval: 10s

scrape_configs:
  - job_name: 'cadvisor'
    metrics_path: '/metrics'
    static_configs:
      - targets: ['cadvisor-swarm01:8080','cadvisor-swarm02:8080','cadvisor-swarm03:8080']
  - job_name: 'node-exporter'
    metrics_path: '/metrics'
    static_configs:
      - targets: ['node-exp-swarm01:9100','node-exp-swarm02:9100','node-exp-swarm03:9100']
Prometheus will publish the metrics it scrapes from Node exporter and cAdvisor on port 9090.
Thus, let’s create Prometheus Docker container using the official Prometheus Docker image and configure it to use our custom network created above, monitoring_stack.
docker service create \
-p 9090:9090 \
--mode global \
--network monitoring_stack \
--mount type=bind,src=/opt/prometheus/prometheus.yml,dst=/etc/prometheus/prometheus.yml \
--name prometheus \
prom/prometheus
If Prometheus is already running as a swarm service then update it;
docker service update --force prometheusYour Prometheus container should now be running and exposed via port 9090/tcp.
docker service ls --format '{{.Name}}\t{{.Ports}}'
nagios-server	*:8081->80/tcp
prometheus	*:9090->9090/tcp
wordpress	*:8880->80/tcp
Similarly, ensure you allow port 9090/tcp on firewall to allow you access the metrics externally!
Verify Prometheus Targets/Metrics from Prometheus Dashboard
You can now navigate to http://docker-host-IP:9090/targets to see Prometheus targets,
docker-host-IP can be IP of any of the swarm node.
Targets;
Check Swarm Nodes Metrics on Prometheus
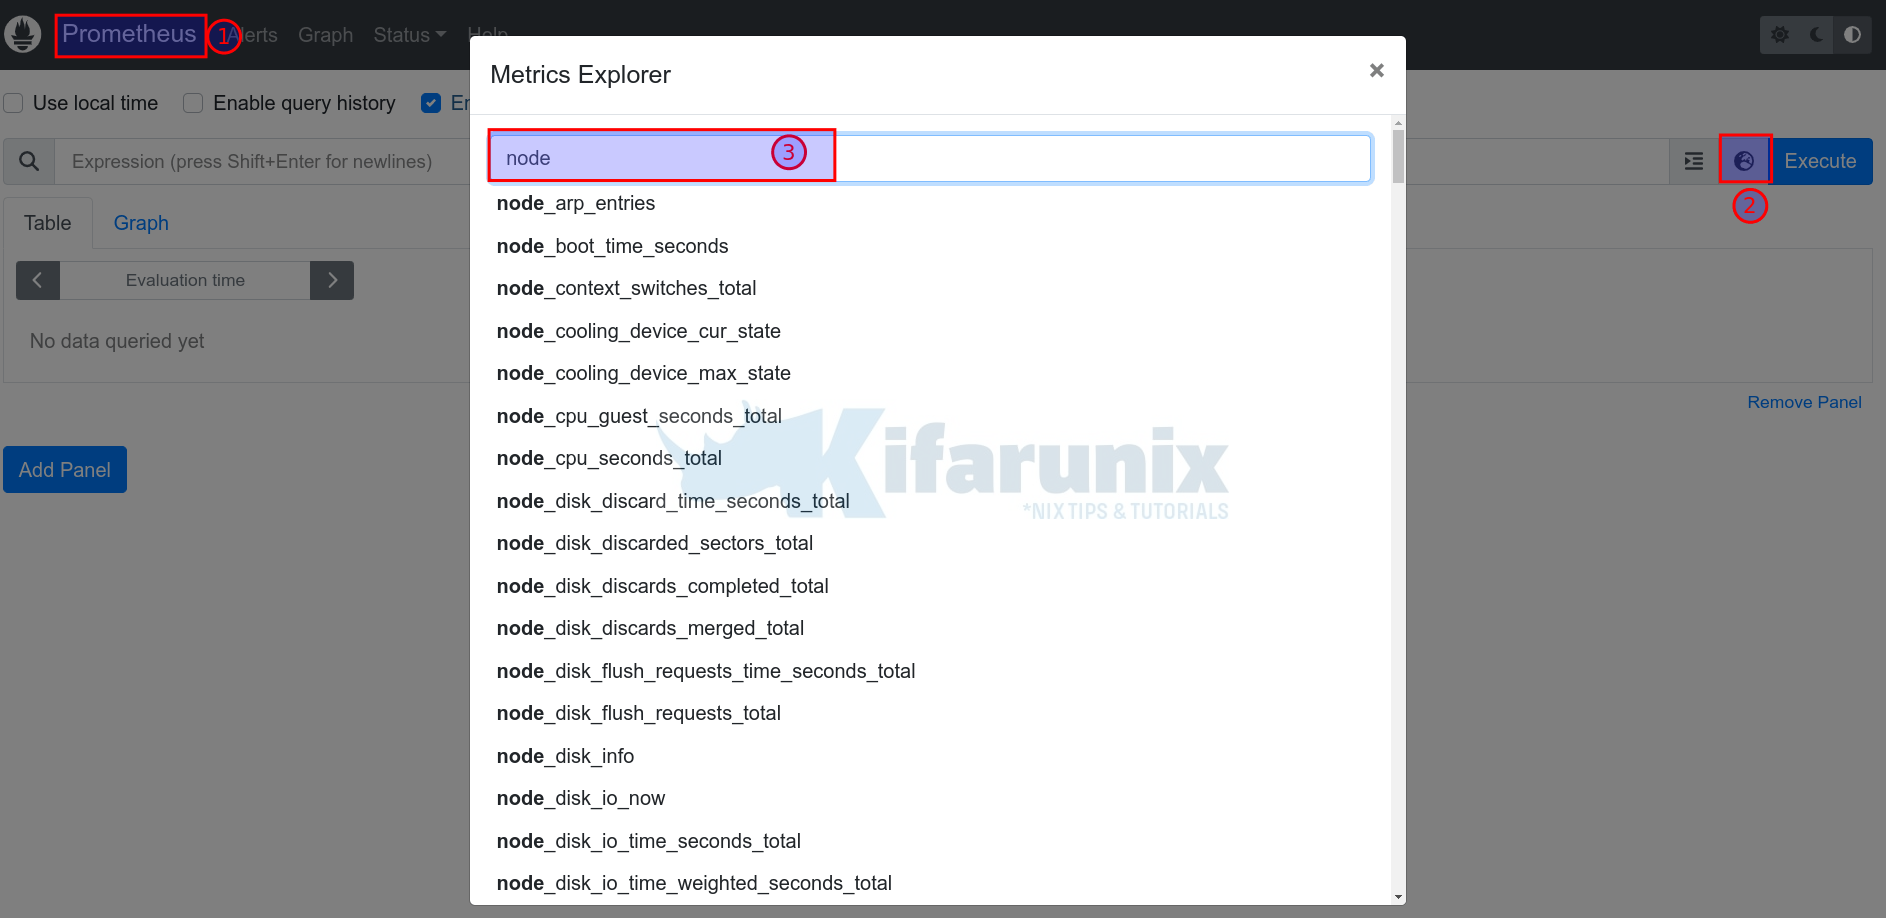
On the dashboard, click Prometheus, and open metrics explorer and just type container and you should see quite a number of metrics;
For example, you can get Swarm nodes uptime;
(node_time_seconds - node_boot_time_seconds)/3600Deploy Grafana Docker Swarm Service
You need Grafana Docker swarm service deployed on your cluster to visualize the swarm cluster metrics.
Create Grafana Data, Configuration and home directories volumes. Using a volume for Grafana data ensures that the dashboards, users, and other settings you create are persisted across container restarts. This is important if you want to keep your dashboards and other Grafana settings even if the container is updated or recreated.
for i in conf data home; do docker volume create grafana-$i; doneTo deploy Grafana Docker container using the official image, grafana/grafana-oss and attach it to the custom network created above.
docker service create \
  --name grafana \
  --network monitoring_stack \
  --mount type=volume,source=grafana-data,target=/var/lib/grafana \
  --mount type=volume,source=grafana-home,target=/usr/share/grafana \
  --mount type=volume,source=grafana-config,target=/etc/grafana \
  --publish published=3000,target=3000 \
  grafana/grafana
Grafana is now running as a single replica on all nodes.
If you run it as global or multi-replicated, you may not be able to login, getting Unauthorized, (user token not found issue in the logs!)
Open port 3000/tcp on firewall to allow external access to Grafana;
ufw allow 3000/tcpAccessing Grafana Web Interface
You can now access Grafana web interface http://docker-host-IP:3000.
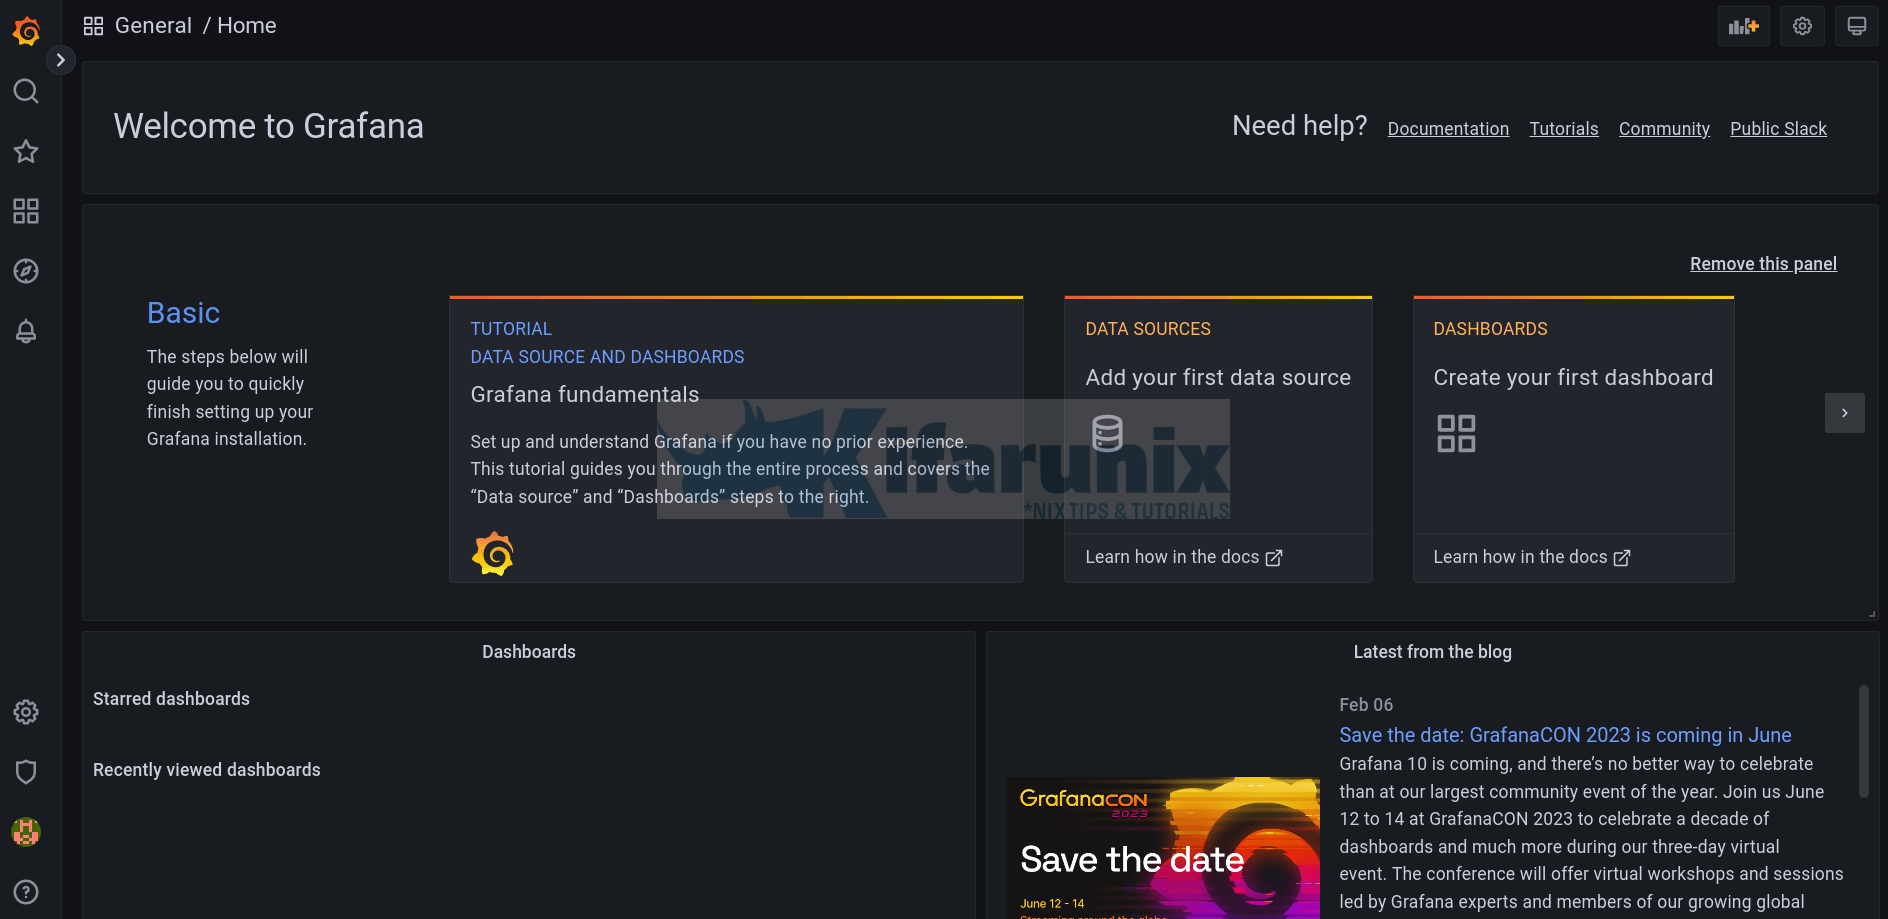
Default credentials are admin/admin. Reset the password and proceed to the Dashboard;
Integrate Prometheus with Grafana For Monitoring
You can now integrate Prometheus with Grafana by adding Prometheus data source to Grafana. Check the link below;
Integrate Prometheus with Grafana For Monitoring
Data sources, once you have added the Prometheus data source.
As you can see, we specified the name of the Prometheus container on the data source URL because both Grafana and Prometheus are on same network.
Create Docker Swarm Node Metrics Dashboards on Grafana
You can now create your own Grafana visualization dashboards for your Docker swarm cluster.
As a simple example, let’s create a simple visualization to check swarm nodes uptime
on the nodes, you would usually display system uptime using uptime command or w command.
e.g
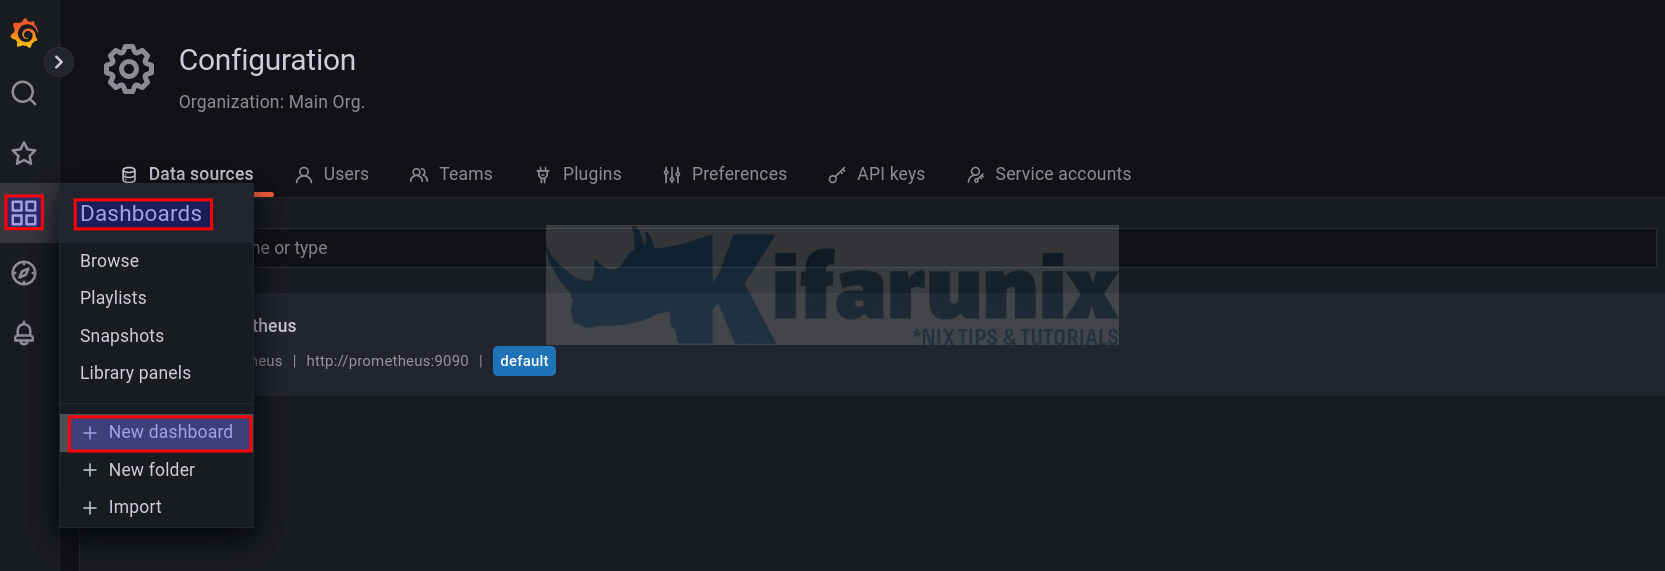
uptimeTo create a Grafana dashboard, navigate to dashboards menu > New dashboard.
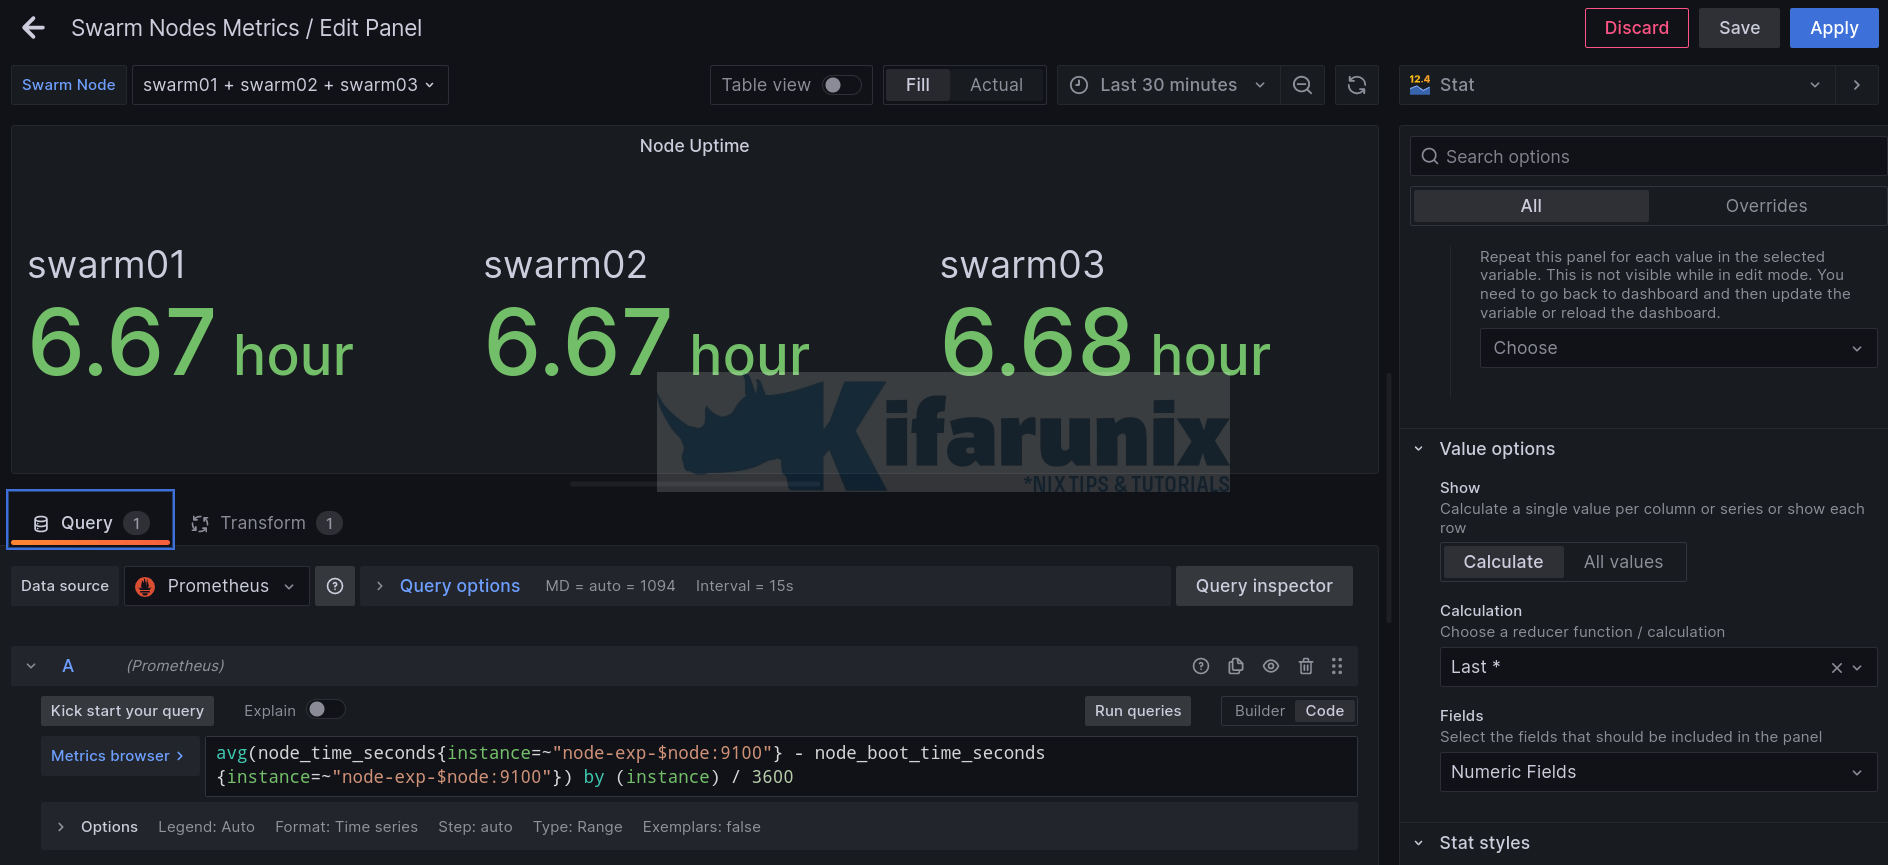
Add new panel, we are using Stats panel in this example.
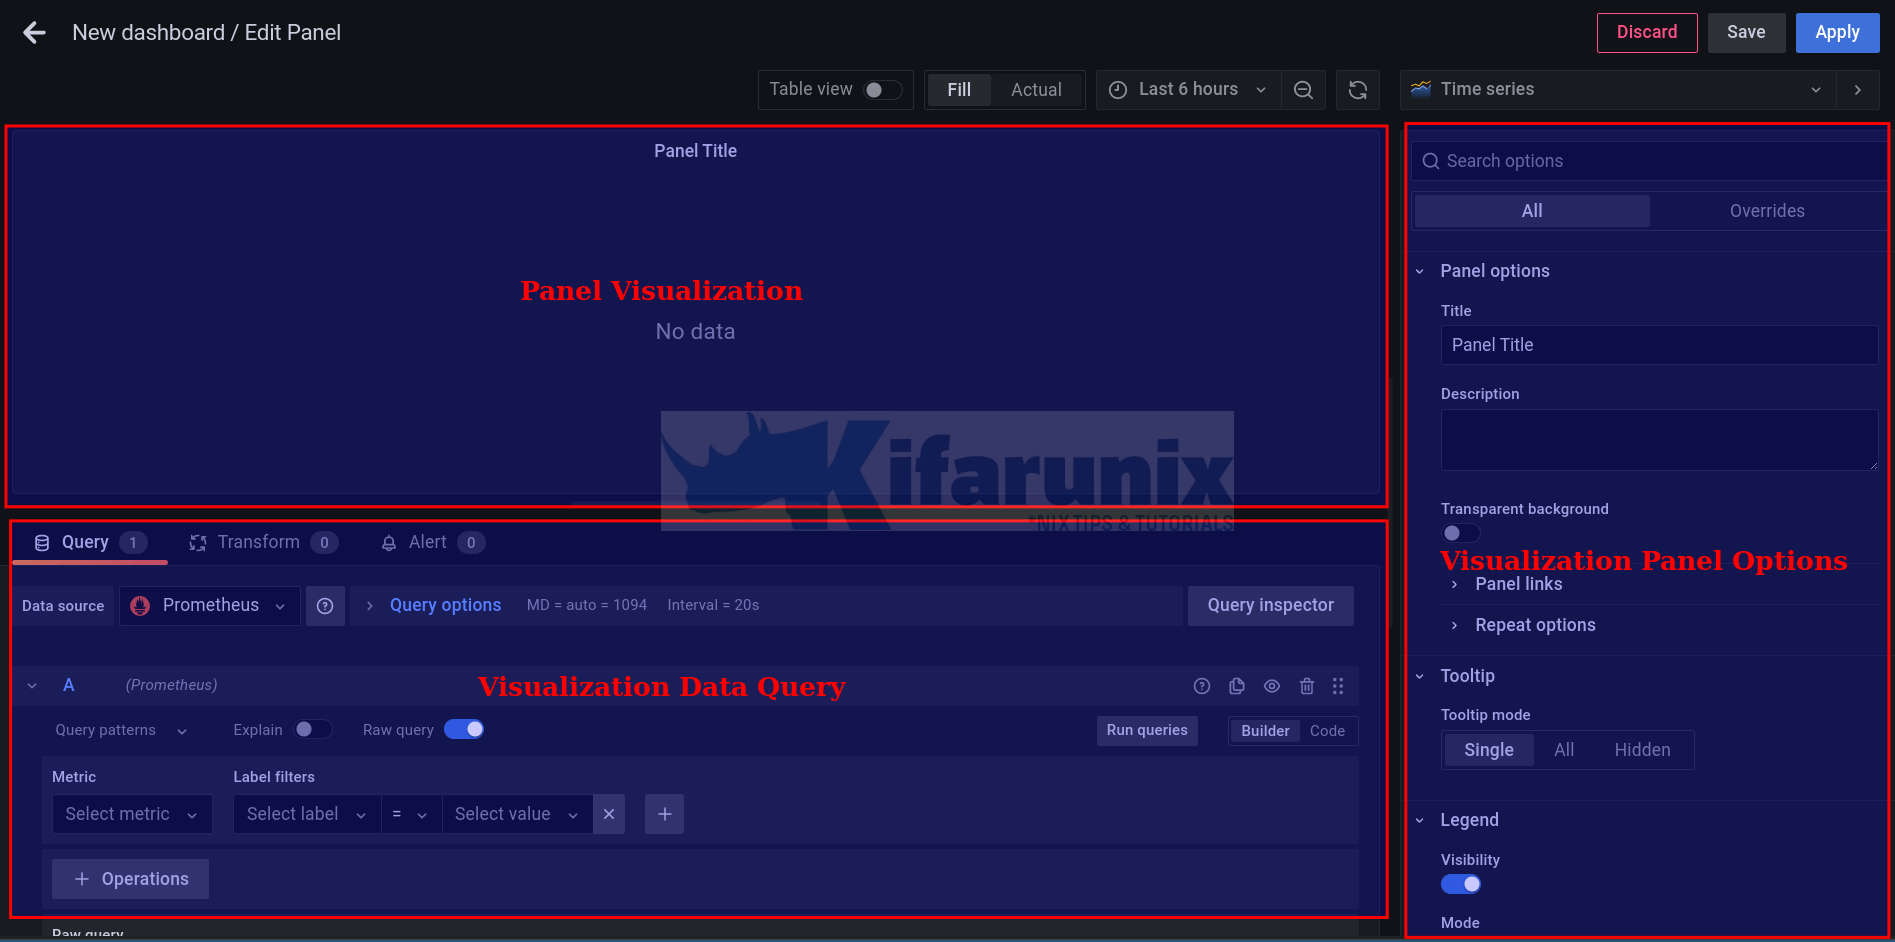
You have three sections on the dashboard panel;
So, to create a visualization of specific metric, you need a query to fetch those metrics from the datasource, which in this case is our Preom
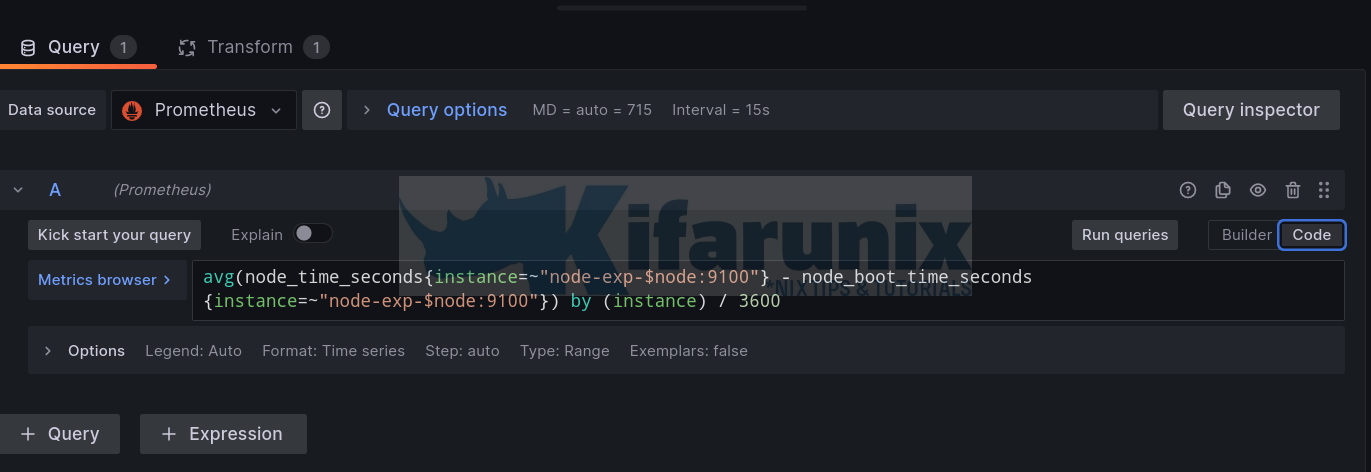
- So from the Query panel, select a datasource (Prometheus in this example).
- You can build your query using Builder which lets you select metrics and enter values (Builder) or simply switch to code which allows you to type the query manually.
- with Builder, you can simply select your metric query from Metric drop-down and define the filters under Label filters.
- with Code, you can just type your query under metrics browser;
avg(node_time_seconds{instance=~"node-exp-$node:9100"} - node_boot_time_seconds{instance=~"node-exp-$node:9100"}) by (instance) / 3600Noticed, the use $node variable? We created a variable to extract swarm node name from exporter.
Under the Panel options;
- change visualization type. We are using Stat in this example.
- Set the panel name e.g Node Uptime. You can leave other options with default values.
- Go through other panel settings and see what you can change!
When done, click Save/Apply to save the dashboard/visualization.
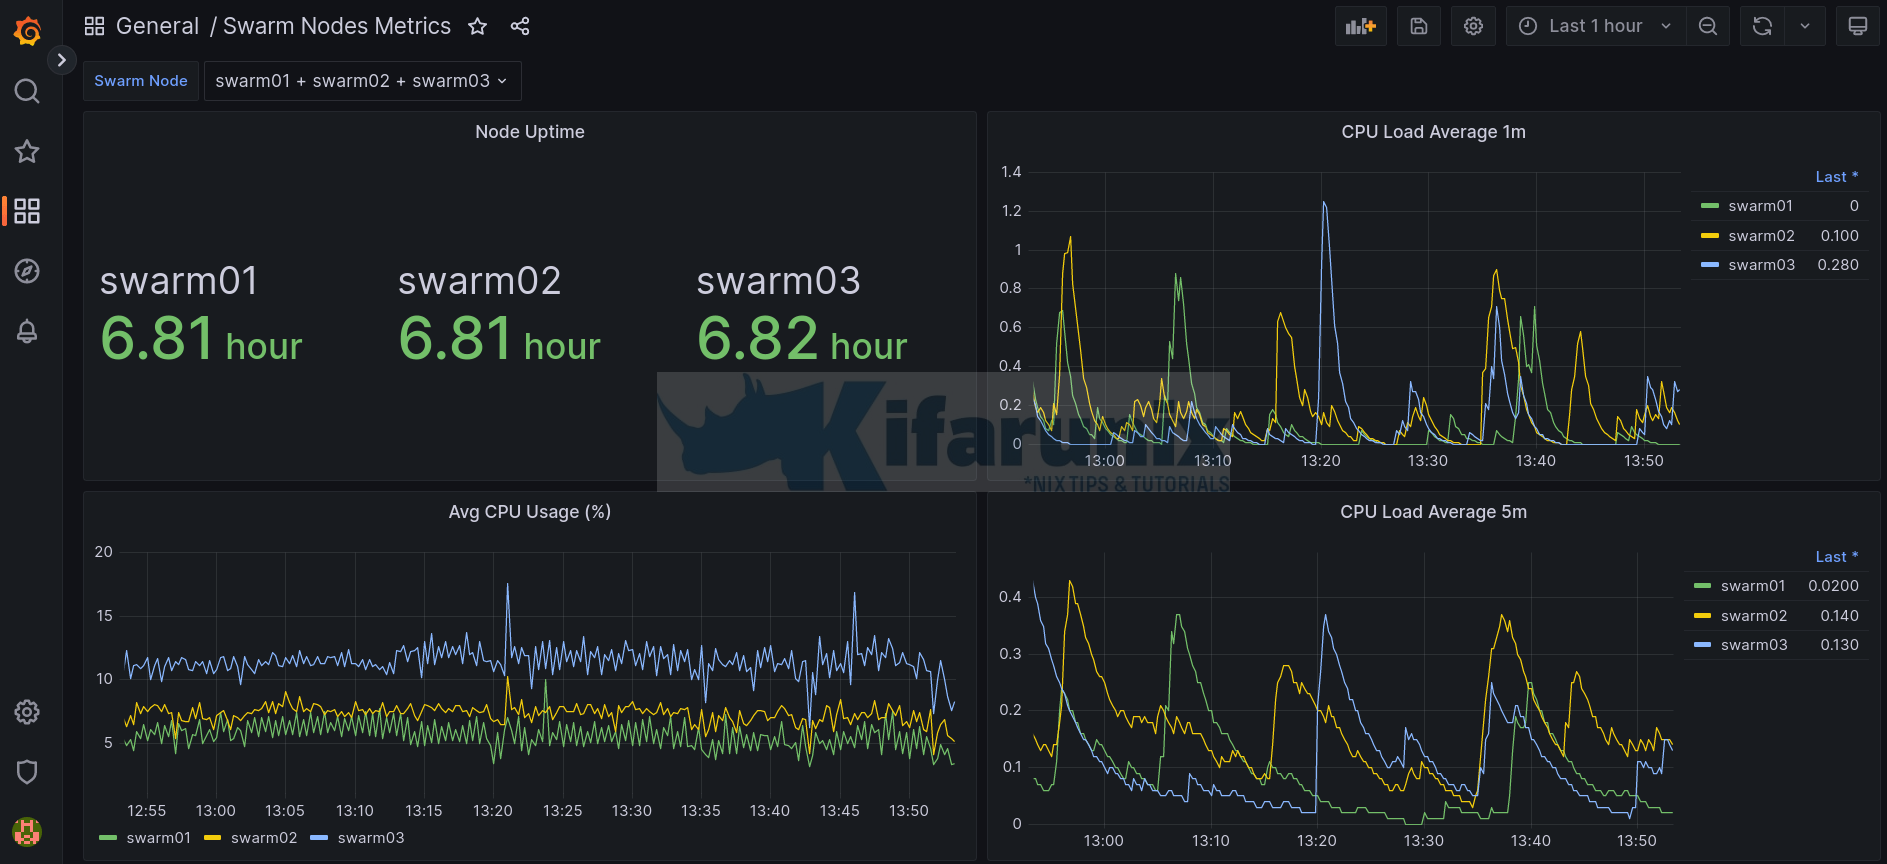
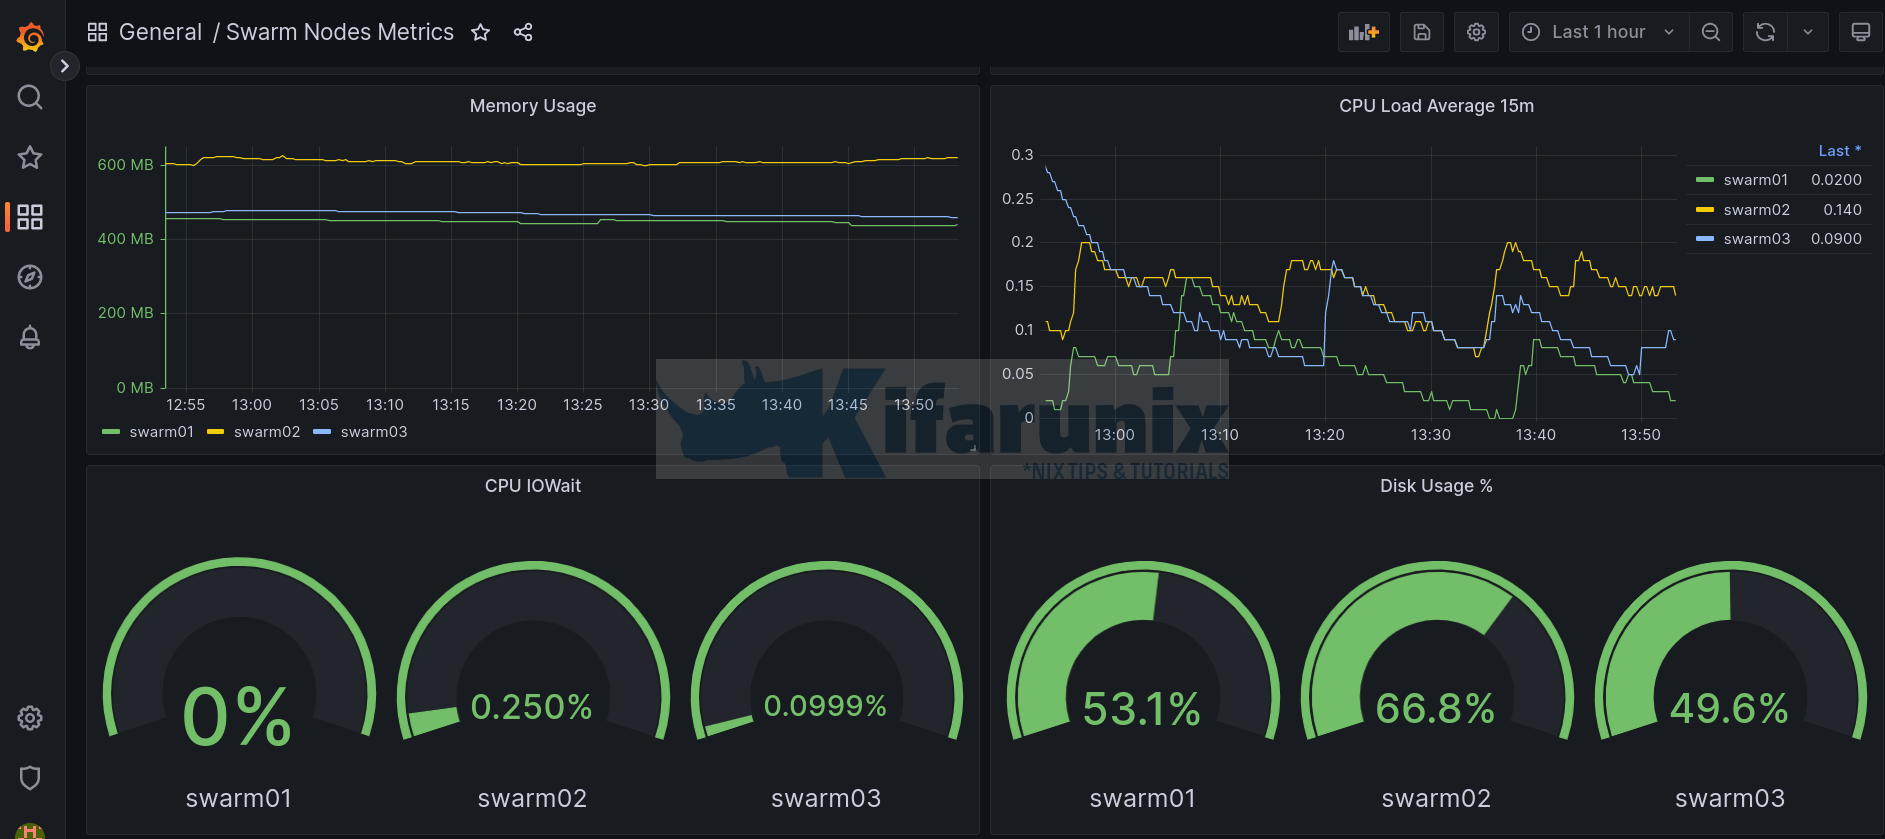
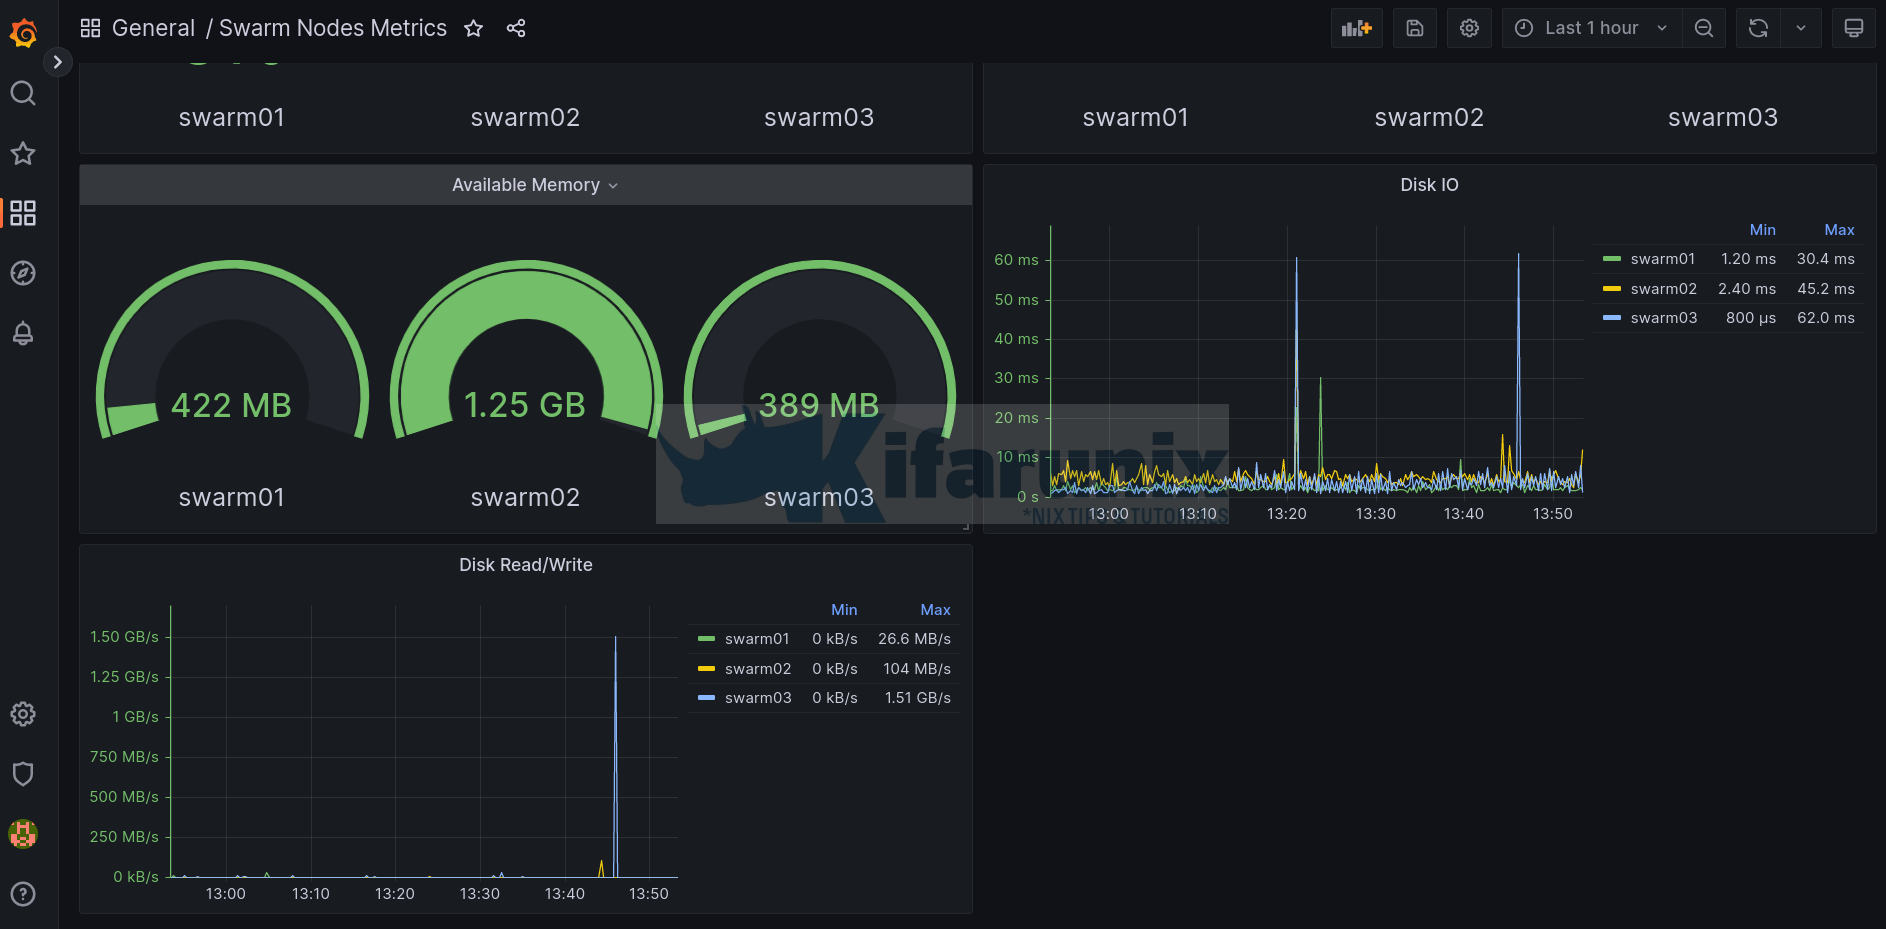
Docker Swarm Nodes CPU usage, RAM usage, Disk usage, Disk IO, sample dashboard;
Here is a sample dashboard JSON file;
{
"annotations": {
"list": [
{
"builtIn": 1,
"datasource": {
"type": "grafana",
"uid": "-- Grafana --"
},
"enable": true,
"hide": true,
"iconColor": "rgba(0, 211, 255, 1)",
"name": "Annotations & Alerts",
"target": {
"limit": 100,
"matchAny": false,
"tags": [],
"type": "dashboard"
},
"type": "dashboard"
}
]
},
"editable": true,
"fiscalYearStartMonth": 0,
"graphTooltip": 0,
"id": 3,
"links": [],
"liveNow": false,
"panels": [
{
"datasource": {
"type": "prometheus",
"uid": "GbRl4cL4k"
},
"fieldConfig": {
"defaults": {
"color": {
"mode": "thresholds"
},
"mappings": [],
"thresholds": {
"mode": "absolute",
"steps": [
{
"color": "green",
"value": null
}
]
},
"unit": "h"
},
"overrides": []
},
"gridPos": {
"h": 8,
"w": 12,
"x": 0,
"y": 0
},
"id": 2,
"options": {
"colorMode": "value",
"graphMode": "none",
"justifyMode": "auto",
"orientation": "auto",
"reduceOptions": {
"calcs": [
"lastNotNull"
],
"fields": "",
"values": false
},
"textMode": "auto"
},
"pluginVersion": "9.4.7",
"targets": [
{
"datasource": {
"type": "prometheus",
"uid": "GbRl4cL4k"
},
"editorMode": "code",
"expr": "avg(node_time_seconds{instance=~\"node-exp-$node:9100\"} - node_boot_time_seconds{instance=~\"node-exp-$node:9100\"}) by (instance) / 3600",
"legendFormat": "__auto",
"range": true,
"refId": "A"
}
],
"title": "Node Uptime",
"transformations": [
{
"id": "renameByRegex",
"options": {
"regex": "node-exp-(\\S+):9100",
"renamePattern": "$1"
}
}
],
"type": "stat"
},
{
"datasource": {
"type": "prometheus",
"uid": "GbRl4cL4k"
},
"fieldConfig": {
"defaults": {
"color": {
"mode": "palette-classic"
},
"custom": {
"axisCenteredZero": false,
"axisColorMode": "text",
"axisLabel": "",
"axisPlacement": "auto",
"barAlignment": 0,
"drawStyle": "line",
"fillOpacity": 0,
"gradientMode": "none",
"hideFrom": {
"legend": false,
"tooltip": false,
"viz": false
},
"lineInterpolation": "linear",
"lineWidth": 1,
"pointSize": 5,
"scaleDistribution": {
"type": "linear"
},
"showPoints": "auto",
"spanNulls": false,
"stacking": {
"group": "A",
"mode": "none"
},
"thresholdsStyle": {
"mode": "off"
}
},
"mappings": [],
"thresholds": {
"mode": "absolute",
"steps": [
{
"color": "green",
"value": null
},
{
"color": "red",
"value": 80
}
]
}
},
"overrides": []
},
"gridPos": {
"h": 8,
"w": 12,
"x": 12,
"y": 0
},
"id": 10,
"options": {
"legend": {
"calcs": [
"lastNotNull"
],
"displayMode": "table",
"placement": "right",
"showLegend": true
},
"tooltip": {
"mode": "single",
"sort": "none"
}
},
"targets": [
{
"datasource": {
"type": "prometheus",
"uid": "GbRl4cL4k"
},
"editorMode": "code",
"expr": "(avg(node_load1{instance=~\"node-exp-$node:9100\"}) by (instance))",
"legendFormat": "__auto",
"range": true,
"refId": "A"
}
],
"title": "CPU Load Average 1m",
"transformations": [
{
"id": "renameByRegex",
"options": {
"regex": ".*node-exp-(\\S+):9100.*",
"renamePattern": "$1"
}
}
],
"type": "timeseries"
},
{
"datasource": {
"type": "prometheus",
"uid": "GbRl4cL4k"
},
"fieldConfig": {
"defaults": {
"color": {
"mode": "palette-classic"
},
"custom": {
"axisCenteredZero": false,
"axisColorMode": "text",
"axisLabel": "",
"axisPlacement": "auto",
"barAlignment": 0,
"drawStyle": "line",
"fillOpacity": 0,
"gradientMode": "none",
"hideFrom": {
"legend": false,
"tooltip": false,
"viz": false
},
"lineInterpolation": "linear",
"lineWidth": 1,
"pointSize": 5,
"scaleDistribution": {
"type": "linear"
},
"showPoints": "auto",
"spanNulls": false,
"stacking": {
"group": "A",
"mode": "none"
},
"thresholdsStyle": {
"mode": "off"
}
},
"mappings": [],
"thresholds": {
"mode": "absolute",
"steps": [
{
"color": "green",
"value": null
},
{
"color": "red",
"value": 80
}
]
}
},
"overrides": []
},
"gridPos": {
"h": 8,
"w": 12,
"x": 0,
"y": 8
},
"id": 4,
"options": {
"legend": {
"calcs": [],
"displayMode": "list",
"placement": "bottom",
"showLegend": true
},
"tooltip": {
"mode": "single",
"sort": "none"
}
},
"targets": [
{
"datasource": {
"type": "prometheus",
"uid": "GbRl4cL4k"
},
"editorMode": "code",
"expr": "100 - (avg(irate(node_cpu_seconds_total{instance=~\"node-exp-$node:9100\",mode=\"idle\"}[$__rate_interval])) by (instance) * 100)",
"legendFormat": "__auto",
"range": true,
"refId": "A"
}
],
"title": "Avg CPU Usage (%)",
"transformations": [
{
"id": "renameByRegex",
"options": {
"regex": ".*node-exp-(\\S+):9100.*",
"renamePattern": "$1"
}
}
],
"type": "timeseries"
},
{
"datasource": {
"type": "prometheus",
"uid": "GbRl4cL4k"
},
"fieldConfig": {
"defaults": {
"color": {
"mode": "palette-classic"
},
"custom": {
"axisCenteredZero": false,
"axisColorMode": "text",
"axisLabel": "",
"axisPlacement": "auto",
"barAlignment": 0,
"drawStyle": "line",
"fillOpacity": 0,
"gradientMode": "none",
"hideFrom": {
"legend": false,
"tooltip": false,
"viz": false
},
"lineInterpolation": "linear",
"lineWidth": 1,
"pointSize": 5,
"scaleDistribution": {
"type": "linear"
},
"showPoints": "auto",
"spanNulls": false,
"stacking": {
"group": "A",
"mode": "none"
},
"thresholdsStyle": {
"mode": "off"
}
},
"mappings": [],
"thresholds": {
"mode": "absolute",
"steps": [
{
"color": "green",
"value": null
},
{
"color": "red",
"value": 80
}
]
}
},
"overrides": []
},
"gridPos": {
"h": 8,
"w": 12,
"x": 12,
"y": 8
},
"id": 11,
"options": {
"legend": {
"calcs": [
"lastNotNull"
],
"displayMode": "table",
"placement": "right",
"showLegend": true
},
"tooltip": {
"mode": "single",
"sort": "none"
}
},
"targets": [
{
"datasource": {
"type": "prometheus",
"uid": "GbRl4cL4k"
},
"editorMode": "code",
"expr": "(avg(node_load5{instance=~\"node-exp-$node:9100\"}) by (instance))",
"legendFormat": "__auto",
"range": true,
"refId": "A"
}
],
"title": "CPU Load Average 5m",
"transformations": [
{
"id": "renameByRegex",
"options": {
"regex": ".*node-exp-(\\S+):9100.*",
"renamePattern": "$1"
}
}
],
"type": "timeseries"
},
{
"datasource": {
"type": "prometheus",
"uid": "GbRl4cL4k"
},
"fieldConfig": {
"defaults": {
"color": {
"mode": "palette-classic"
},
"custom": {
"axisCenteredZero": false,
"axisColorMode": "series",
"axisLabel": "",
"axisPlacement": "auto",
"axisSoftMin": 0,
"barAlignment": 0,
"drawStyle": "line",
"fillOpacity": 0,
"gradientMode": "none",
"hideFrom": {
"legend": false,
"tooltip": false,
"viz": false
},
"lineInterpolation": "linear",
"lineWidth": 1,
"pointSize": 5,
"scaleDistribution": {
"type": "linear"
},
"showPoints": "never",
"spanNulls": false,
"stacking": {
"group": "A",
"mode": "none"
},
"thresholdsStyle": {
"mode": "off"
}
},
"mappings": [],
"thresholds": {
"mode": "absolute",
"steps": [
{
"color": "green",
"value": null
},
{
"color": "red",
"value": 80
}
]
},
"unit": "decmbytes"
},
"overrides": []
},
"gridPos": {
"h": 8,
"w": 12,
"x": 0,
"y": 16
},
"id": 5,
"options": {
"legend": {
"calcs": [],
"displayMode": "list",
"placement": "bottom",
"showLegend": true
},
"tooltip": {
"mode": "single",
"sort": "none"
}
},
"targets": [
{
"datasource": {
"type": "prometheus",
"uid": "GbRl4cL4k"
},
"editorMode": "code",
"expr": "avg((node_memory_MemTotal_bytes{instance=~\"node-exp-$node:9100\"} - (node_memory_MemFree_bytes{instance=~\"node-exp-$node:9100\"} + node_memory_Cached_bytes{instance=~\"node-exp-$node:9100\"} + node_memory_Buffers_bytes{instance=~\"node-exp-$node:9100\"}))/1024/1024) by (instance)",
"legendFormat": "__auto",
"range": true,
"refId": "A"
}
],
"title": "Memory Usage",
"transformations": [
{
"id": "renameByRegex",
"options": {
"regex": ".*node-exp-(\\S+):9100.*",
"renamePattern": "$1"
}
}
],
"type": "timeseries"
},
{
"datasource": {
"type": "prometheus",
"uid": "GbRl4cL4k"
},
"fieldConfig": {
"defaults": {
"color": {
"mode": "palette-classic"
},
"custom": {
"axisCenteredZero": false,
"axisColorMode": "text",
"axisLabel": "",
"axisPlacement": "auto",
"barAlignment": 0,
"drawStyle": "line",
"fillOpacity": 0,
"gradientMode": "none",
"hideFrom": {
"legend": false,
"tooltip": false,
"viz": false
},
"lineInterpolation": "linear",
"lineWidth": 1,
"pointSize": 5,
"scaleDistribution": {
"type": "linear"
},
"showPoints": "auto",
"spanNulls": false,
"stacking": {
"group": "A",
"mode": "none"
},
"thresholdsStyle": {
"mode": "off"
}
},
"mappings": [],
"thresholds": {
"mode": "absolute",
"steps": [
{
"color": "green",
"value": null
},
{
"color": "red",
"value": 80
}
]
}
},
"overrides": []
},
"gridPos": {
"h": 8,
"w": 12,
"x": 12,
"y": 16
},
"id": 12,
"options": {
"legend": {
"calcs": [
"lastNotNull"
],
"displayMode": "table",
"placement": "right",
"showLegend": true
},
"tooltip": {
"mode": "single",
"sort": "none"
}
},
"targets": [
{
"datasource": {
"type": "prometheus",
"uid": "GbRl4cL4k"
},
"editorMode": "code",
"expr": "(avg(node_load15{instance=~\"node-exp-$node:9100\"}) by (instance))",
"legendFormat": "__auto",
"range": true,
"refId": "A"
}
],
"title": "CPU Load Average 15m",
"transformations": [
{
"id": "renameByRegex",
"options": {
"regex": ".*node-exp-(\\S+):9100.*",
"renamePattern": "$1"
}
}
],
"type": "timeseries"
},
{
"datasource": {
"type": "prometheus",
"uid": "GbRl4cL4k"
},
"fieldConfig": {
"defaults": {
"color": {
"mode": "thresholds"
},
"mappings": [],
"thresholds": {
"mode": "absolute",
"steps": [
{
"color": "green",
"value": null
}
]
},
"unit": "percent"
},
"overrides": []
},
"gridPos": {
"h": 8,
"w": 12,
"x": 0,
"y": 24
},
"id": 6,
"options": {
"orientation": "auto",
"reduceOptions": {
"calcs": [
"lastNotNull"
],
"fields": "",
"values": false
},
"showThresholdLabels": false,
"showThresholdMarkers": true
},
"pluginVersion": "9.4.7",
"targets": [
{
"datasource": {
"type": "prometheus",
"uid": "GbRl4cL4k"
},
"editorMode": "code",
"expr": "(avg(irate(node_cpu_seconds_total{instance=~\"node-exp-$node:9100\",mode=\"iowait\"}[$__rate_interval])) by (instance)) * 100",
"legendFormat": "__auto",
"range": true,
"refId": "A"
}
],
"title": "CPU IOWait",
"transformations": [
{
"id": "renameByRegex",
"options": {
"regex": "node-exp-(\\S+):9100",
"renamePattern": "$1"
}
}
],
"type": "gauge"
},
{
"datasource": {
"type": "prometheus",
"uid": "GbRl4cL4k"
},
"fieldConfig": {
"defaults": {
"color": {
"mode": "thresholds"
},
"mappings": [],
"max": 100,
"min": 0,
"thresholds": {
"mode": "absolute",
"steps": [
{
"color": "green",
"value": null
}
]
},
"unit": "percent"
},
"overrides": []
},
"gridPos": {
"h": 8,
"w": 12,
"x": 12,
"y": 24
},
"id": 9,
"options": {
"orientation": "auto",
"reduceOptions": {
"calcs": [
"lastNotNull"
],
"fields": "",
"values": false
},
"showThresholdLabels": false,
"showThresholdMarkers": true
},
"pluginVersion": "9.4.7",
"targets": [
{
"datasource": {
"type": "prometheus",
"uid": "GbRl4cL4k"
},
"editorMode": "code",
"expr": "(avg((node_filesystem_size_bytes{mountpoint=\"/\"} - node_filesystem_avail_bytes{mountpoint=\"/\"}) / node_filesystem_size_bytes{mountpoint=\"/\"}) by (instance)) * 100",
"legendFormat": "__auto",
"range": true,
"refId": "A"
}
],
"title": "Disk Usage %",
"transformations": [
{
"id": "renameByRegex",
"options": {
"regex": "node-exp-(\\S+):9100",
"renamePattern": "$1"
}
}
],
"type": "gauge"
},
{
"datasource": {
"type": "prometheus",
"uid": "GbRl4cL4k"
},
"fieldConfig": {
"defaults": {
"color": {
"mode": "thresholds"
},
"mappings": [],
"thresholds": {
"mode": "absolute",
"steps": [
{
"color": "green",
"value": null
}
]
},
"unit": "decmbytes"
},
"overrides": []
},
"gridPos": {
"h": 8,
"w": 12,
"x": 0,
"y": 32
},
"id": 7,
"options": {
"orientation": "auto",
"reduceOptions": {
"calcs": [
"lastNotNull"
],
"fields": "",
"values": false
},
"showThresholdLabels": false,
"showThresholdMarkers": true
},
"pluginVersion": "9.4.7",
"targets": [
{
"datasource": {
"type": "prometheus",
"uid": "GbRl4cL4k"
},
"editorMode": "code",
"expr": "(avg(node_memory_MemAvailable_bytes{instance=~\"node-exp-$node:9100\"}) by (instance)) / 1024 / 1024",
"legendFormat": "__auto",
"range": true,
"refId": "A"
}
],
"title": "Available Memory",
"transformations": [
{
"id": "renameByRegex",
"options": {
"regex": "node-exp-(\\S+):9100",
"renamePattern": "$1"
}
}
],
"type": "gauge"
},
{
"datasource": {
"type": "prometheus",
"uid": "GbRl4cL4k"
},
"fieldConfig": {
"defaults": {
"color": {
"mode": "palette-classic"
},
"custom": {
"axisCenteredZero": false,
"axisColorMode": "series",
"axisLabel": "",
"axisPlacement": "auto",
"axisSoftMin": 0,
"barAlignment": 0,
"drawStyle": "line",
"fillOpacity": 0,
"gradientMode": "none",
"hideFrom": {
"legend": false,
"tooltip": false,
"viz": false
},
"lineInterpolation": "linear",
"lineWidth": 1,
"pointSize": 5,
"scaleDistribution": {
"type": "linear"
},
"showPoints": "never",
"spanNulls": false,
"stacking": {
"group": "A",
"mode": "none"
},
"thresholdsStyle": {
"mode": "off"
}
},
"mappings": [],
"thresholds": {
"mode": "absolute",
"steps": [
{
"color": "green",
"value": null
},
{
"color": "red",
"value": 80
}
]
},
"unit": "s"
},
"overrides": []
},
"gridPos": {
"h": 8,
"w": 12,
"x": 12,
"y": 32
},
"id": 13,
"options": {
"legend": {
"calcs": [
"min",
"max"
],
"displayMode": "table",
"placement": "right",
"showLegend": true
},
"tooltip": {
"mode": "single",
"sort": "none"
}
},
"targets": [
{
"datasource": {
"type": "prometheus",
"uid": "GbRl4cL4k"
},
"editorMode": "code",
"expr": "avg(irate(node_disk_io_time_seconds_total{device=\"sda\",instance=~\"node-exp-$node:9100\"}[$__rate_interval])) by (instance)",
"legendFormat": "__auto",
"range": true,
"refId": "A"
}
],
"title": "Disk IO",
"transformations": [
{
"id": "renameByRegex",
"options": {
"regex": ".*node-exp-(\\S+):9100.*",
"renamePattern": "$1"
}
}
],
"type": "timeseries"
},
{
"datasource": {
"type": "prometheus",
"uid": "GbRl4cL4k"
},
"fieldConfig": {
"defaults": {
"color": {
"mode": "palette-classic"
},
"custom": {
"axisCenteredZero": false,
"axisColorMode": "series",
"axisLabel": "",
"axisPlacement": "auto",
"axisSoftMin": 0,
"barAlignment": 0,
"drawStyle": "line",
"fillOpacity": 0,
"gradientMode": "none",
"hideFrom": {
"legend": false,
"tooltip": false,
"viz": false
},
"lineInterpolation": "linear",
"lineWidth": 1,
"pointSize": 5,
"scaleDistribution": {
"type": "linear"
},
"showPoints": "never",
"spanNulls": false,
"stacking": {
"group": "A",
"mode": "none"
},
"thresholdsStyle": {
"mode": "off"
}
},
"mappings": [],
"thresholds": {
"mode": "absolute",
"steps": [
{
"color": "green",
"value": null
},
{
"color": "red",
"value": 80
}
]
},
"unit": "KBs"
},
"overrides": []
},
"gridPos": {
"h": 8,
"w": 12,
"x": 0,
"y": 40
},
"id": 14,
"options": {
"legend": {
"calcs": [
"min",
"max"
],
"displayMode": "table",
"placement": "right",
"showLegend": true
},
"tooltip": {
"mode": "single",
"sort": "none"
}
},
"targets": [
{
"datasource": {
"type": "prometheus",
"uid": "GbRl4cL4k"
},
"editorMode": "code",
"expr": "avg(irate(node_disk_read_bytes_total{instance=~\"node-exp-$node:9100\"}[$__rate_interval])) by (instance)",
"legendFormat": "__auto",
"range": true,
"refId": "A"
}
],
"title": "Disk Read/Write",
"transformations": [
{
"id": "renameByRegex",
"options": {
"regex": ".*node-exp-(\\S+):9100.*",
"renamePattern": "$1"
}
}
],
"type": "timeseries"
}
],
"refresh": "",
"revision": 1,
"schemaVersion": 38,
"style": "dark",
"tags": [],
"templating": {
"list": [
{
"current": {
"selected": true,
"text": [
"swarm01",
"swarm02",
"swarm03"
],
"value": [
"swarm01",
"swarm02",
"swarm03"
]
},
"datasource": {
"type": "prometheus",
"uid": "GbRl4cL4k"
},
"definition": "query_result(node_time_seconds{instance=~\".+\"})",
"hide": 0,
"includeAll": false,
"label": "Swarm Node",
"multi": true,
"name": "node",
"options": [],
"query": {
"query": "query_result(node_time_seconds{instance=~\".+\"})",
"refId": "StandardVariableQuery"
},
"refresh": 1,
"regex": "/instance=\"node-exp-(\\S+):9100.*/",
"skipUrlSync": false,
"sort": 0,
"type": "query"
}
]
},
"time": {
"from": "now-1h",
"to": "now"
},
"timepicker": {},
"timezone": "",
"title": "Swarm Nodes Metrics",
"uid": "11N3xhY4k",
"version": 23,
"weekStart": ""
}
You can also check community created dashboards and import any that might impress you.
That marks the end of our guide on how to monitoring Docker swarm node metrics using Grafana.


