In this guide, we will provide step-by-step instructions on how to install Grafana on Ubuntu 24.04. Grafana is a powerful open-source analytics and visualization platform that allows you to monitor and analyze your data in real-time. By following the installation process outlined below, you will be able to seamlessly set up Grafana on your Ubuntu 24.04 system.
Table of Contents
Installing Grafana on Ubuntu 24.04
There exist different editions of Grafana. There is Grafana Enterprise and Grafana opensource (OSS).
We will be installing Grafana OSS version in this guide.
Grafana can be installed using the DEB binary or directly from the APT repository.
Run System Update
Before you can proceed to install Grafana, ensure that your system packages are up-to-date.
sudo apt update
Installing Grafana using DEB Package
To install Grafana using DEB binary package;
Download Grafana Binary Installer
- Navigate to Grafana downloads page;
- Select the current release version of Grafana
- Select the edition, Enterprise or OSS (this guide installs OSS)
- Execute the installer on the system you are installing Grafana on.
As of this writing, Grafana version 10.4.2.
Thus, replace the value of VER variable below with the current Grafana release version number;
VER=10.4.2wget https://dl.grafana.com/oss/release/grafana_${VER}_amd64.debVerify Integrity of the Grafana Binary Installer
Once the download is done, verify the integrity of the downloaded package by calculating its checksum and comparing it to the one provided on the downloads page;
sha256sum grafana_${VER}_amd64.deb
Compare the resulting hash value with the value on the download’s page.
ENSURE the hash values match!
Install Grafana using DEB Binary on Ubuntu 24.04
If all is well, proceed to install Grafana as shown below;
sudo apt install ./grafana_${VER}_amd64.deb
Reading package lists... Done
Building dependency tree... Done
Reading state information... Done
Note, selecting 'grafana' instead of './grafana_10.4.2_amd64.deb'
The following additional packages will be installed:
  musl
The following NEW packages will be installed:
  grafana musl
0 upgraded, 2 newly installed, 0 to remove and 1 not upgraded.
Need to get 416 kB/115 MB of archives.
After this operation, 424 MB of additional disk space will be used.
Do you want to continue? [Y/n] y
Get:1 http://de.archive.ubuntu.com/ubuntu noble/universe amd64 musl amd64 1.2.4-2 [416 kB]
Get:2 /home/kifarunix/grafana_10.4.2_amd64.deb grafana amd64 10.4.2 [114 MB]
Fetched 416 kB in 1s (719 kB/s)
Selecting previously unselected package musl:amd64.
(Reading database ... 84360 files and directories currently installed.)
Preparing to unpack .../musl_1.2.4-2_amd64.deb ...
Unpacking musl:amd64 (1.2.4-2) ...
Selecting previously unselected package grafana.
Preparing to unpack .../grafana_10.4.2_amd64.deb ...
Unpacking grafana (10.4.2) ...
Setting up musl:amd64 (1.2.4-2) ...
Setting up grafana (10.4.2) ...
info: Selecting UID from range 100 to 999 ...

info: Adding system user `grafana' (UID 112) ...
info: Adding new user `grafana' (UID 112) with group `grafana' ...
info: Not creating home directory `/usr/share/grafana'.
### NOT starting on installation, please execute the following statements to configure grafana to start automatically using systemd
 sudo /bin/systemctl daemon-reload
 sudo /bin/systemctl enable grafana-server
### You can start grafana-server by executing
 sudo /bin/systemctl start grafana-server
Processing triggers for man-db (2.12.0-4build2) ...
Scanning processes...
Scanning linux images...

Running kernel seems to be up-to-date.

No services need to be restarted.

No containers need to be restarted.

No user sessions are running outdated binaries.

No VM guests are running outdated hypervisor (qemu) binaries on this host.
Installing Grafana from APT Repository
To install Grafana from APT repository;
Install Grafana OSS APT repository
sudo apt install software-properties-common curl gnupg2 -yecho "deb https://packages.grafana.com/oss/deb stable main" | sudo tee /etc/apt/sources.list.d/grafana.listInstall Grafana OSS APT repo GPG signing key.
curl -s https://packages.grafana.com/gpg.key | sudo gpg --dearmor -o /etc/apt/trusted.gpg.d/grafana.gpg
Install Grafana from APT Repository on Ubuntu 24.04
After that, re-synchronize your system packages to the latest versions and install Grafana.
sudo apt update
sudo apt install grafana
Verify Grafana Installation
Verify the installed version of Grafana.
apt show grafana
Package: grafana
Version: 10.4.2
Priority: optional
Section: default
Maintainer: [email protected]
Installed-Size: 423 MB
Depends: adduser, libfontconfig1, musl
Homepage: https://grafana.com
License: AGPLv3
Vendor: "Grafana Labs"
Download-Size: 114 MB
APT-Manual-Installed: yes
APT-Sources: https://packages.grafana.com/oss/deb stable/main amd64 Packages
Description: Grafana
Or check the version number;
grafana-server --versionVersion 10.4.2 (commit: 22809dea50455ae875624827dd277b17621b4ed4, branch: HEAD)Running Grafana on Ubuntu 24.04
Once the installation is done, reload systemd unit configuration files and start and enable Grafana to run on system boot.
sudo systemctl daemon-reload
sudo systemctl enable grafana-server --now
You can check the status;
systemctl status grafana-server● grafana-server.service - Grafana instance
Loaded: loaded (/usr/lib/systemd/system/grafana-server.service; enabled; preset: enabled)
Active: active (running) since Mon 2024-05-06 18:04:39 UTC; 34s ago
Docs: http://docs.grafana.org
Main PID: 2652 (grafana)
Tasks: 12 (limit: 4614)
Memory: 48.6M (peak: 48.9M)
CPU: 3.672s
CGroup: /system.slice/grafana-server.service
└─2652 /usr/share/grafana/bin/grafana server --config=/etc/grafana/grafana.ini --pidfile=/run/grafana/grafana-server.pid --packaging=deb cfg:default.paths.logs=/var/log/grafana cfg:default.paths.da>
May 06 18:04:47 monitor01 grafana[2652]: logger=ngalert.state.manager t=2024-05-06T18:04:47.218514966Z level=info msg="State cache has been initialized" states=0 duration=9.226307ms
May 06 18:04:47 monitor01 grafana[2652]: logger=ngalert.multiorg.alertmanager t=2024-05-06T18:04:47.220113137Z level=info msg="Starting MultiOrg Alertmanager"
May 06 18:04:47 monitor01 grafana[2652]: logger=ngalert.scheduler t=2024-05-06T18:04:47.220499798Z level=info msg="Starting scheduler" tickInterval=10s maxAttempts=1
May 06 18:04:47 monitor01 grafana[2652]: logger=ticker t=2024-05-06T18:04:47.22061827Z level=info msg=starting first_tick=2024-05-06T18:04:50Z
May 06 18:04:47 monitor01 grafana[2652]: logger=plugins.update.checker t=2024-05-06T18:04:47.280749562Z level=info msg="Update check succeeded" duration=61.328152ms
May 06 18:04:47 monitor01 grafana[2652]: logger=provisioning.dashboard t=2024-05-06T18:04:47.284989983Z level=info msg="starting to provision dashboards"
May 06 18:04:47 monitor01 grafana[2652]: logger=provisioning.dashboard t=2024-05-06T18:04:47.285008641Z level=info msg="finished to provision dashboards"
May 06 18:04:47 monitor01 grafana[2652]: logger=grafana.update.checker t=2024-05-06T18:04:47.305229831Z level=info msg="Update check succeeded" duration=86.269636ms
May 06 18:04:47 monitor01 grafana[2652]: logger=grafana-apiserver t=2024-05-06T18:04:47.59284037Z level=info msg="Adding GroupVersion playlist.grafana.app v0alpha1 to ResourceManager"
May 06 18:04:47 monitor01 grafana[2652]: logger=grafana-apiserver t=2024-05-06T18:04:47.593314421Z level=info msg="Adding GroupVersion featuretoggle.grafana.app v0alpha1 to ResourceManager"
You can check the logs on;
sudo tail -f /var/log/grafana/grafana.loglogger=ngalert.multiorg.alertmanager t=2024-05-06T18:04:47.220113137Z level=info msg="Starting MultiOrg Alertmanager"
logger=ngalert.scheduler t=2024-05-06T18:04:47.220499798Z level=info msg="Starting scheduler" tickInterval=10s maxAttempts=1
logger=ticker t=2024-05-06T18:04:47.22061827Z level=info msg=starting first_tick=2024-05-06T18:04:50Z
logger=plugins.update.checker t=2024-05-06T18:04:47.280749562Z level=info msg="Update check succeeded" duration=61.328152ms
logger=provisioning.dashboard t=2024-05-06T18:04:47.284989983Z level=info msg="starting to provision dashboards"
logger=provisioning.dashboard t=2024-05-06T18:04:47.285008641Z level=info msg="finished to provision dashboards"
logger=grafana.update.checker t=2024-05-06T18:04:47.305229831Z level=info msg="Update check succeeded" duration=86.269636ms
logger=grafana-apiserver t=2024-05-06T18:04:47.59284037Z level=info msg="Adding GroupVersion playlist.grafana.app v0alpha1 to ResourceManager"
logger=grafana-apiserver t=2024-05-06T18:04:47.593314421Z level=info msg="Adding GroupVersion featuretoggle.grafana.app v0alpha1 to ResourceManager"
logger=infra.usagestats t=2024-05-06T18:05:22.212856048Z level=info msg="Usage stats are ready to report"
Access Grafana UI
Grafana listens on TCP port 3000 by default. It might take a few minutes for the service to fully come up.
sudo ss -altnp | grep grafanaLISTEN 0 4096 *:3000 *:* users:(("grafana",pid=2652,fd=11))To access Grafana UI on the localhost, navigate to the browser and enter the address, http://localhost:3000.
To access Grafana from an externally, use the address, http://grafana-server-IP:3000.
However, for external access, you need to open TCP port 3000 on UFW if it is running.
sudo ufw allow 3000/tcp
If using iptables;
sudo iptables -I INPUT -p tcp -m tcp --dport 3000 -j ACCEPTLogin as admin for both username and password.

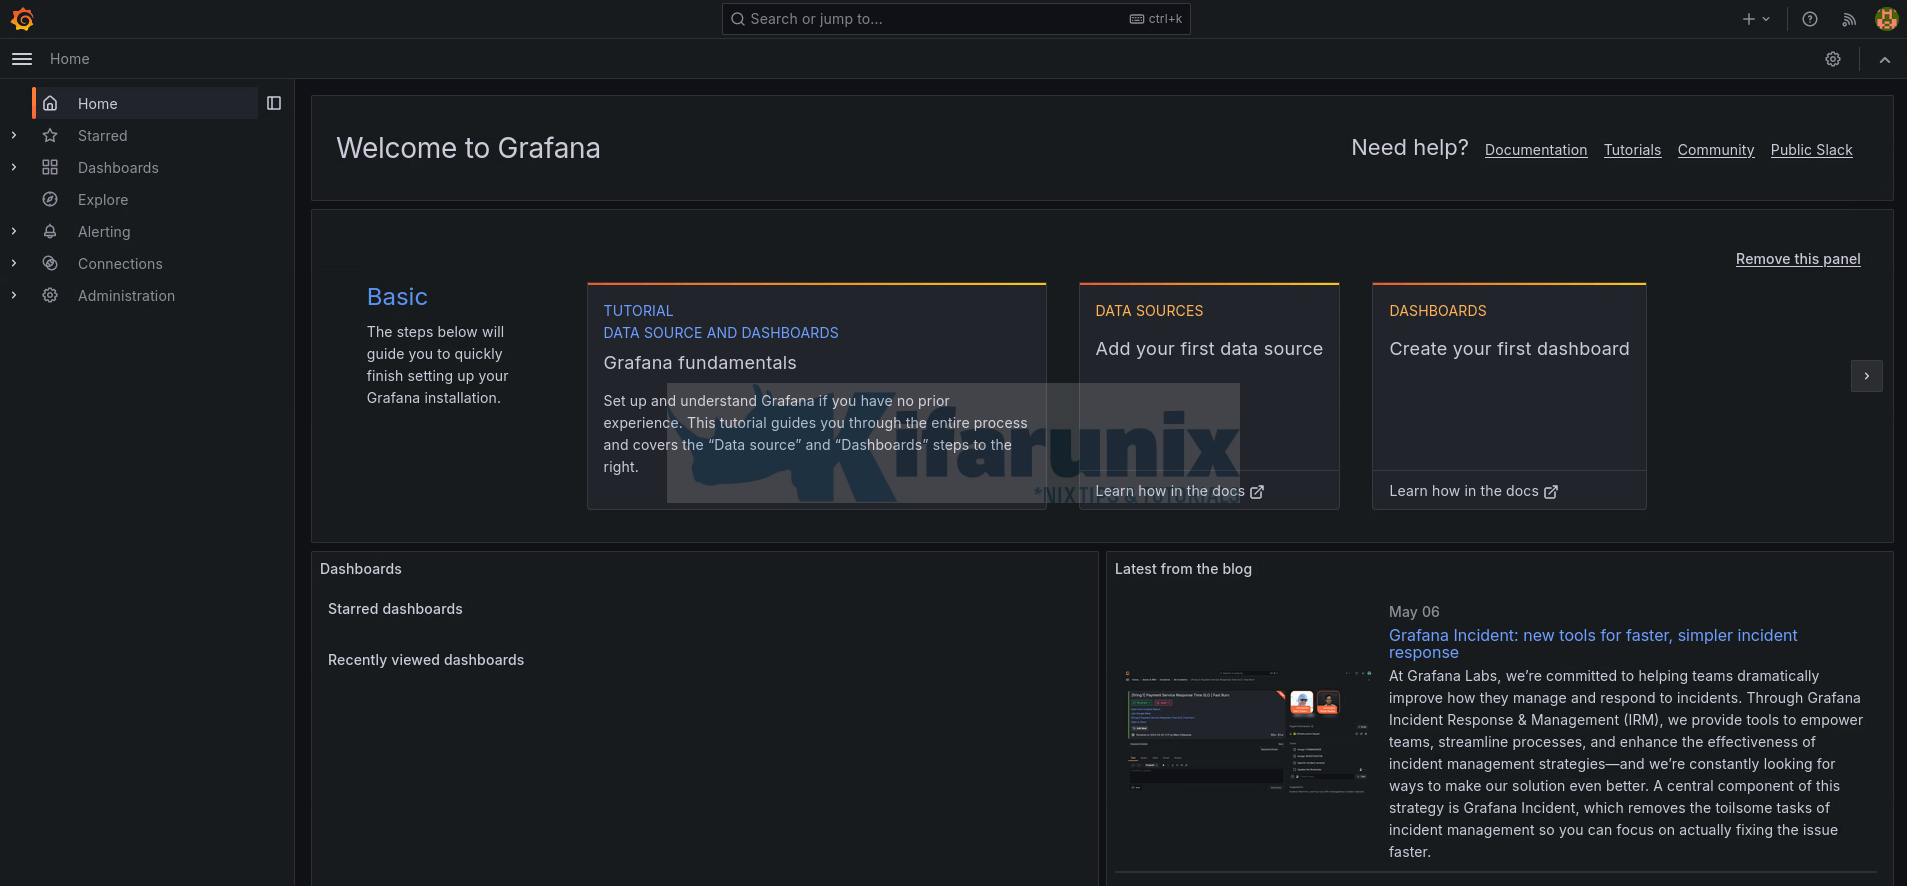
Once you login, you will be prompted to change the password.
You can choose to keep the default credentials and compromise the security of your Grafana or do change the password and proceed to Grafana dashboard.

Naviagate through Grafana Menu
On the left menu, you can explore more about Grafana.
There you go. You have successfully installed Grafana on Ubuntu 24.04 server. Enjoy

