In this tutorial, you will learn how to install ELK stack 9.x on Ubuntu 24.04. Elastic/ELK stack 9.x has been released making it another major version release after Elastic 8.x. Elastic 9.x comes with a lot of improvements that have been extensively covered in the release notes.
Table of Contents
Install ELK Stack 9.x on Ubuntu 24.04
You can run Elastic Stack 9.x as a docker container or run it on your system as a package. We will be installing it as a package in this tutorial.
Hardware Requirements
Setting up Elastic Stack 9 for success starts with the right hardware. Whether you’re spinning up a test environment or deploying a production cluster, your hardware choices directly impact performance, scalability, and reliability. The requirements vary based on your use case—small-scale testing demands less power, while production environments handling large datasets need robust resources. Below, we outline the minimum hardware requirements for Elastic Stack 9:
- RAM: Minimum of 8 GB for test/dev environments; 64 GB or more for production, depending on data processed.
- CPU: Minimum of 4 cores, but more is better for performance.
- Storage: Depends on projected data volume and retention period
Set System Hostname
Begin by setting your system hostname;
sudo su -hostnamectl set-hostname elk-node-01.kifarunix-demo.comUpdate DNS records locally on hosts file if you don’t have DNS server;
echo "192.168.200.8 elk-node-01.kifarunix-demo.com elk" >> /etc/hostsInstall Elastic Stack 9.x Repositories
To install Elastic Stack 9.x on Ubuntu, you need to install Elastic Stack 9.x repositories as follows.
Install Elastic stack 9.x repository signing key.
apt updateapt install gnupg2 -ywget -qO - https://artifacts.elastic.co/GPG-KEY-elasticsearch | \
gpg --dearmor -o /etc/apt/trusted.gpg.d/elastic.gpgInstall the Elastic Stack 9.x repository;
echo "deb https://artifacts.elastic.co/packages/9.x/apt stable main" > /etc/apt/sources.list.d/elastic-9.x.listRun system update;
apt updateInstall ELK Stack 9.x
Elastic stack is made up of various opensource tools;
- Elasticsearch
- Logstash
- Kibana
- Beats
In this setup, I will only install the Kibana and Elasticsearch. Since I do not require any special data processing on data, Logstash wont be necessary.
Install Elasticsearch 9.x on Ubuntu 24.04
You can install Elasticsearch 9.x automatically from Elastic repos installed above by executing the command below;
apt install elasticsearch -yDuring the installation, the Security features will be enabled by default;
- Authentication and authorization are enabled.
- TLS for the transport and HTTP layers is enabled and configured.
- Elastic super user account (elastic) and its password is created.
Here is the sample installation output summary:
...
Creating elasticsearch group... OK
Creating elasticsearch user... OK
Unpacking elasticsearch (9.0.1) ...
Setting up elasticsearch (9.0.1) ...
--------------------------- Security autoconfiguration information ------------------------------

Authentication and authorization are enabled.
TLS for the transport and HTTP layers is enabled and configured.

The generated password for the elastic built-in superuser is : +QC7jaA63Us1OKhzHiE5

If this node should join an existing cluster, you can reconfigure this with
'/usr/share/elasticsearch/bin/elasticsearch-reconfigure-node --enrollment-token '
after creating an enrollment token on your existing cluster.

You can complete the following actions at any time:

Reset the password of the elastic built-in superuser with
'/usr/share/elasticsearch/bin/elasticsearch-reset-password -u elastic'.

Generate an enrollment token for Kibana instances with
 '/usr/share/elasticsearch/bin/elasticsearch-create-enrollment-token -s kibana'.

Generate an enrollment token for Elasticsearch nodes with
'/usr/share/elasticsearch/bin/elasticsearch-create-enrollment-token -s node'.

-------------------------------------------------------------------------------------------------
### NOT starting on installation, please execute the following statements to configure elasticsearch service to start automatically using systemd
 sudo systemctl daemon-reload
 sudo systemctl enable elasticsearch.service
### You can start elasticsearch service by executing
 sudo systemctl start elasticsearch.service
Scanning processes...
Scanning linux images...
...
Configure Elasticsearch 9.x on Ubuntu
Since we are running a basic setup single node cluster, we will go with the default settings.
If you check the Elasticsearch configuration file, /etc/elasticsearch/elasticsearch.yml, you will see the security setting enabled;
cat /etc/elasticsearch/elasticsearch.yml...
#----------------------- BEGIN SECURITY AUTO CONFIGURATION -----------------------
#
# The following settings, TLS certificates, and keys have been automatically
# generated to configure Elasticsearch security features on 18-05-2025 08:22:16
#
# --------------------------------------------------------------------------------
# Enable security features
xpack.security.enabled: true
xpack.security.enrollment.enabled: true
# Enable encryption for HTTP API client connections, such as Kibana, Logstash, and Agents
xpack.security.http.ssl:
enabled: true
keystore.path: certs/http.p12
# Enable encryption and mutual authentication between cluster nodes
xpack.security.transport.ssl:
enabled: true
verification_mode: certificate
keystore.path: certs/transport.p12
truststore.path: certs/transport.p12
# Create a new cluster with the current node only
# Additional nodes can still join the cluster later
cluster.initial_master_nodes: ["elk-node-01.kifarunix-demo.com"]
# Allow HTTP API connections from anywhere
# Connections are encrypted and require user authentication
http.host: 0.0.0.0
# Allow other nodes to join the cluster from anywhere
# Connections are encrypted and mutually authenticated
#transport.host: 0.0.0.0
#----------------------- END SECURITY AUTO CONFIGURATION -------------------------
Without comment lines, this is how the default Elasticsearch 9.0 configuration looks like;
grep -Ev '^#|^$' /etc/elasticsearch/elasticsearch.ymlpath.data: /var/lib/elasticsearch
path.logs: /var/log/elasticsearch
xpack.security.enabled: true
xpack.security.enrollment.enabled: true
xpack.security.http.ssl:
enabled: true
keystore.path: certs/http.p12
xpack.security.transport.ssl:
enabled: true
verification_mode: certificate
keystore.path: certs/transport.p12
truststore.path: certs/transport.p12
cluster.initial_master_nodes: ["elk-node-01.kifarunix-demo.com"]
http.host: 0.0.0.0
Of course you can update the cluster name, node name, the host and the port details as you wish. The defaults are used anyway.
Adjust Elasticsearch JVM Settings
Elasticsearch typically configures its JVM heap size automatically based on the node’s roles and total memory. For most production setups, it’s advisable to stick with these default settings.
However, if you need to change the default heap size, you can do so by setting the minimum (Xms) and maximum (Xmx) heap size. It’s important to note that Xms and Xmx should have the same values.
When adjusting the heap size, consider the available RAM. Keep Xms and Xmx at 50% or below of your total memory and if you have more RAM, the maximum JVM should be 32G as per documentation.
For example, in our setup, our test server has 8G RAM and we set the heap size is set to 4096M for both maximum and minimum sizes.
echo "-Xms4g
-Xmx4g" > /etc/elasticsearch/jvm.options.d/jvm-heap.options
Update the heap size as per your resource allocated to the system.
That sums up our configurations for Elasticsearch.You can check other Important system configurations.
Running Elasticsearch
Start and enable Elasticsearchto run on system boot;
systemctl daemon-reloadsystemctl enable --now elasticsearchTo check the status;
systemctl status elasticsearch● elasticsearch.service - Elasticsearch
Loaded: loaded (/usr/lib/systemd/system/elasticsearch.service; enabled; preset: enabled)
Active: active (running) since Sun 2025-05-18 08:56:43 UTC; 1s ago
Docs: https://www.elastic.co
Main PID: 1153 (java)
Tasks: 105 (limit: 9440)
Memory: 4.5G (peak: 4.5G)
CPU: 37.891s
CGroup: /system.slice/elasticsearch.service
├─1153 /usr/share/elasticsearch/jdk/bin/java -Xms4m -Xmx64m -XX:+UseSerialGC -Dcli.name=server -Dcli.script=/usr/share/elasticsearch/bin/elasticsearch -Dcli.libs=lib/tools/server-cli -Des.path>
├─1218 /usr/share/elasticsearch/jdk/bin/java -Des.networkaddress.cache.ttl=60 -Des.networkaddress.cache.negative.ttl=10 -XX:+AlwaysPreTouch -Xss1m -Djava.awt.headless=true -Dfile.encoding=UTF->
└─1241 /usr/share/elasticsearch/modules/x-pack-ml/platform/linux-x86_64/bin/controller
May 18 08:56:30 elk-node-01.kifarunix-demo.com systemd[1]: Starting elasticsearch.service - Elasticsearch...
May 18 08:56:43 elk-node-01.kifarunix-demo.com systemd[1]: Started elasticsearch.service - Elasticsearch.
You can as well verify ES status using curl command. Replace the IP/hostname/domain name accordingly.
curl https://elk-node-01.kifarunix-demo.com:9200 --cacert /etc/elasticsearch/certs/http_ca.crt -u elasticWhen prompted, enter the Elasticsearch password generated during installation of Elasticsearch;
The generated password for the elastic built-in superuser is : +QC7jaA63Us1OKhzHiE5If you get such an output, then all is well.
Enter host password for user 'elastic':
{
  "name" : "elk-node-01.kifarunix-demo.com",
  "cluster_name" : "elasticsearch",
  "cluster_uuid" : "B7e6dOg6QviRnn3PkW0bSQ",
  "version" : {
    "number" : "9.0.1",
    "build_flavor" : "default",
    "build_type" : "deb",
    "build_hash" : "73f7594ea00db50aa7e941e151a5b3985f01e364",
    "build_date" : "2025-04-30T10:07:41.393025990Z",
    "build_snapshot" : false,
    "lucene_version" : "10.1.0",
    "minimum_wire_compatibility_version" : "8.18.0",
    "minimum_index_compatibility_version" : "8.0.0"
  },
  "tagline" : "You Know, for Search"
}
Also, check the ports are opened, both HTTP and transport ports;
ss -altnp | grep -E "9200|9300"LISTEN 0 4096 *:9200 *:* users:(("java",pid=2441,fd=450))
LISTEN 0 4096 [::1]:9300 [::]:* users:(("java",pid=2441,fd=444))
LISTEN 0 4096 [::ffff:127.0.0.1]:9300 *:* users:(("java",pid=2441,fd=445))
Resetting Elasticsearch Passwords
If you feel that the auto-generated Elastic user password is too complex, you can reset it using /usr/share/elasticsearch/bin/elasticsearch-reset-password command.
/usr/share/elasticsearch/bin/elasticsearch-reset-password --helpSample command options:
Resets the password of users in the native realm and built-in users.

Option (* = required)  Description
---------------------  -----------
-E       Configure a setting
-a, --auto
-b, --batch
-f, --force            Use this option to force execution of the command
                         against a cluster that is currently unhealthy.
-h, --help             Show help
-i, --interactive
-s, --silent           Show minimal output
* -u, --username       The username of the user whose password will be reset
--url                  the URL where the elasticsearch node listens for
                         connections.
-v, --verbose          Show verbose output
Thus, to reset elastic user password, run the command:
/usr/share/elasticsearch/bin/elasticsearch-reset-password -u elastic -iSample command output;
This tool will reset the password of the [elastic] user.
You will be prompted to enter the password.
Please confirm that you would like to continue [y/N]y


Enter password for [elastic]:
Re-enter password for [elastic]:
Password for the [elastic] user successfully reset.
Check Elasticsearch Logs
Elasticsearch writes logs under /var/log/elasticsearch path. The logs that you might need to check if there is any issue with your Elasticsearch instance is /var/log/elasticsearch/CLUSTER_NAME.log.
Where CLUSTER_NAME is the value of the cluster.name option in the elasticsearch.yaml file. If you didn’t change the value, then it defaults to, elasticsearch and hence, the log file should be, /var/log/elasticsearch/elasticsearch.log.
tail -f /var/log/elasticsearch/elasticsearch.logSample logs;
[2025-05-18T08:56:48,324][INFO ][o.e.c.m.MetadataMappingService] [elk-node-01.kifarunix-demo.com] [.ds-.logs-elasticsearch.deprecation-default-2025.05.18-000001/OPl8MNi5Tk2-RGjnls7U4g] update_mapping [_doc]
[2025-05-18T08:56:48,351][INFO ][o.e.x.i.IndexLifecycleTransition] [elk-node-01.kifarunix-demo.com] moving index [.ds-.logs-elasticsearch.deprecation-default-2025.05.18-000001] from [{"phase":"hot","action":"unfollow","name":"branch-check-unfollow-prerequisites"}] to [{"phase":"hot","action":"rollover","name":"check-rollover-ready"}] in policy [.deprecation-indexing-ilm-policy]
[2025-05-18T08:56:53,261][INFO ][o.e.c.m.MetadataCreateIndexService] [elk-node-01.kifarunix-demo.com] [.ds-ilm-history-7-2025.05.18-000001] creating index, cause [initialize_data_stream], templates [ilm-history-7], shards [1]/[1]
[2025-05-18T08:56:53,261][INFO ][o.e.c.m.MetadataCreateDataStreamService] [elk-node-01.kifarunix-demo.com] adding data stream [ilm-history-7] with write index [.ds-ilm-history-7-2025.05.18-000001], backing indices [], and aliases []
[2025-05-18T08:56:53,262][INFO ][o.e.c.r.a.AllocationService] [elk-node-01.kifarunix-demo.com] updating number_of_replicas to [0] for indices [.ds-ilm-history-7-2025.05.18-000001]
[2025-05-18T08:56:53,368][INFO ][o.e.c.r.a.AllocationService] [elk-node-01.kifarunix-demo.com] current.health="GREEN" message="Cluster health status changed from [YELLOW] to [GREEN] (reason: [shards started [[.ds-ilm-history-7-2025.05.18-000001][0]]])." previous.health="YELLOW" reason="shards started [[.ds-ilm-history-7-2025.05.18-000001][0]]"
[2025-05-18T09:05:10,236][INFO ][o.e.x.s.a.f.FileUserPasswdStore] [elk-node-01.kifarunix-demo.com] users file [/etc/elasticsearch/users] changed. updating users...
[2025-05-18T09:05:10,244][INFO ][o.e.x.s.a.f.FileUserRolesStore] [elk-node-01.kifarunix-demo.com] users roles file [/etc/elasticsearch/users_roles] changed. updating users roles...
[2025-05-18T09:05:25,262][INFO ][o.e.x.s.a.f.FileUserPasswdStore] [elk-node-01.kifarunix-demo.com] users file [/etc/elasticsearch/users] changed. updating users...
[2025-05-18T09:05:25,265][INFO ][o.e.x.s.a.f.FileUserRolesStore] [elk-node-01.kifarunix-demo.com] users roles file [/etc/elasticsearch/users_roles] changed. updating users roles...
Install Kibana 9.x on Ubuntu 24.04
Since we already setup Elastic repos, simply install Kibana 9 by running the command;
apt install kibanaReading package lists... Done
Building dependency tree... Done
Reading state information... Done
The following NEW packages will be installed:
kibana
0 upgraded, 1 newly installed, 0 to remove and 165 not upgraded.
Need to get 357 MB of archives.
After this operation, 1,085 MB of additional disk space will be used.
Get:1 https://artifacts.elastic.co/packages/9.x/apt stable/main amd64 kibana amd64 9.0.1 [357 MB]
Fetched 357 MB in 59s (5,999 kB/s)
Selecting previously unselected package kibana.
(Reading database ... 85475 files and directories currently installed.)
Preparing to unpack .../kibana_9.0.1_amd64.deb ...
Unpacking kibana (9.0.1) ...
Setting up kibana (9.0.1) ...
Creating kibana group... OK
Creating kibana user... OK
Created Kibana keystore in /etc/kibana/kibana.keystore
Configure Kibana 9 on Ubuntu 24.04
Configure Kibana to Listen on Non-Loopback Interface
Kibana is set to run on localhost:5601 by default. To allow external access, edit the configuration file and replace the value of server.host with an interface IP.
vim /etc/kibana/kibana.yml# Kibana is served by a back end server. This setting specifies the port to use.
server.port: 5601
...
# To allow connections from remote users, set this parameter to a non-loopback address.
#server.host: "localhost"
server.host: "192.168.200.8"
Those are the only changes we will make for now since we are just running a basic single node cluster.
Save and exit the file.
Generate Kibana-Elasticsearch Enrollment Token
Enrollment token is required to configure Kibana instance to communicate with an existing Elasticsearch cluster that has security features enabled. You can generate an enrollment token for Kibana using the command below;
/usr/share/elasticsearch/bin/elasticsearch-create-enrollment-token -s kibanaeyJ2ZXIiOiI4LjE0LjAiLCJhZHIiOlsiMTkyLjE2OC4yMDAuODo5MjAwIl0sImZnciI6Ijc2MTlkZGRlMTEwN2MzODA0MWU3NGJlOWQyYzVlNDdiYjc0YTNjNGMyMGQzMDlhZmU5MmJkYzBkNzlhYjFkZDQiLCJrZXkiOiJkRmVzNHBZQlZ0TS11cGEzVVJydTpVWTc4SEVkelZLOGNURlFhT1Raa193In0=Generate Kibana Encryption Keys
Kibana uses encryption keys in several areas, ranging from encrypting data in Kibana associated indices to storing session information. The keys required are:
xpack.encryptedSavedObjects.encryptionKey: Used to encrypt stored objects such as dashboards and visualizationsxpack.reporting.encryptionKey: Used to encrypt saved reportsxpack.security.encryptionKey: Used to encrypt session information
These can be generated using the command below;
/usr/share/kibana/bin/kibana-encryption-keys generateThe command will give such an output;
xpack.encryptedSavedObjects.encryptionKey: da5567d0d6f16ed409c1bdc092f2e0a0
xpack.reporting.encryptionKey: e46fb51f65009bf72967d9e6664265e0
xpack.security.encryptionKey: 0c6f4d7708d61473171c147fd49e7ad7
Insert these lines into Kibana config file, kibana.yml.
echo -e "xpack.encryptedSavedObjects.encryptionKey: da5567d0d6f16ed409c1bdc092f2e0a0
xpack.reporting.encryptionKey: e46fb51f65009bf72967d9e6664265e0
xpack.security.encryptionKey: 0c6f4d7708d61473171c147fd49e7ad7" >> /etc/kibana/kibana.yml
With all comment lines removed, this is how our Kibana configuration now looks like;
grep -Ev '^#|^$' /etc/kibana/kibana.ymlserver.port: 5601
server.host: "192.168.200.8"
logging:
appenders:
file:
type: file
fileName: /var/log/kibana/kibana.log
layout:
type: json
root:
appenders:
- default
- file
pid.file: /run/kibana/kibana.pid
xpack.encryptedSavedObjects.encryptionKey: da5567d0d6f16ed409c1bdc092f2e0a0
xpack.reporting.encryptionKey: e46fb51f65009bf72967d9e6664265e0
xpack.security.encryptionKey: 0c6f4d7708d61473171c147fd49e7ad7
If you need to secure Kibana 9 by proxying it with Nginx, you can check how to on our previous by following the link below;
Configure Nginx with SSL to Proxy Kibana
Running Kibana
Once the installation is done, start and enable Kibana 9 to run on system boot.
systemctl enable --now kibanaConfirm Kibana status;
systemctl status kibana● kibana.service - Kibana
Loaded: loaded (/usr/lib/systemd/system/kibana.service; enabled; preset: enabled)
Active: active (running) since Sun 2025-05-18 09:16:56 UTC; 46s ago
Docs: https://www.elastic.co
Main PID: 1791 (node)
Tasks: 11 (limit: 9440)
Memory: 218.4M (peak: 283.4M)
CPU: 7.529s
CGroup: /system.slice/kibana.service
└─1791 /usr/share/kibana/bin/../node/glibc-217/bin/node /usr/share/kibana/bin/../src/cli/dist
May 18 09:16:56 elk-node-01.kifarunix-demo.com kibana[1791]: Native global console methods have been overridden in production environment.
May 18 09:16:58 elk-node-01.kifarunix-demo.com kibana[1791]: [2025-05-18T09:16:58.611+00:00][INFO ][root] Kibana is starting
May 18 09:16:58 elk-node-01.kifarunix-demo.com kibana[1791]: [2025-05-18T09:16:58.653+00:00][INFO ][node] Kibana process configured with roles: [background_tasks, ui]
May 18 09:17:01 elk-node-01.kifarunix-demo.com kibana[1791]: [2025-05-18T09:17:01.506+00:00][INFO ][plugins-service] The following plugins are disabled: "cloudChat,cloudExperiments,cloudFullStory,dataUsage>
May 18 09:17:01 elk-node-01.kifarunix-demo.com kibana[1791]: [2025-05-18T09:17:01.562+00:00][INFO ][http.server.Preboot] http server running at http://192.168.200.8:5601
May 18 09:17:01 elk-node-01.kifarunix-demo.com kibana[1791]: [2025-05-18T09:17:01.676+00:00][INFO ][plugins-system.preboot] Setting up [1] plugins: [interactiveSetup]
May 18 09:17:01 elk-node-01.kifarunix-demo.com kibana[1791]: [2025-05-18T09:17:01.685+00:00][INFO ][preboot] "interactiveSetup" plugin is holding setup: Validating Elasticsearch connection configuration…
May 18 09:17:01 elk-node-01.kifarunix-demo.com kibana[1791]: [2025-05-18T09:17:01.710+00:00][INFO ][root] Holding setup until preboot stage is completed.
May 18 09:17:10 elk-node-01.kifarunix-demo.com kibana[1791]: i Kibana has not been configured.
May 18 09:17:10 elk-node-01.kifarunix-demo.com kibana[1791]: Go to http://192.168.200.8:5601/?code=913173 to get started.
From the status output, you will see such lines, towards the end of the output;
Kibana has not been configured.Go to http://192.168.200.8:5601/?code=913173 to get started.Copy and use the provided Kibana URL (including the code) on browser to access and complete Kibana setup.
Similarly, Kibana logs are available under /var/log/kibana/kibana.log and /var/log/syslog.
Access Kibana 9 Dashboard
You can now access Kibana 9 from your browser using the url provided above, http://192.168.200.8:5601/?code=913173. It could be different for you, so copy the appropriate address.
If UFW is running, open Kibana port;
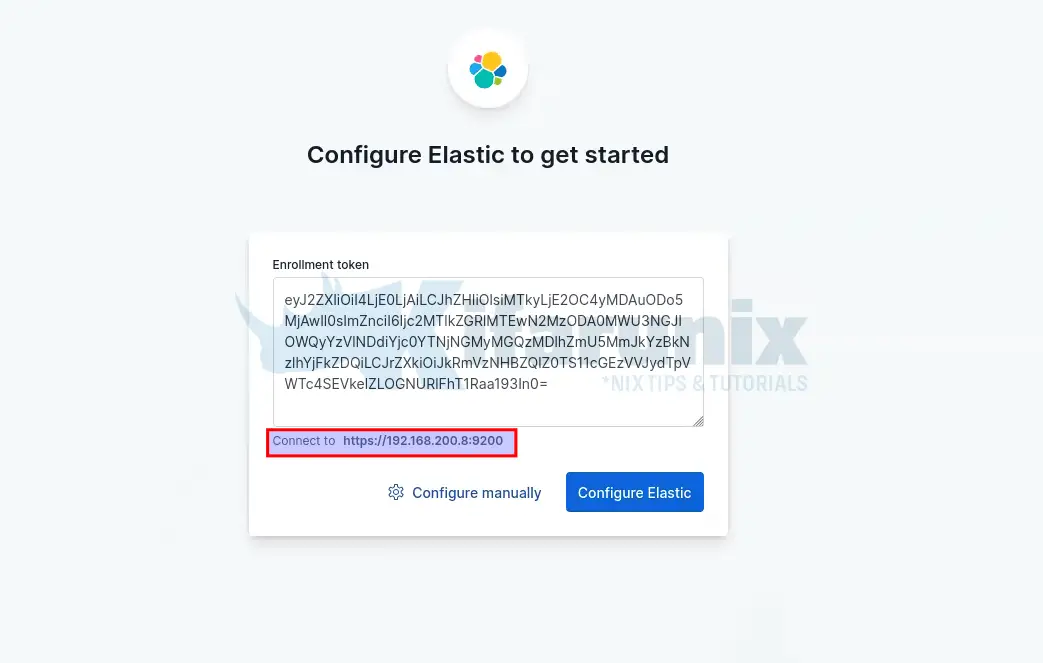
ufw allow 5601/tcpUpon accessing Kibana 9 interface, on the welcome page, you will be required to configure Elastic to get started.
At the beginning, you are required to provide the enrollment token, we generated above.
So just copy the Kibana token generated using the /usr/share/elasticsearch/bin/elasticsearch-create-enrollment-token -s kibana, command and paste on the box.

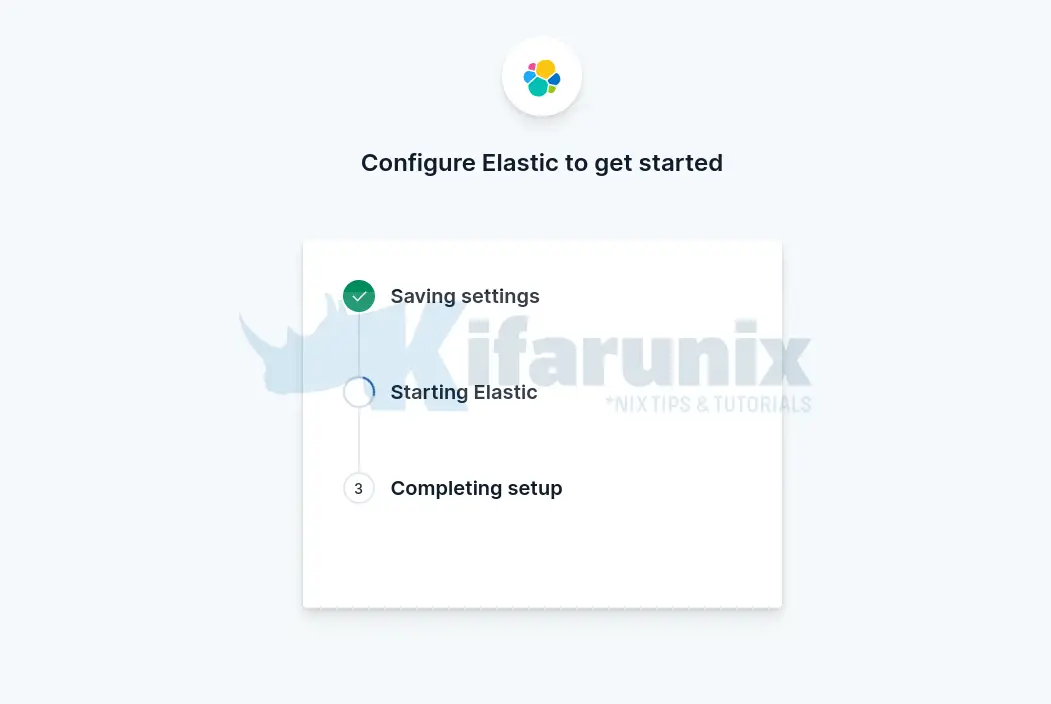
Once you past the token, you will see Kibana automatically connects to Elasticsearch. Thus, click Configure Elastic. This will then save the settings, configure and restart Elasticsearch.

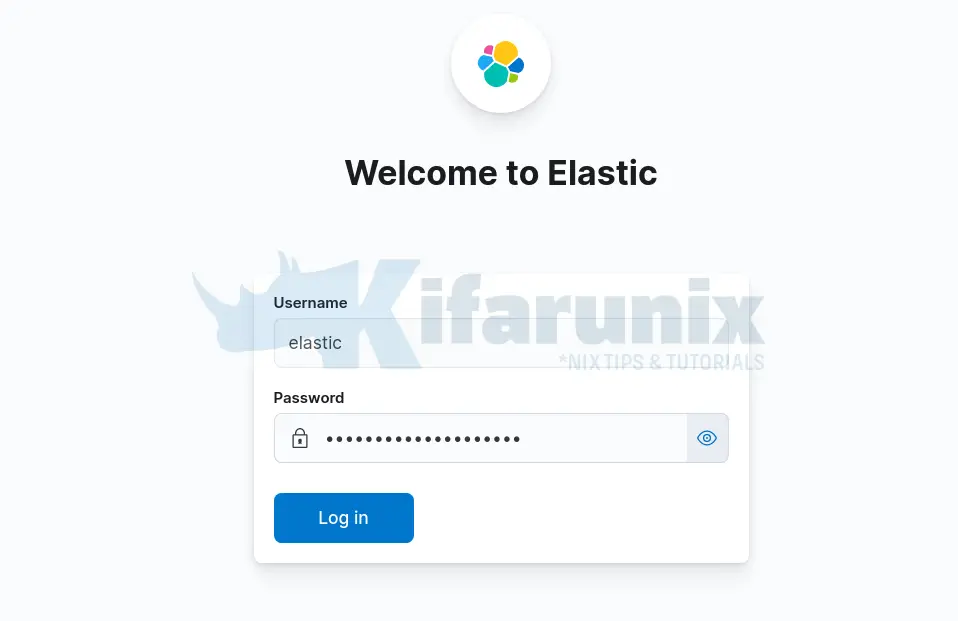
You are then taken to Login page. Login using the generated Elastic user credentials.

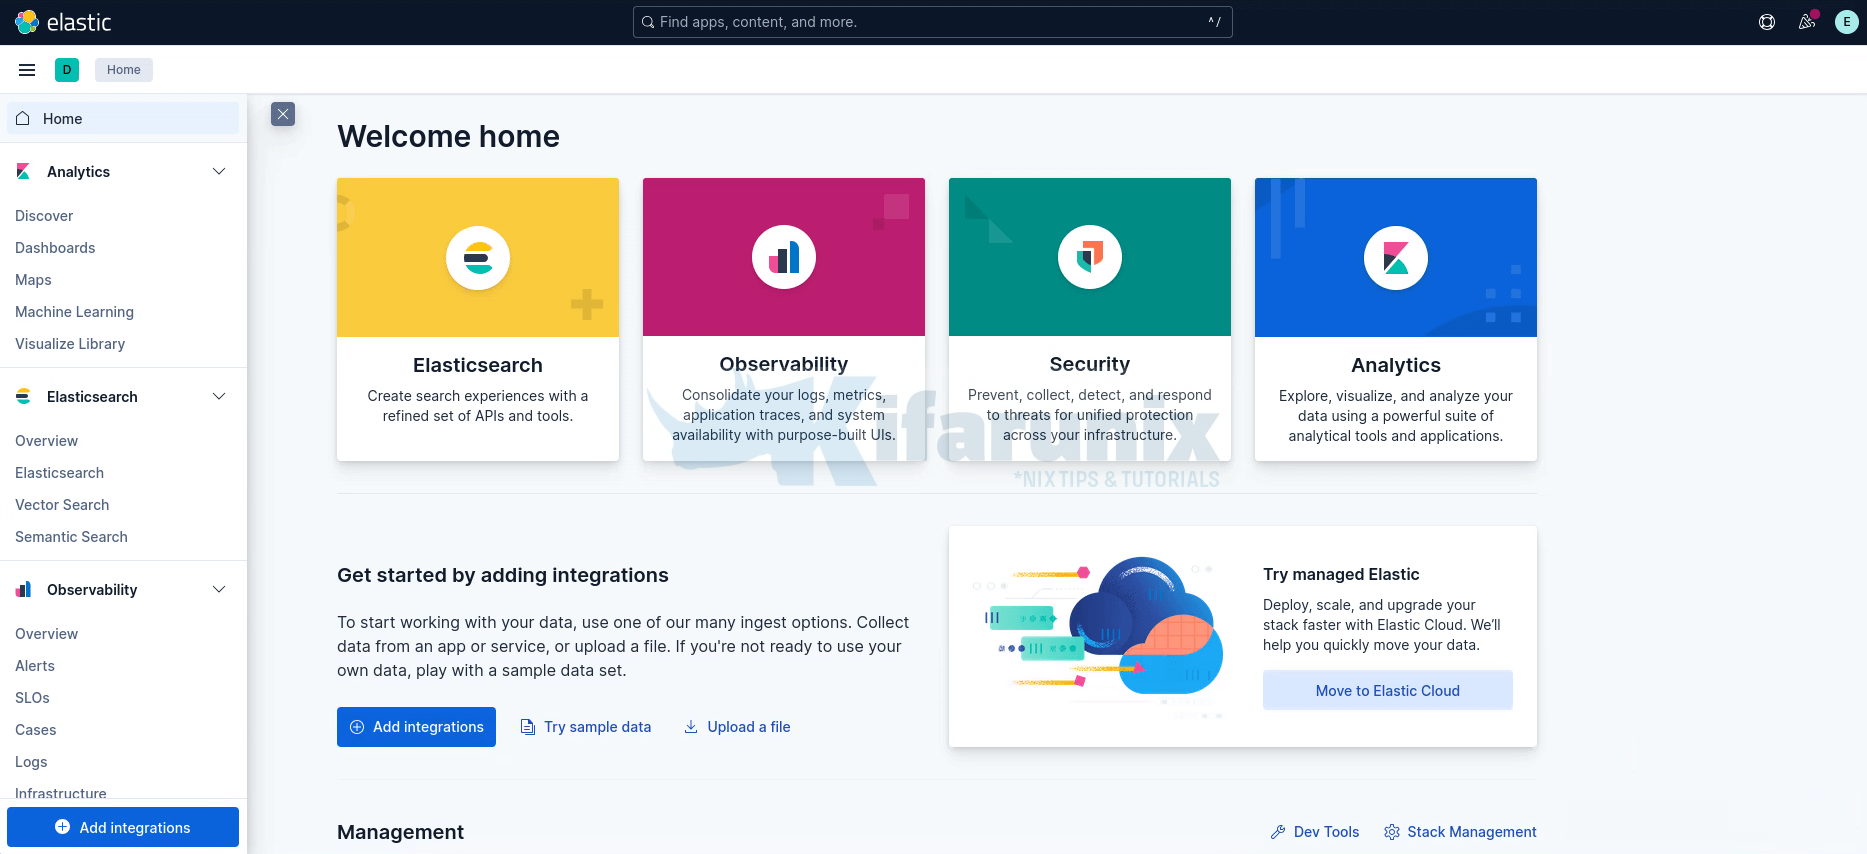
On the welcome page, click Explore on my own to proceed to Kibana 9.x dashboard.

And this is how you can install ELK Stack 9.x. You can now explore further.
For example, click the three-line menu icon in the top-left corner of the dashboard to open the navigation options.

How to Install Logstash 9 and Connect it to Elasticsearch 9
If you want to use Logstah to further process your event log, then consider installing Logstash. Follow the link below to access a comprehensive guide on how to install Logstash 9 on Ubuntu/Debian Linux;
Install Logstash 9 on Ubuntu/Debian
Install Filebeat 9
You can also check our sample Filebeat 9 guide;
Install Filebeat 9 on Ubuntu/Debian
Other Tutorials
Configure Logstash Elasticsearch Basic Authentication

