In this guide, we are going to learn how to install Elastic Stack 7 on Fedora 30/Fedora 29/CentOS 7. Elastic Stack comprises of:
- Elasticsearch is a search and analytics engine
- Kibana is a data visualization and dash-boarding tool that enables you to analyze data stored on Elasticsearch.
- Logstash is a server‑side data processing pipeline that ingests data from multiple sources simultaneously, transforms it, and then stashes it on search analytics engine like Elasticsearch
- Beats on the other hand are the log shippers that collects logs from different endpoints and sends them to either Logstash or directly to Elasticsearch.
Install Elastic Stack 7 on Fedora 30/Fedora 29/CentOS 7
Elastic Stack components should be installed in the following order.
- Install Elasticsearch
- Install Kibana
- Install Logstash
- Install Beats
Installing Elasticsearch 7 on Fedora 30/Fedora 29/CentOS 7
Installation of Elasticsearch 7.0 on Fedora 30/Fedora 29/CentOS 7 has been covered in our previous guides. See the links below;
Install Elasticsearch 7 on Fedora 30
Install Elasticsearch 7.x on CentOS 7/Fedora 29
Configure Elasticsearch Bind Interface
If you need to connect to Elasticsearch externally, you need to bind it to non-loopback interface. Hence, edit the configuration file and set the value of network.host to a non-loopback interface or interface itself. See Special values for network.host.
vim /etc/elasticsearch/elasticsearch.yml...
# ---------------------------------- Network -----------------------------------
#
# Set the bind address to a specific IP (IPv4 or IPv6):
#
#network.host: 192.168.0.1
network.host: 192.168.43.75
...Configure Elasticsearch Single Node Discovery
If you are running Elasticsearch in non-production environment (non-cluster environment) and want to bind transport to an non-loopback interface, just like in this demo, you need to set the discovery mode to single node. Otherwise you may get bootstrap check failed errors.
Therefore add the line, discovery.type: single-node, under the Discovery section of the Elasticsearch configuration file to enable single node discovery.
...
# --------------------------------- Discovery ----------------------------------
#
# Pass an initial list of hosts to perform discovery when this node is started:
# The default list of hosts is ["127.0.0.1", "[::1]"]
#
#discovery.seed_hosts: ["host1", "host2"]
#
# Bootstrap the cluster using an initial set of master-eligible nodes:
#
#cluster.initial_master_nodes: ["node-1", "node-2"]
#
discovery.type: single-node
# For more information, consult the discovery and cluster formation module documentation.
#
# ---------------------------------- Gateway -----------------------------------
Save the configuration file and restart Elasticsearch.
systemctl restart elasticsearch.serviceVerify if Elasticsearch is listening on non-loop interface as defined above.
ss -alnpt | grep 9200
LISTEN  0        128        [::ffff:192.168.43.103]:9200                *:*      users:(("java",pid=30625,fd=213))
You can also check it as follows.
curl -XGET http://192.168.43.103:9200
{
  "name" : "elkstack.example.com",
  "cluster_name" : "elasticsearch",
  "cluster_uuid" : "f_Au_kWoQ4CjVvghdtIW2w",
  "version" : {
    "number" : "7.2.0",
    "build_flavor" : "default",
    "build_type" : "rpm",
    "build_hash" : "508c38a",
    "build_date" : "2019-06-20T15:54:18.811730Z",
    "build_snapshot" : false,
    "lucene_version" : "8.0.0",
    "minimum_wire_compatibility_version" : "6.8.0",
    "minimum_index_compatibility_version" : "6.0.0-beta1"
  },
  "tagline" : "You Know, for Search"
}
Install Kibana 7 on Fedora 30/Fedora 29/CentOS 7
To install Kibana 7, you need to create Elastic repos. However, if you followed the above guides, we already created the Elastic Stack RPM repos. Hence, you can simply run the command below to install Kibana 7.
You can however create Elastic 7.x repos by executing the command below;
- Import Elastic Repo GPG signing key
rpm --import https://artifacts.elastic.co/GPG-KEY-elasticsearch- Create Elastic 7.x Repo
cat > /etc/yum.repos.d/elastic-7.x.repo << EOF
[elasticsearch-7.x]
name=Elasticsearch repository for 7.x packages
baseurl=https://artifacts.elastic.co/packages/7.x/yum
gpgcheck=1
gpgkey=https://artifacts.elastic.co/GPG-KEY-elasticsearch
enabled=1
autorefresh=1
type=rpm-md
EOF
Note, since YUM package manager works on both Fedora and CentOS, we will be using YUM for package installation. You can however use DNF on Fedora system.
yum install kibanaOnce the installation is done, start and enable Kibana to run on system boot.
systemctl start kibana
systemctl enable kibana
Kibana is set to run on localhost:5601 by default. As a layer of security, we are going to Nginx and configure it to proxy the connection to Kibana via a publicly accessible interface IP.
Install Nginx
yum install nginxNote that you need to install EPEL repos on CentOS 7 in order to install Nginx.
yum install epel-releaseConfigure Nginx with SSL to Proxy Kibana
Generate the SSL/TLS certificates for Nginx SSL proxy connection and create Nginx configuration file to define Kibana settings. In this guide, we are using self-signed certificate. You can as well obtain a trusted CA certificate from your preferred provider.
Generate Self-signed SSL/TLS certificates
mkdir /etc/ssl/privateopenssl req -x509 -nodes -days 365 -newkey rsa:2048 -keyout /etc/ssl/private/kibana-selfsigned.key -out /etc/ssl/certs/kibana-selfsigned.crtCreate Kibana Nginx configuration. You can use the recommendations from the Cipherli.st while configuring SSL.
vim /etc/nginx/conf.d/kibana.confserver {
listen 80;
server_name elastic.example.com;
return 301 https://$host$request_uri;
}
server {
listen 443 ssl;
server_name elastic.example.com;
root /usr/share/nginx/html;
index index.html index.htm index.nginx-debian.html;
ssl_certificate /etc/ssl/certs/kibana-selfsigned.crt;
ssl_certificate_key /etc/ssl/private/kibana-selfsigned.key;
ssl_protocols TLSv1.2 TLSv1.3;
ssl_prefer_server_ciphers on;
ssl_dhparam /etc/ssl/certs/dhparam.pem;
ssl_ciphers ECDHE-RSA-AES256-GCM-SHA512:DHE-RSA-AES256-GCM-SHA512:ECDHE-RSA-AES256-GCM-SHA384:DHE-RSA-AES256-GCM-SHA384:ECDHE-RSA-AES256-SHA384;
ssl_ecdh_curve secp384r1;
ssl_session_timeout 10m;
ssl_session_cache shared:SSL:10m;
resolver 192.168.43.1 8.8.8.8 valid=300s;
resolver_timeout 5s;
add_header Strict-Transport-Security "max-age=63072000; includeSubDomains; preload";
add_header X-Frame-Options DENY;
add_header X-Content-Type-Options nosniff;
add_header X-XSS-Protection "1; mode=block";
access_log /var/log/nginx/kibana_access.log;
error_log /var/log/nginx/kibana_error.log;
auth_basic "Authentication Required";
auth_basic_user_file /etc/nginx/.kibana-auth;
location / {
proxy_pass http://127.0.0.1:5601;
proxy_http_version 1.1;
proxy_set_header Upgrade $http_upgrade;
proxy_set_header Connection 'upgrade';
proxy_set_header Host $host;
proxy_cache_bypass $http_upgrade;
}
}Generate Deffie-Hellman group on the location specified by the ssl_dhparam parameter.
openssl dhparam -out /etc/ssl/certs/dhparam.pem 2048Set the value of types_hash_max_size to 4096.
sed -i 's/types_hash_max_size 2048/types_hash_max_size 4096/' /etc/nginx/nginx.confConfigure Nginx Authentication
To configure Nginx User authentication, you need to create users and their password. These authentication details will be saved in the file, /etc/nginx/.kibana-auth, specified by auth_basic_user_file parameter in the Nginx configuration file.
You can use openssl command to generate the authentication credentials as shown below. Replace the USERNAME and PASSWORD accordingly;
printf "USERNAME:$(openssl passwd -crypt PASSWORD)\n" > /etc/nginx/.kibana-authVerify the Nginx syntax and reload it if everything is okay.
nginx -t
nginx: the configuration file /etc/nginx/nginx.conf syntax is ok
nginx: configuration file /etc/nginx/nginx.conf test is successful
Start and enable Nginx to run on system boot.
systemctl start nginx
systemctl enable nginx
If Firewalld is running, allow Nginx connections, both HTTP and HTTPS.
firewall-cmd --add-service={http,https} --permanent
firewall-cmd --reload
If SELinux is running, configure it to allow Nginx to connect to network.
setsebool -P httpd_can_network_connect 1Configure Kibana
Since we set the proxy to loopback IP address instead of localhost, you need to configure Kibana to use loopback IP address.
vim /etc/kibana/kibana.ymlserver.host: "127.0.0.1"Also, If Elasticsearch is configured to listen on a different IP address, you need to configure Elasticsearch URL in Kibana.
elasticsearch.hosts: ["http://192.168.43.75:9200"]Access Kibana Dashboard
You should now be able to access Kibana dashboard via the server fully qualified hostname, https://elastic.example.com in this case. Accept the risk of using the self-signed certificate and proceed. Before you can access the Kibana dashboard, you will be required to provide the authentication credentials set above.

After authentication, you will land on Kibana dashboard. Since we don’t have data yet, you will see the screen below. Click Explore My Own to proceed to Kibana dashboard.

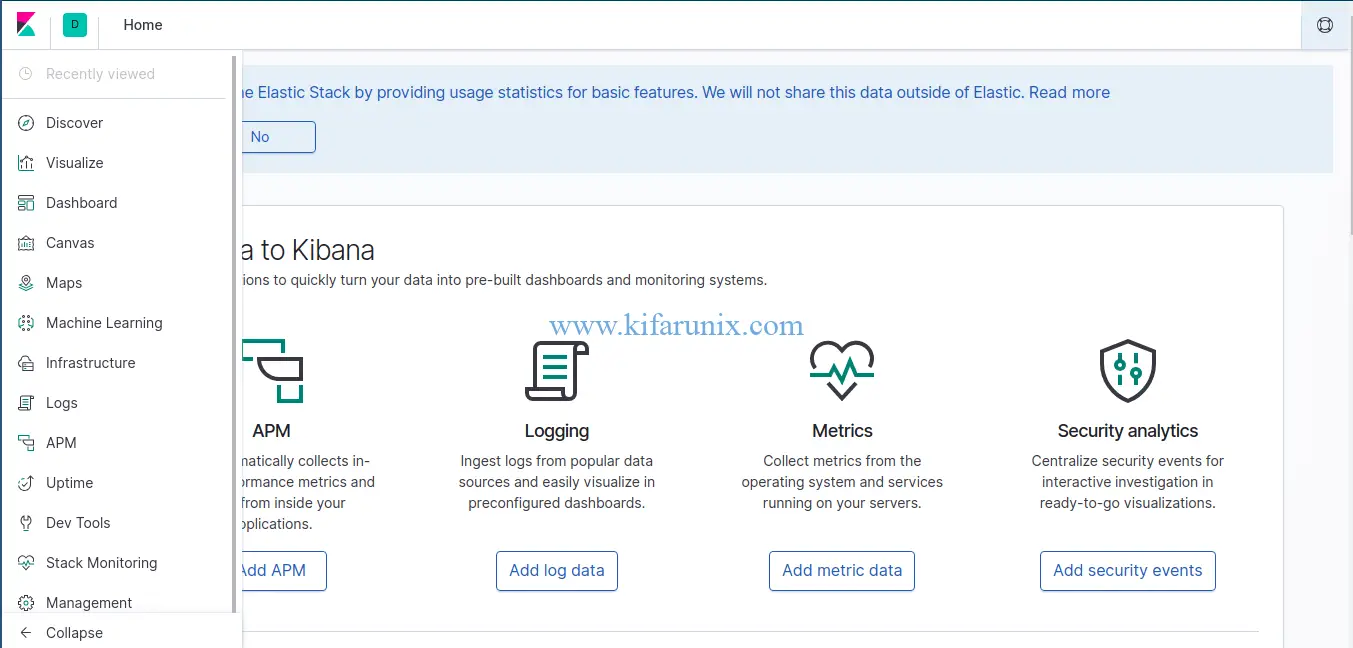
Kibana is now installed on Fedora 30/Fedora 29/CentOS 7. The next step is to install Logstash, the data processing engine and Filebeat data shippers. See how to install Logstash and Filebeat by following the links below;
Install Logstash 7 on Fedora 30/Fedora 29/CentOS 7
Install Filebeat on Fedora 30/Fedora 29/CentOS 7
Create Kibana Index Pattern
Now that your Filebeat is sending events to your Elastic stack, you need to add your Elasticsearch index to Kibana. Hence, Click the settings gear icon on the left panel of Kibana and navigate to Index Patters under Kibana > Create Index Patterns.
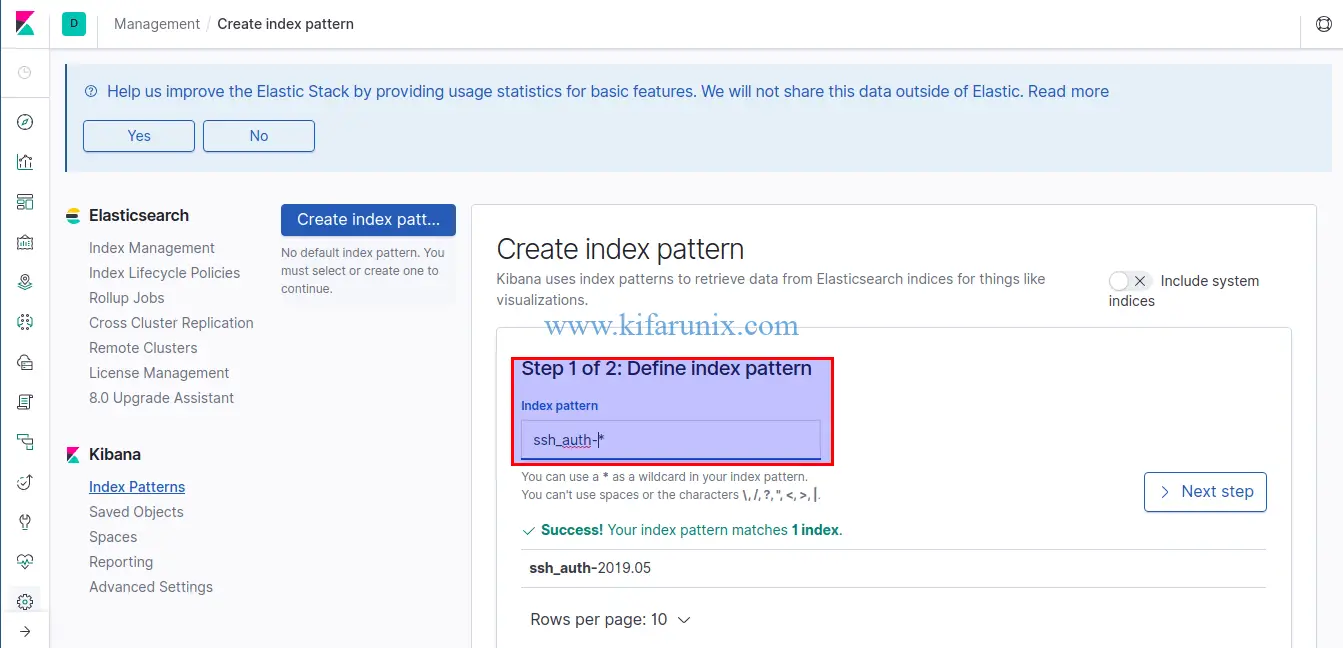
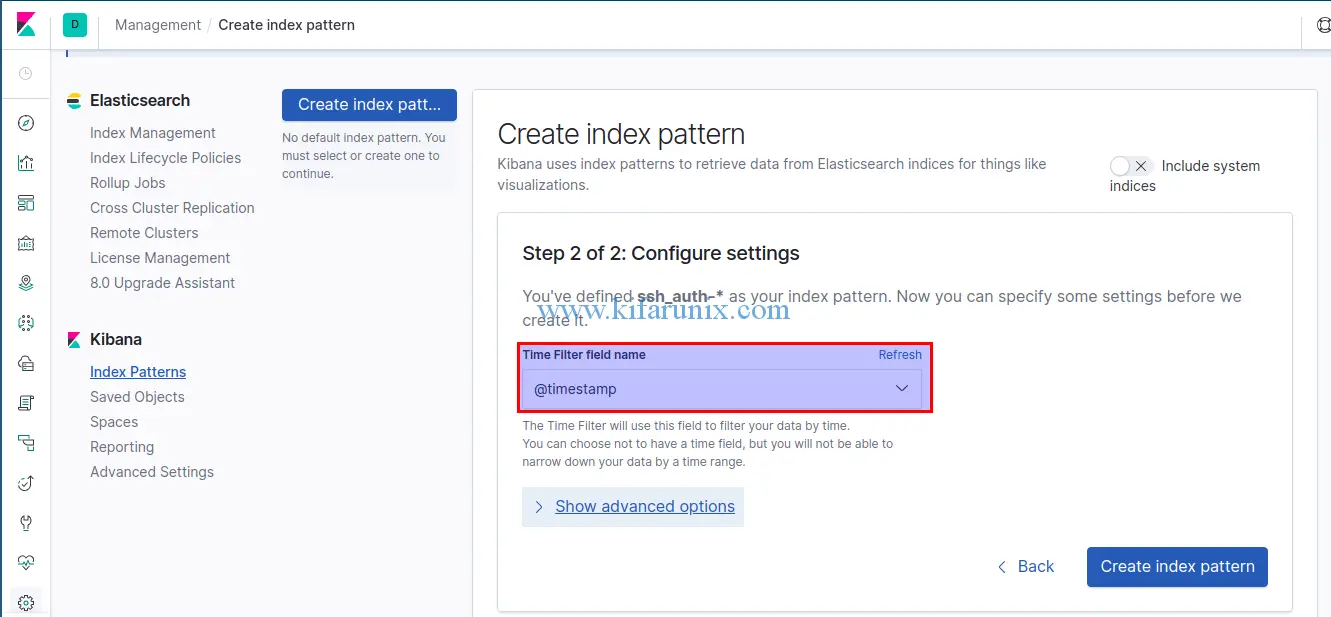
Proceed to the Next step and set the time field name to timestamp. Once that is done, click Create Index Pattern.
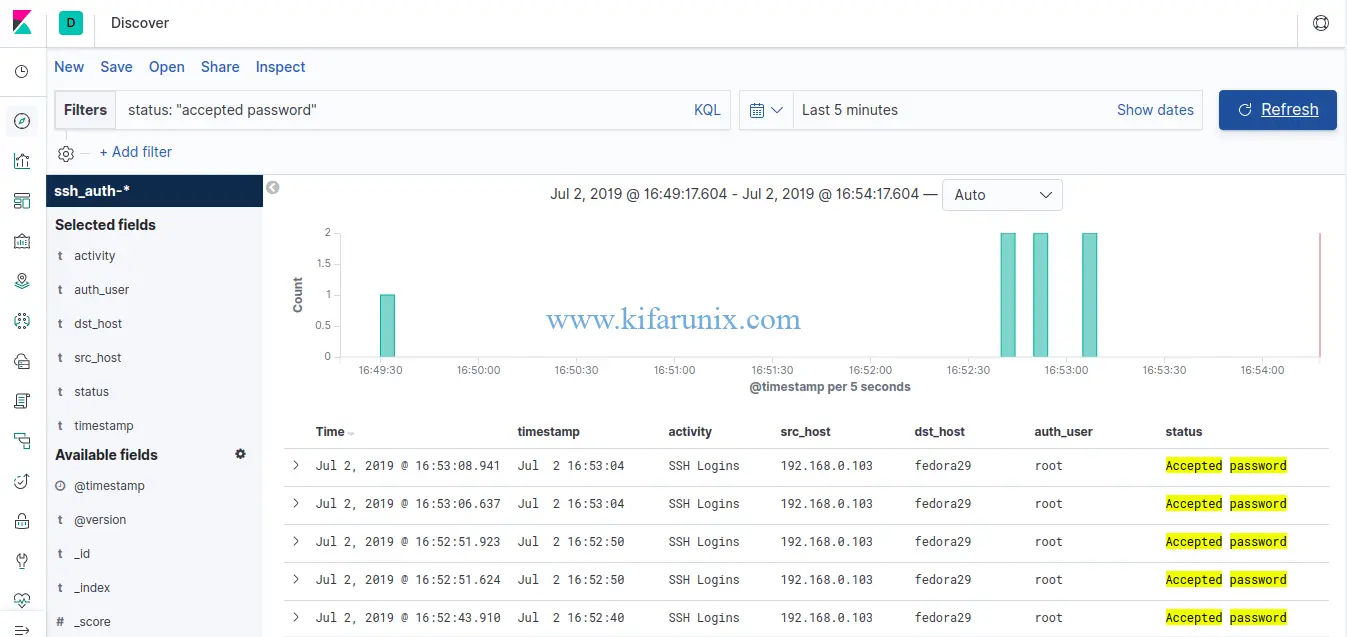
Next, click on Discover tab on the left panel of Kibana to see your parsed event data.
SSH successful Logins
SSH failed logins
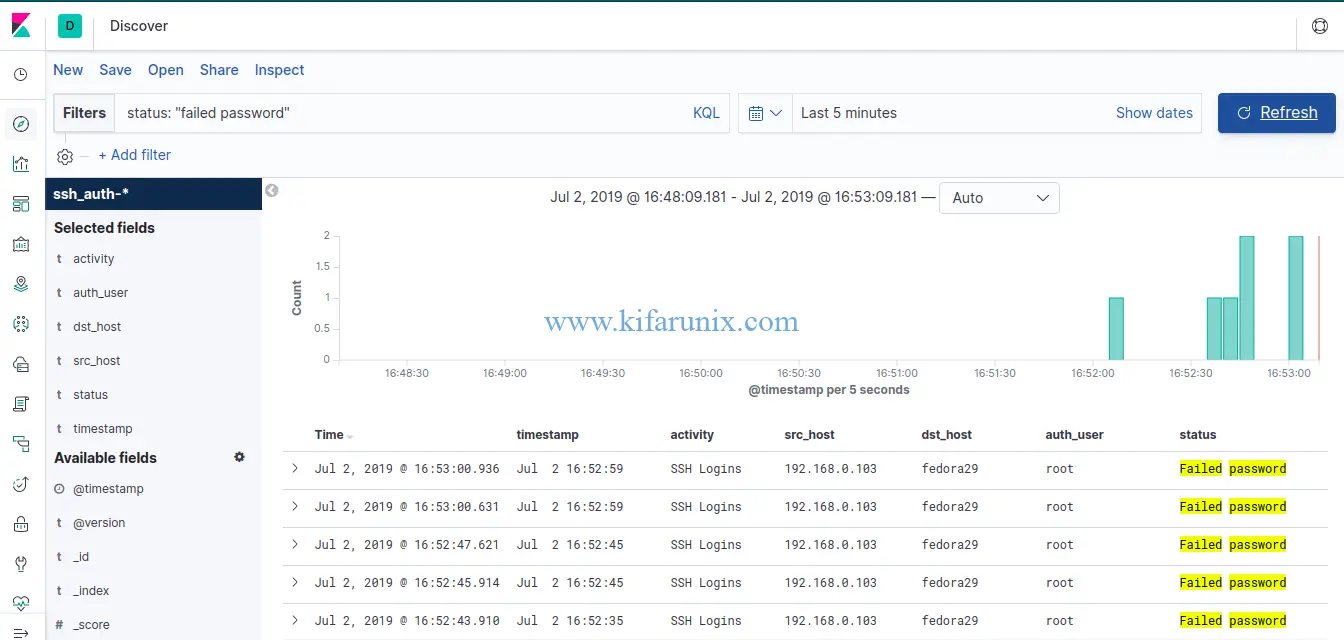
Well, as you can see, we have the fields that were extracted using our grok filter defined in our Logstash configuration on Fedora 30/Fedora 29/CentOS 7.
You can now proceed to collect events from other sources and push them to your Elastic Stack. Enjoy.
Reference;
Related Tutorials:
Install and Configure Logstash 7 on Ubuntu 18/Debian 9.8
Install and Configure Filebeat 7 on Ubuntu 18.04/Debian 9.8

