Integrate Prometheus with Grafana for Monitoring
This guide will take you through how to integrate Prometheus with Grafana for Monitoring. As much as Prometheus can give you some excellent visualization graphs,

This guide will take you through how to integrate Prometheus with Grafana for Monitoring. As much as Prometheus can give you some excellent visualization graphs,

In this tutorial, you will learn how to install ELK stack 8 on Debian 12 systems. Elastic/ELK stack 8.x has been released making it another

In this tutorial, you will learn how to easily configure Elasticsearch HTTPS Connection. You can configure your Beats; Filebeat, Metricbeat, Packetbeat, Logstash, Kibana, to securely
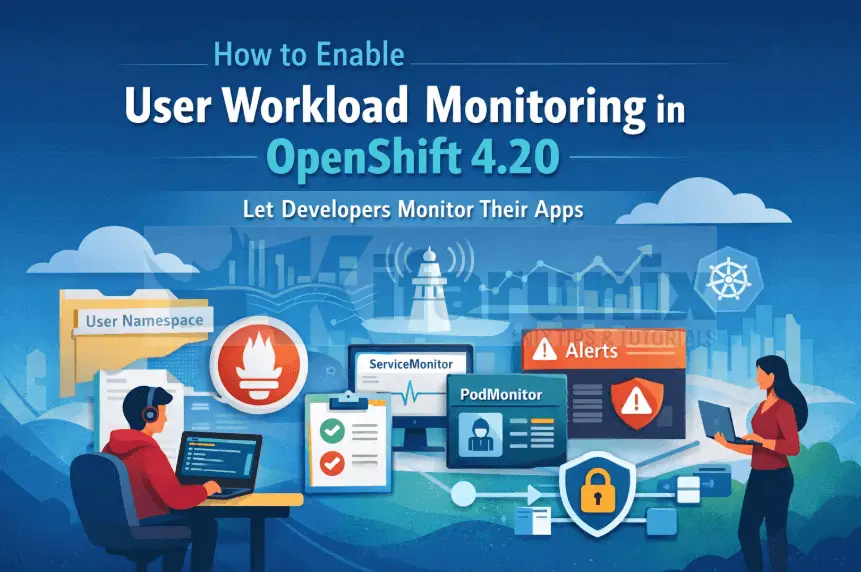
In this blog post, you will learn how to enable user workload monitoring in OpenShift 4.20 and empower developers to monitor their own applications. User
In this tutorial, we are going to learn how to monitor OpenVPN connections using openvpn-monitor tool. This tutorial focuses on monitoring OpenVPN connections established using

In this article, we are going to learn how to import assets to AlienVault USM/OSSIM using CSV file. The assets in this case refers to
In this tutorial, you will learn how to install and setup NetData on Ubuntu 20.04/18.04. NetData is a free and open source, distributed, real-time performance

In this guide, we are going to learn how to install osquery on Ubuntu 20.04. Osquery is an opensource tool that queries an operating system
In this tutorial, we are going to learn how to monitor system metrics with TICK stack on Ubuntu 20.04. TICK stack is an acronym for

In this tutorial, we will show you an easy way to configure Filebeat-Logstash SSL/TLS Connection. In order to sent encrypted data from Filebeat to Logstash,