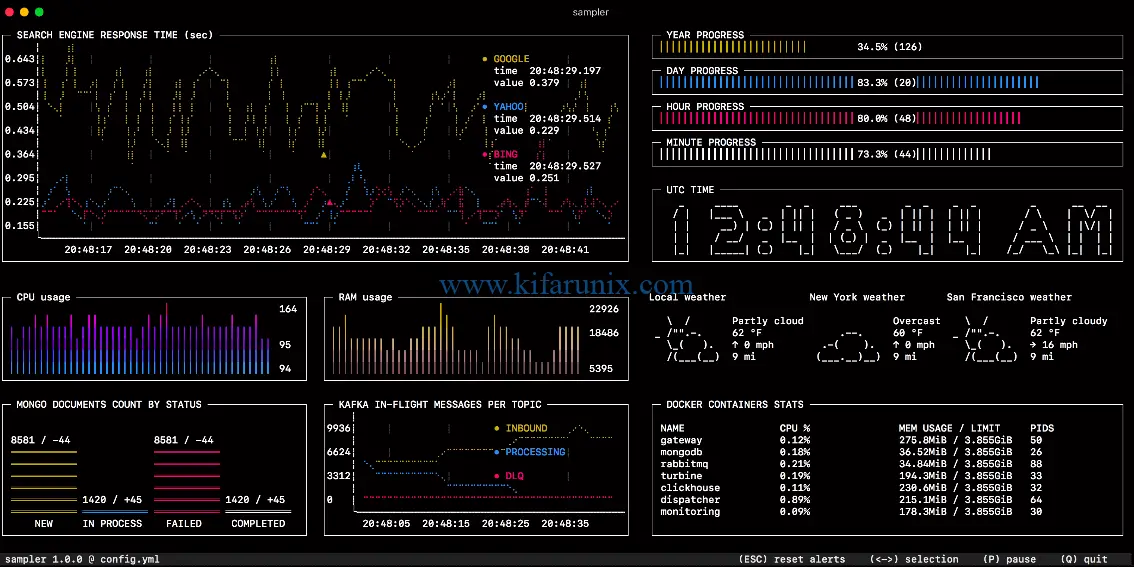
In this guide, you are going to learn how to install sampler shell command visualization tool on Linux. Sampler is a tool for shell commands execution, visualization and alerting.
Install Sampler Shell Command Visualization tool on Linux
Sampler is available as a binary that can just be downloaded and installed by placing it on the standard Unix directory for storing executable files.
Download Sampler Binary
wget https://github.com/sqshq/sampler/releases/download/v1.0.2/sampler-1.0.2-linux-amd64Install Sampler
Installing Sampler on Linux is as simple as copying the binary to /usr/bin directory renaming it as follows.
cp sampler-1.0.2-linux-amd64 /usr/bin/samplerNext, make the Sampler binary executable.
chmod +x /usr/bin/samplerUsage of Sampler
With Sampler, you can execute various shell scripts that gets you metrics and output them for visualization. Sampler is configured with a simple YAML file and hence, you need to define your shell commands in YAML configuration file.
Once you have created you shell commands configuration file, you can then pass it to Sampler for execution with -c option as in, sample -c config.yml.
Creating Sample Configuration File
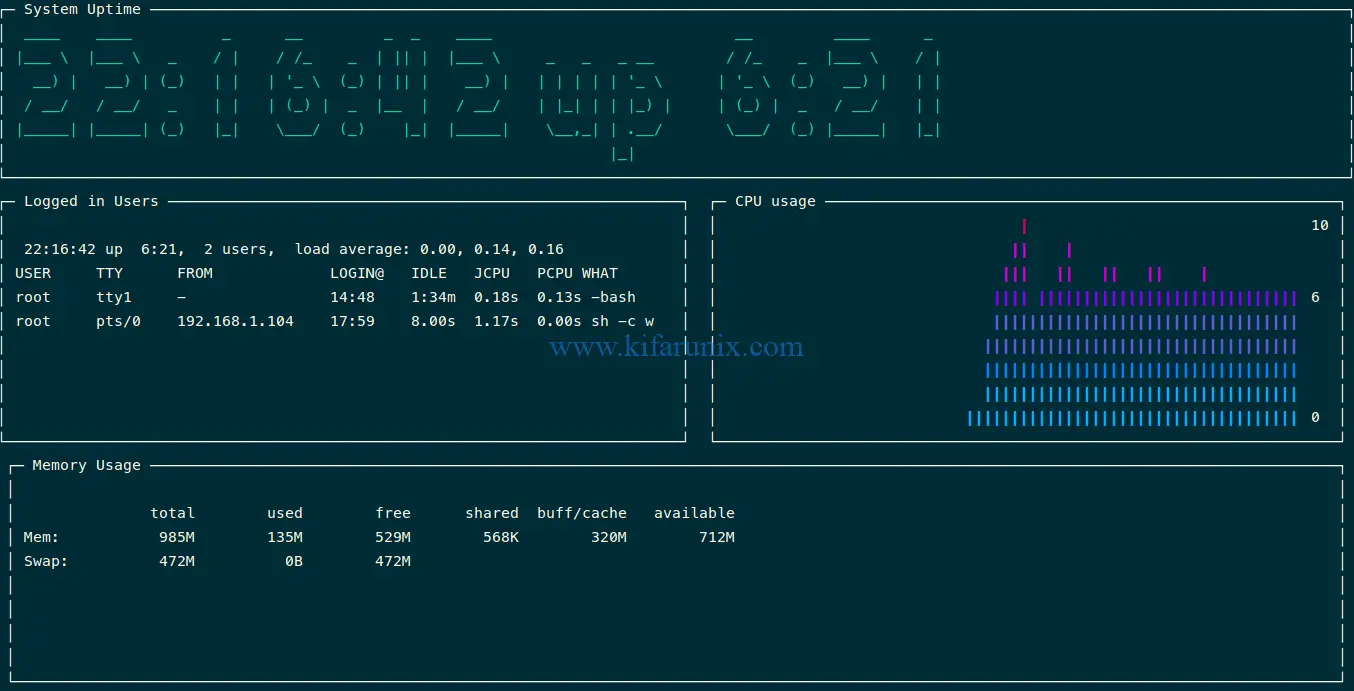
To begin, let us create a simple configuration file for visualizing a few shell commands. For example, to visualize the CPU usage, system uptime, number of logged in users, memory usage, you can create an YAML configuration like as shown below;
vim config.ymlsparklines:
- title: CPU usage
position: [[42, 12], [38, 16]]
rate-ms: 200
scale: 0
sample: ps -A -o %cpu | awk '{s+=$1} END {print s}'
textboxes:
- title: Memory Usage
position: [[1, 27], [79, 15]]
rate-ms: 200
sample: free -h
- title: Logged in Users
position: [[0, 12], [41, 16]]
rate-ms: 200
sample: w
asciiboxes:
- title: System Uptime
position: [[0, 0], [80, 12]]
rate-ms: 500
color: 43
sample: uptime | cut -d',' -f1To view the visualization, simply run Sampler with your configuration file as;
sampler -c config.yml
That is just it on simple Sampler shell command visualization.
If you need to see more examples of visualizations, check Sampler documentation page. Enjoy.
Other Tutorials
LATEST
Connect to WiFi in Linux Using NMCLI command
Extract Log Lines of Specific Dates from a Log File
Delete Lines Matching a Specific Pattern in a File using SED

